Meetmethoden Glenoïdaal botverlies
Uitgangsvraag
Welke meetmethode wordt aanbevolen om botverlies aan glenoïd-zijde te bepalen bij patiënten met verdenking op chronische posttraumatische anterieure schouderinstabiliteit?
Aanbeveling
Meet glenoïdaal botverlies bij patiënten met chronische posttraumatische anterieure schouderinstabiliteit op cross-sectionele beeldvorming op CT of MRI.
Kies hiervoor het liefst een lineaire meetmethode:
- bij voorkeur middels de best-fit circle methode (diameter botverlies/ diameter best-fit circle) * 100.
- Kies voor MRI indien lokale voorkeur uitgaat naar het bepalen van bipolair/ glenoïdaal botverlies middels glenoid track (diameter best-fit circle * 0.83 - diameter botverlies).
Overwegingen
Voor- en nadelen van de interventie en de kwaliteit van het bewijs
Het bepalen van de mate van glenoïdaal botverlies speelt een belangrijke rol in de keuze tussen wekedelen procedure en ossale reconstructie bij de operatieve behandeling van schouderinstabiliteit. Het is van groot belang dat de meting accuraat en betrouwbaar gebeurt. De manier waarop blijft onderwerp van discussie; in de laatste jaren was er een explosieve groei aan onderzoek, publicaties en reviews (Rossi, 2021). Een eenduidige conclusie of gouden standaard meetmethode is er niet. Er zijn zeer veel verschillende meetmethoden beschreven, toegepast op verschillende beeldvormende modaliteiten, waarbij bovendien zoals gebruikelijk nog eens sprake kan zijn van inter- en intrabeoordelaars verschillen. Ook is de literatuur onduidelijk over de optimale afkapwaarde met betrekking tot de mate van glenoïdaal botverlies om te kiezen voor een operatieve ingreep met al dan niet ossale reconstructie van het glenoïd (Cognetti, 2024; Hoyt, 2024). Zie ook de module Operatieve behandeling schouderinstabiliteit met twee of meer luxaties.
Waar de literatuur het wel over eens is: cross-sectionele imaging in de vorm van CT of MRI geniet de voorkeur om glenoïdaal botverlies te bepalen (Gouveia, 2022). Een zogenaamde ‘en face’ opname (verkregen met 2D MR of CT-acquisitie) of d.m.v. multiplanar reconstructie bij 3D MR imaging of CT) wordt gebruikt om optimaal de vorm van het glenoïd te bepalen en metingen te verrichten.
Voor de leesbaarheid van de richtlijn heeft de werkgroep besloten om de in de literatuur beschikbare meetmethoden op te delen in lineaire meetmethoden versus oppervlakte-gebaseerde meetmethoden. Hierbij is het van belang om te realiseren dat (afkap)waarden tussen de verschillende meetmethoden niet uitwisselbaar zijn (Bakshi, 2018).
De twee meest gebruikte voorbeelden van lineaire meetmethoden zijn de best-fit circle met diameter van het glenoïdaal botverlies en in recentere publicaties sinds de laatste jaren de glenoid track. Zie Figuur 1.
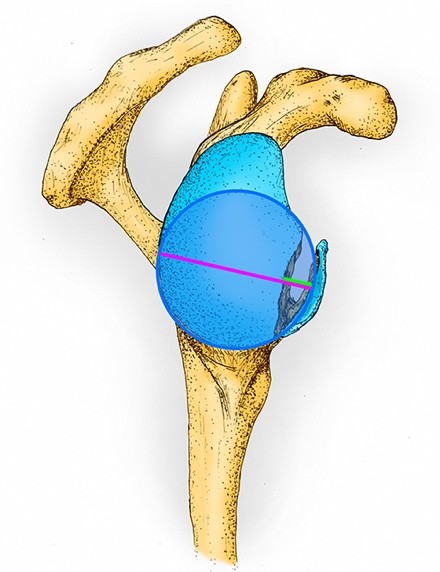
Figuur 1. De ‘best-fit circle’ over een scapula met glenoïdaal botverlies
Het figuur laat de rechter scapula vanuit een sagittaal aanzicht zien. De cirkel [blauw omlijnd] wordt getekend zodat het de ronde contouren langs de gehele (postero-)caudale rand van de intacte fossa glenoidalis zo goed mogelijk volgt. Om het percentage botverlies te berekenen wordt de diameter botverlies [groene lijn; de afstand tussen de anterieure rand van de cirkel en de intacte anterieure zijde van het glenoïd] gedeeld door de diameter van de cirkel [paarse lijn; haaks op de intacte anterieure rand van het glenoïd] en vermenigvuldigd met 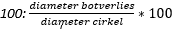 . Om de ‘glenoid track’ te bepalen, wordt de diameter van de cirkel [paarse lijn] vermenigvuldigd met 0,83 waarna de diameter botverlies [groene lijn] hiervan wordt afgetrokken:
 ![]()
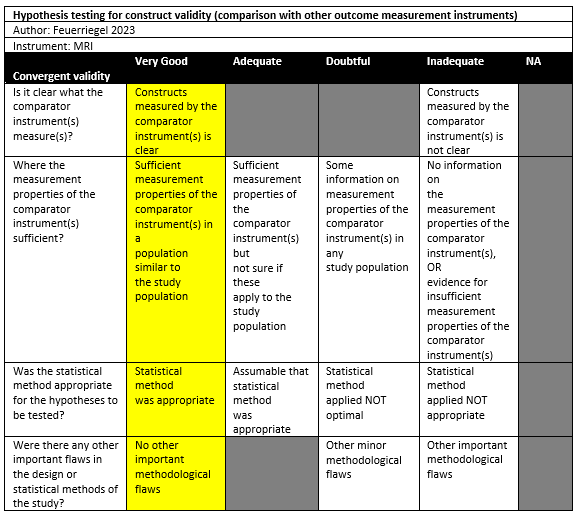
Waarschijnlijk zullen lineaire meetmethoden met MRI in de meeste gevallen acceptabel zijn ten opzichte van metingen op CT-beelden om het percentage glenoïdaal botverlies te meten. Drie studies rapporteerden correlatiecoëfficiënten boven de 0.90 (Tian, 2012; Feuerriegel, 2023; Kumar, 2023), maar belangrijker: drie studies rapporteerden 95% limits of agreement (LoAs) uit Bland-Altman plots die binnen 5% botverlies vielen (Lander, 2022; Feuerriegel, 2023; Cui, 2023). De meeste studies tekenden een zogenaamde ‘best-fit circle’ over het glenoïd om hiermee het percentage botverlies te berekenen door de diameter van het botverlies (d.w.z. de afstand tussen de anterieure zijde van de ‘best-fit circle’ tot de anterieure zijde van het intacte glenoid) te delen door de diameter van de ‘best-fit circle’ en te vermenigvuldigen met 100 (Chalmers, 2020; Feuerriegel, 2023; Lander, 2022; Sgroi, 2022; Tian, 2012). De twee studies van goede kwaliteit hadden weinig deelnemers bij elkaar opgeteld, waardoor er toch enige onzekerheid in de overeenkomst van lineaire meetmethoden tussen MRI en CT ontstaat.
Metingen van de glenoid track op MRI-beelden zouden daarnaast mogelijk overeen kunnen komen met metingen op CT-beelden, maar hier zijn we minder zeker over. De twee studies van goede kwaliteit (Cui, 2023; Feuerriegel, 2023), die tevens parameters voor overeenkomsten rapporteerden, hadden bij elkaar opgeteld slechts weinig deelnemers (n=38) waardoor deze onzekerheid ontstaat. De overeenstemming tussen MRI en CT hadden echter allemaal 95%LoAs onder de 2 millimeter in deze twee studies (Cui, 2023; Feuerriegel, 2023). Drie studies rapporteerden geen verschil in de gemiddelde metingen tussen beide modaliteiten (Cui, 2023; Lander, 2022; Sgroi, 2021). Alle studies gebruiken met een ‘best-fit circle’ dezelfde methode om de glenoid track mee te bepalen: 0,83 vermenigvuldigd met de diameter van de cirkel, en hiervan werd de diameter overeenkomend met het botverlies afgetrokken.
De meest beschreven voorbeelden van oppervlakte-gebaseerde meetmethoden zijn best-fit circle met oppervlakte van het glenoïdaal botverlies en de PICO-methode, waarin de oppervlakte van het botverlies wordt verhouden tot de intacte glenoïd-oppervlakte van de niet aangedane contralaterale schouder.
Voor oppervlakte-gebaseerde meetmethoden zijn wij echter zeer onzeker over de overeenkomst tussen metingen verricht op MRI en CT-beelden. Dit kwam met name doordat de twee grootste studies met deze meetmethoden elkaar tegenspraken (d.w.z. wel een significant versus geen significant verschil tussen gemiddelde metingen) en het risico op vertekening van de resultaten binnen studies. De enige studie die correlatiecoëfficiënten en 95%LoAs rapporteerde had binnen deze studie ook enigszins tegensprekende resultaten (Lansdown, 2019) waarbij het interval van de 95%LoAs van twee beoordelaars niet met elkaar overeen lijken te komen. Hierbij waren de intraclass correlatiecoëfficiënten voor correlatie tussen de modaliteiten weliswaar redelijk vergelijkbaar, maar overschreden de 95%LoAs van één van de beoordelaars de 5% (-4.9% tot 5.9%) terwijl de 95%LoAs van de tweede beoordelaar ruim onder de 5% bleven (-0.8% tot 0.9% en -1.9% tot 2.6%, respectievelijk). Studies gebruikten onderling veelal verschillende rekenmethoden om het botverlies mee te bepalen.
De werkgroep pleit tegen het gebruik van de oppervlakte-gebaseerde PICO-methode, vanwege de extra stralings-blootstelling en kosten van een CT van de contralaterale schouder.
Een hedendaags frequent gebruikte methode om gecombineerd botverlies aan zowel glenoïdale als humerale zijde (bipolair botverlies) te duiden middels beeldvorming is het zogenaamde on-track/off-track concept (DiGiacomo, 2014). In deze methode wordt de mate van glenoïdaal botverlies ten opzichte van het glenoïd contactoppervlak (glenoid track) gerelateerd aan de mate van humeraal botverlies in de vorm van het Hill Sachs Interval (zie hiervoor submodule Meetmethoden Humeraal botverlies). On-track laesies worden als stabiel beschouwd, waarbij de Hill-Sachs laesie binnen de glenoid track blijft. Bij off-track laesies (grotere Hill-Sachs laesies en/of significant botverlies van het glenoïd) reikt de Hill-Sachs laesie buiten de glenoid track, met een verhoogd risico op recidiverende luxaties. Deze bepaling kan derhalve bijdragen aan het te bepalen (chirurgisch) beleid. Zoals in submodule Meetmethoden Humeraal botverlies is beschreven, is dit Hill Sachs Interval (HSI) accurater meetbaar op MRI dan op CT door betere afgrensbaarheid van de rotator cuff musculatuur. Hierom adviseert de werkgroep te kiezen voor MRI in plaats van CT indien lokale voorkeur uitgaat naar het bepalen van bipolair botverlies middels het on-track/off-track concept.
Waarden en voorkeuren van patiënten (en evt. hun verzorgers)
CT kent een lagere belasting voor de patiënt; het onderzoek is sneller uitvoerbaar en heeft minder contra-indicaties, zoals aanwezigheid van metaal/ implantaten in het lichaam. Door de snelheid van het onderzoek is claustrofobie ook minder een probleem. CT is in de meeste Nederlandse ziekenhuizen toegankelijker, waardoor de patiënt minder lang op de wachtlijst staat. Waarschijnlijk hebben patiënten hierdoor een voorkeur voor CT. Daarentegen zal door het nadeel van stralenbelasting de patiënt mogelijk de voorkeur geven aan MRI. Het verrichten van slechts één preoperatief onderzoek, in plaats van de combinatie CT én MRI, draagt vanzelfsprekend ook bij aan verhoging van patiënten comfort.
Kosten (middelenbeslag)
Een MRI-onderzoek is duurder dan een CT-onderzoek. Buiten de bovengenoemde voor- en nadelen van beide modaliteiten, kan dit ook nog worden meegenomen in de overwegingen.
Naar verwachting kan deze richtlijn voor een vermindering in kosten zorgen, omdat nu vaak zowel CT als MRI worden gemaakt. Het doen van één onderzoek brengt minder kosten met zich mee.
Aanvaardbaarheid, haalbaarheid en implementatie
De werkgroep voorziet geen problemen met het implementeren van de aanbevelingen. In de huidige situatie wordt er gebruik gemaakt van ofwel CT, ofwel MRI (artrografie) of een combinatie van beide onderzoeken, gebaseerd op lokale voorkeur van orthopedisch/ traumachirurgen en radiologen. Metingen om ossale schade aan glenoïd en humeruskop te bepalen kunnen op beide modaliteiten op dezelfde manier worden verricht, mits 2D CT en MRI onderzoeken optimaal worden geanguleerd parallel aan het glenoïd, of er gebruik wordt gemaakt van een 3D-techniek zodat de beoordelaar zelf reconstructies kan maken. De werkgroep adviseert hierbij om een MRI-scanner met tenminste een veldsterkte van 1.5 Tesla te gebruiken, omdat hierbij een resolutie wordt gehaald die de corticale contouren van het glenoïd betrouwbaar weergeeft. Bij voorkeur worden ossale structuren beoordeeld op een T1-gewogen sequentie zonder vetonderdrukking.
Rationale van de aanbeveling: weging van argumenten voor en tegen de diagnostische procedure
De literatuur laat het de werkgroep niet toe een gouden standaard meetmethode te definiëren, vanwege uitgebreide heterogeniteit aan data en beperkte kwaliteit van de onderzoeken.
Alhoewel veel van de beschreven meetmethoden acceptabel zijn - er is wetenschappelijk niet één methode per se beter of slechter - geeft de werkgroep de voorkeur aan het meten van glenoïdaal botverlies op een “en face” beeld (in het geval van 2D MRI of CT) of reconstructie (in het geval van een 3D MRI of CT) van het glenoïd, middels een lineaire meetmethode, bij voorkeur de best-fit circle methode met diameter van het glenoïd botverlies. Dit omdat het de in de literatuur meest gebruikte meetmethode is, vergelijkbare resultaten oplevert op CT en MRI, en het een gemakkelijke en snelle methode is, die geen extra software behoeft. Met deze aanbeveling wil de werkgroep zorgdragen dat er voor een consistente meetmethode wordt gekozen.
Aangezien er geen significante verschillen beschreven zijn tussen CT en MRI, neemt de werkgroep beide modaliteiten op in haar advies. Gebaseerd op lokale voorkeur, waarbij men rekening houdt met logistieke beschikbaarheid, MRI contra-indicaties bij bepaalde patiëntengroepen, stralingshygiëne en eventuele wens tot bijkomend in kaart willen brengen van weke delen schade. Door de bewezen accuratere meting van het Hill Sachs Interval op MRI - zie submodule Meetmethoden Humeraal botverlies - adviseert de werkgroep om te kiezen voor MRI i.p.v. CT bij een lokale voorkeur voor het bepalen van bipolair botverlies middels de on-track/off-track methode. Belangrijk advies van de werkgroep blijft - conform submodule Beeldvorming MRI of CT - om te kiezen voor slechts één vorm van beeldvorming ter bepaling van glenoïdaal botverlies: ofwel CT of MRI.
Onderbouwing
Bone loss at the glenoid site occurs in 20% of primary shoulder dislocations and up to 90% of recurrent shoulder dislocations. The impact of contact with the humeral head causes remodeling and bone loss of the anteroinferior glenoid rim, and further instability of the shoulder joint. The presence and extent of bone loss contribute to the indication for surgery and the surgical technique. It is therefore crucial that the measurement of glenoid bone loss is accurate and reproducible. The qualitative “inverted pear configuration” was in 2000 the first method that was used to determine significant glenoid bone loss at the glenoid site (Burkhart and de Beer, 2000). In the following two decades, many studies have been published in which different imaging modalities, as well as different measurement methods and parameters are used to measure glenoid bone loss in a more quantitative way. It is currently unclear whether the different measurement methods and parameters applied to different imaging modalities agree with each other.
|
MODERATE GRADE |
The use of MRI probably results in comparable outcomes compared to CT for measuring glenoid bone loss using linear based measurement methods. Most studies used a best-fit circle to calculate the glenoid bone loss with the following formula: (diameter bone loss / diameter best-fit circle) * 100.
Sources: Chalmers, 2020; Cui, 2023; Feuerriegel, 2023; Kumar 2023; Lander, 2022;Sgroi, 2022; Stillwater, 2017; Tian, 2013 |
|
VERY LOW GRADE |
The evidence is very uncertain about whether the use of MRI results in comparable outcomes compared to CT for measuring glenoid bone loss using area-based measurement methods. Most studies used different area-based measuring methods to calculate the glenoid bone loss.
Sources: Chalmers, 2020; Lansdown, 2019; Sgroi, 2022; Stecco, 2013; Vopat, 2018 |
|
MODERATE GRADE |
The use of MRI probably results in comparable outcomes compared to CT for measuring the glenoid track. All studies used a best-fit circle to calculate the glenoid track length with the formula: (0.83 * circle diameter) – diameter bone loss.
Sources: Cui, 2023; Feuerriegel, 2023; Lander, 2022; Sgroi, 2021 |
Description of the systematic review
Liu (2024) performed a systematic review focusing on measurements of 3D MRI compared with 3D CT in assessing glenohumeral instability. On August 28, 2023, the following databases were searched by Liu (2024): PubMed, Cochrane Library, Embase, and Web of Science. The inclusion criteria for this review were: human studies, in English, the study’s content included 3D MRI and 3D CT for evaluation and diagnosis of glenohumeral joint, including assessment of glenoid bone loss, glenoid defects, and other indicators of the glenoid and humeral head using 3D MRI or 3D CT. The exclusion criteria included animal studies, basic science studies, narrative reviews, surveys, letters, editorials, case reports, reviews, conference abstracts, and expert opinions. In addition, only using 3D MRI or 3D CT for evaluating glenohumeral joint were excluded. Their selection resulted in the inclusion of 10 unique studies. The risk of bias of the individual studies was evaluated using the QUADAS-C.
Of the included 10 studies in this systematic review, four studies (Lander, 2022; Lansdown, 2019; Vopat, 2018; Stillwater, 2017) were eligible and included for the current guideline module. The four other studies were excluded due to being cadaveric studies (Yanke, 2017; Gyftopoulos, 2013; Ma, 2018), having no reported measurements of glenoid bone loss (de Mello, 2020; Kim, 2023), and for one study we needed to check the methods section, but the publication appeared to be in Cyrillic (Khominets, 2019). The characteristics and evaluation of risk of bias of the included six studies were used from the systematic review.
Description of the primary studies
Chalmers (2020) performed a retrospective study in a single institution in the setting of orthopaedic surgical department in the USA. The inclusion criteria were: Patients who underwent the surgical treatment for glenohumeral instability, and who underwent both a CT and an MRI performed within 1 year of each other. The exclusion criteria were patients who underwent an intervening surgical procedure on the shoulder. There were 53 patients included in the study. The mean age was 31 years (SD: 11), with 49% males. The index tests were CT and MRI, which were obtained within 1 year of each other. The mean interval was 45 days (SD: 83) between the CT and the MRI scans.
Cui (2023) performed a cross-sectional study in a single institution in the setting of radiology and orthopaedics department in China. The inclusion criteria were: Patients with shoulder dislocation between July 2022 and June 2023, age of 18 years or older, previous shoulder anterior dislocation, with completion of both MRI and CT of the shoulder joint, and the interval between MRI and CT was 1 week or less. Both patients with primary dislocation and patients with recurrent dislocation were included. The exclusion criterium was a history of shoulder osseous surgery. There were 16 out of 56 patients who had a bipolar bone lesion and included in the study. The mean age was 27.5 ± 9.5 for all 56 patients, with 70% males. The index tests were 3D CT and 3D MRI, which was performed with a maximum 1 week interval.
Feuerriegel (2023) conducted a cross-sectional study in a single institution in the setting of emergency department in Germany. The inclusion criteria were: Patients admitted to the emergency department with suspected traumatic dislocation of the shoulder, who underwent 3-T MRI of the shoulder within 2 days after trauma, with a CT examination as part of the diagnostic workup in clinical routine. No exclusion criteria were seemingly reported. There were 20 out of 46 patients included in the study. The mean age was 40 ± 14.5 for all 46 patients, with 59% males. The index tests were CT and MRI (T1 GRE, Fracture, UTE). The interval between MRI and CT was unclear but seemed to be performed both during clinical routine.
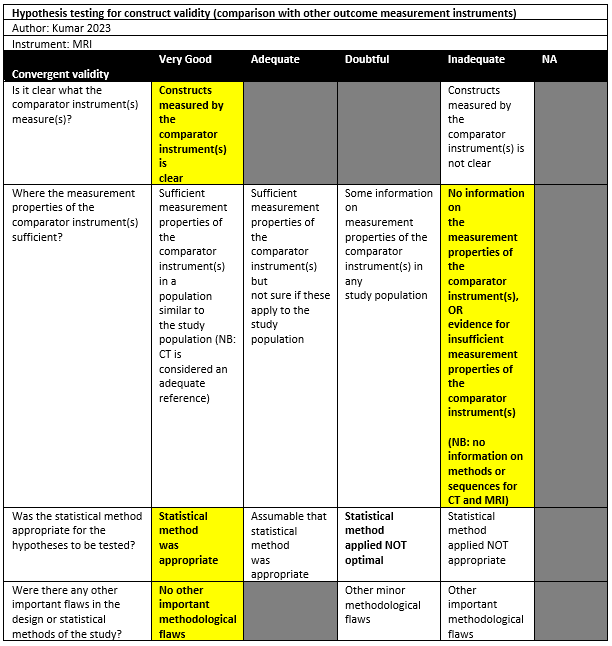
Kumar (2023) conducted a prospective study in a hospital setting. Persons with a history of shoulder dislocation were included. Persons with contraindications for MRI were excluded. A total of 38 patients were included with a mean age of 28.92 years (SD: 7.79). All were male. A 3D MRI and a 3D CT were used, but procedures and sequences do not seem to be described in the manuscript.
Sgroi (2021) conducted a cross-sectional study in a single institution in the setting of orthopaedic surgical department in Germany. The inclusion criteria were: Consecutive patients with anterior shoulder instability scheduled for arthroscopy were retrospectively enrolled postoperatively with arthroscopic or open shoulder stabilization and available CT and MRI scans of the affected shoulder. The exclusion criteria were: concomitant rotator cuff tear, incomplete imaging diagnostics, and insufficient CT or MRI scan quality. There were 50 out of 80 patients included in the study. The mean age was 26.4 years (SD: 11.8), with 74% males. The index tests were CT and MRI, which were performed as part of their preoperative diagnostic screening according to the routine clinical setup of the research setting.
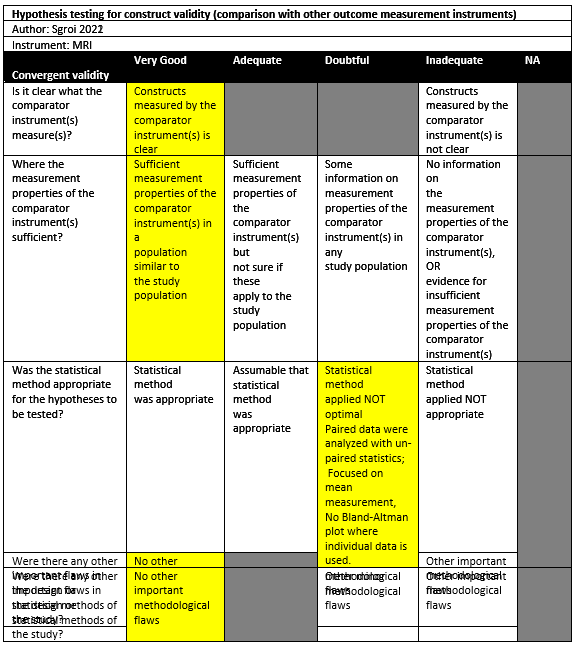
Sgroi (2022) investigated a retrospective diagnostic study in a single institution in the setting of orthopaedic surgical department in Germany. The inclusion criteria were: Patients with available preoperative AP radiographs, WP radiographs, CT, and MR images of the affected shoulder. The exclusion criteria were: not all planes or layers (such as sagittal, axial, or frontal) of each diagnostic imaging modalities were available (31%, 25 of 80), insufficient quality of diagnostic images (for example, setting of the layers did not allow adequate en face view of the glenoid, 6%, 5 of 80). There were 50 out of 80 patients included in the study. The mean age was 26 ± 12, with 74% males. The index tests were CT and MRI, which were described to be performed in the same period.
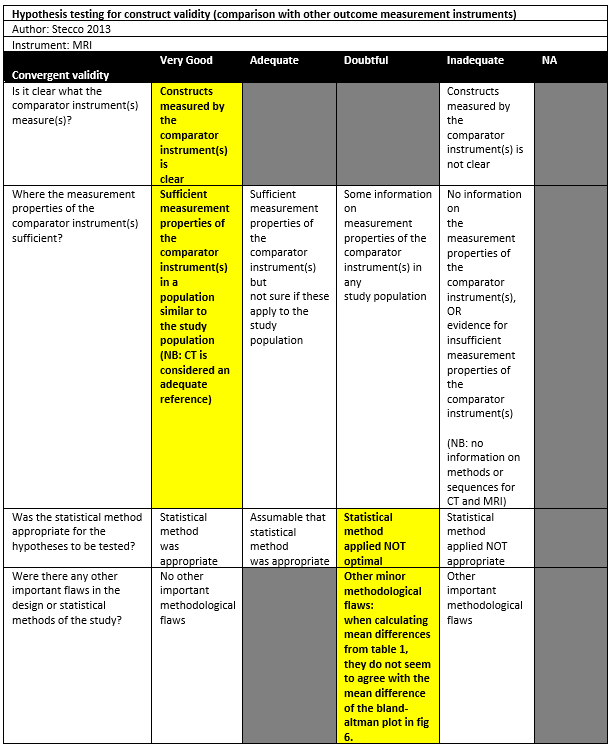
Stecco (2013) conducted a cross-sectional study in Italy, without reporting the detailed setting of the study. The inclusion criteria were: Patients affected by post-traumatic, unidirectional anterior instability, who underwent MRI and CT of their healthy and pathological shoulders on the same day. The exclusion criteria were not reported. There were 22 patients included in the study. The mean age was 28.8 (range 15-60), with 91% males. The index tests were CT and MRI, which were performed on the same day.
Tian (2012) performed a diagnostic study in the department of radiology in China, without reporting the detailed setting of the study. The inclusion criteria were: Patients referred to the author’s department for shoulder MR arthrography diagnostic test. Patients with glenoid bone loss on non-arthrographic MSCT examination were included. The exclusion criteria were patients with prior shoulder surgery. There were 40 patients out of the 56 patients who underwent the diagnosing test included in the study. The mean age for all 56 patients was 26 (range 14-51), with 82% males. The index tests were CT and MRI, which were performed on the same day.
Results
Results on linear measurement methods
Best-fit circle: (diameter bone loss / diameter best-fit circle) * 100
Lander (2022) found a mean difference of 0.08% between 3D CT and 3D MRI (95%LoA: -3.65 to 3.80).
Tian (2012) reported a mean of 10.96% (SD: 9.00) for MSCT measurements, compared to a mean of 10.48% (SD: 8.71) for 3D MRI (no significant difference; Spearman’s r = 0.912).
Chalmers (2020) found a mean difference of 2.9% (95%CI: 0.8-5.1), where CT had a mean of 23.5% (SD: 9.6) and MRI 20.5% (SD: 8.6) (significant difference: p<0.008).
Sgroi (2022) observed that CT had a median of 15.02% compared to 13.38% on MRI (not significant).
Feuerriegel (2023) reported a mean of 20.3% for CT and compared this to T1 GRE MRI (mean: 20.4%, SD: 7.6), Fracture MRI (mean: 20.6%, SD: 7.9), and UTE MRI (mean: 20.3%, SD: 7.7) while no significant differences were found. Agreement examined using a Bland-Altman plot showed 95% limits of agreement for CT versus T1 GRE MRI (95%LoA: -1.8% to 1.4%), CT versus Fracture (95%LoA: -2.1% to 1.6%), and CT versus UTE MRI (95%LoA: -1.9% to 1.9%). Correlation coefficients were also reported for the modalities: CT versus T1 GRE MRI (r=94). CT versus Fracture (r=0.91), and CT versus UTE MRI (r=0.98).
Best-fit circle: (diameter bone loss / diameter of intact glenoid) * 100
Kumar (2023) did not find statistical significant difference of 3D CT and 3D MRI measurements (CT: 16.53% [SD: 11.47], MRI: 61.03% [SD: 11.06]). The intraclass correlation coefficient between 3D CT and 3D MRI was 0.998.
Best-fit circle: (length of surface defect in circle / circle diameter)
In Sgroi (2022) this method was named the Gerber X ratio. Here, the median ratio for CT was 0.75 (range: 0.13-1.47), compared to 0.76 (range: 0.27-1.13) for MRI (no significant differences).
Best-fit circle: [(circle diameter – diameter of intact glenoid) / circle diameter] * 100
Stillwater (2017) observed a mean of 15.6% (SD 5.8) glenoid bone loss on 3D CT and a mean of 15.2% (SD 5.5) on 3D MRI (not statistically significant).
Best-fit circle: (distance from center to anterior rim of defect / distance from center to posterioir rim of glenoid) * 100
Sgroi (2022) used this method (A-P method) and observed a bone loss of 15.48% (range: 1.44-42.01) with CT and 12.88% (range: 1.43-36.34) for MRI. The median difference was not statistically significant.
Best-fit circle: (radius of circle – distance from center of circle to anterior rim of defect) / 2*radius circle ] * 100
Cui (2023) used Bland-Altman plots for agreement between 3D CT and 3D MRI. A mean difference of 0.29% (CT minus MRI) was observed with 95% limits of agreement from -1.5% to 2.11%.
Results on surface area measurement methods
Best-fit circle: 1 – [(area of circle of unaffected glenoid – area of intact glenoid of affected side within circle) * 100]
Lansdown (2019) used two raters to measure the bone loss (rater 2 measured every participant twice). Rater 1 measured a mean of 13% (SD 8) on CT and 13% (SD 7) on MRI (95%LoA -4.9 to 5.9%, ICC=0.94 [95%CI: 0.83-0.98]). Rater 2 measured a mean of 16 % (SD 8) on CT and 16% (SD8) on MRI (95%LoA: -0.8 to 0.9, ICC=0.99 [95%CI: 0.99-1.00) on the first trial. On the second trial, rater 2 measured a mean of 14% (SD 8) on CT and 14% (SD 7) on MRI (95%LoA: -1.9% to 2.6%, ICC= 0.99 [95%CI: 0.97-1.00]).
Best-fit circle: (area of articular surface of defect / best-fit circle area) * 100
Sgroi (2022) measured a median of 14.1% (range: 0.87-38.25) with CT using this method. For MRI, the mean was 11.72% (range: 2.45-37.97). The difference was not statistically significant.
Best-fit circle: (in-circle area of glenoid defect / best-fit circle area ) * 100
Stecco (2013) observed a mean bone loss area of 3.34% (or 21.94mm2) as measured by CT and 4.38% (or 22.49mm2) as measured by MRI, which was not a statistically significant difference. A Bland-Altman plot showed a mean difference of -0.7 (CT minus MRI) with 95%LoA of -3.7 to 2.4, however it is unclear whether this was measured as percentage or square millimetres as the difference of both means does not equal -0.7.
Chalmers (2020) found a mean of 18.3% (SD 7.5) bone loss as measured with CT, compared to 16.8% as measured with MRI which was a statistically significant difference (mean difference = 1.6%, 95%CI: 0.5-2.7, p=0.03).
Best-fit circle: (best-fit circle area – surface area of glenoid socket within circle) / best-fit circle area * 100
Vopat (2018) used both automated and manual methods to measure glenoid bone loss parameters. With automated methods, 3D CT had a mean of 6.6% (range: 3.7-10.0) bone loss and MRI 6.5% (range: 5.1-9.2), while being statistically non-significant. Manual methods showed a mean of 6.6% (range: 3.8-8.9) for 3D CT measurements, compared to 6.5% (range: 4.6-9.5) for MRI without being statistically significant.
Glenoid track
Glenoid track: (0.83 * circle diameter) – diameter bone loss
Lander (2022) did not show the glenoid track in millimetres, but reported there were no differences between the imaging modalities.
Sgroi (2021) measured the glenoid track both on CT (mean 21.6mm [SD 0.5]) and MRI (mean 21.5 [SD 0.4]) and found no statistically significant differences.
Cui (2023) found a mean glenoid track of 18.02mm (SD 2.97) using 3D CT and compared this to a mean of 18.08mm (SD 2.98) on 3D MRI. However, there was not a statistically significant difference found.
Fuerriegel (2023) reported the mean glenoid track using CT being 8.2 mm (SD: 7.1) and compared this to T1 GRE MRI (8.1 mm [SD 7.1]), Fracture MRI (8.2mm [SD 7.1]), and UTE MRI (8.2mm [SD: 7.1]). Differences were not statistically significant.
Chalmers (2020) reported the proportion classified as on-track as measured by CT and MRI by two raters.
Table 2. Overview of the results
|
Method |
Measurement |
Difference |
Correlation |
Agreement |
Outcome assessment* |
Risk of bias |
|||||
|
CT |
MRI |
||||||||||
|
Linear measurement methods |
|
||||||||||
|
Best-fit circle: (diameter bone loss / diameter best-fit circle) * 100 |
|
||||||||||
|
Lander 2022 |
11.8 |
11.94 |
- |
- |
Bland-Altman plot: mean difference: 0.08, 95% LoA: -3.65, 3.80 |
+ |
High† |
||||
|
Tian 2012 |
10.96± 9.00 |
10.48± 8.71 |
Paired t test not significant |
Spearman rank coefficient (r)=0.912 |
|
+ |
Adequate‡ |
||||
|
Chalmers 2020 |
23.5±9.6 |
20.5±8.6 |
Difference: 2.9 [0.8-5.1]; Paired t test: P<0.008 |
- |
- |
? |
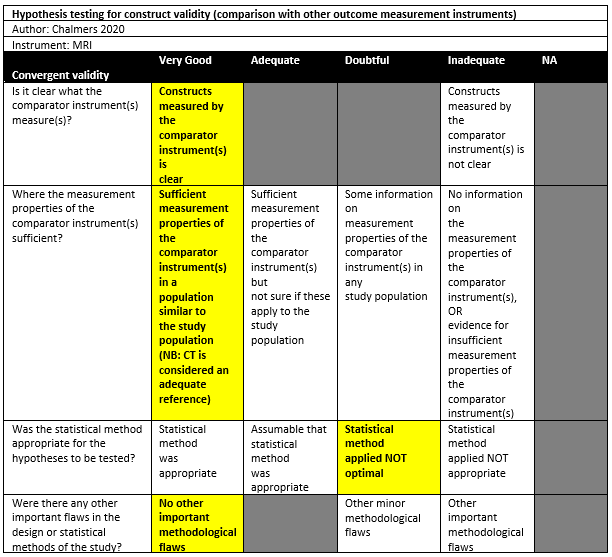
Doubtful‡ |
||||
|
Sgroi 2022 |
15.02 (2.48-41.59)
|
13.38 (2.00-36.34)
|
Difference of medians: 1.64; Wilcoxon signed-rank test: not significant. |
- |
- |
? |
Doubtful‡ |
||||
|
Feuerriegel 2023 |
20.3±8.0 |
T1 GRE: 20.4±7.6; Fracture: 20.6±7.9; UTE: 20.3±7.7 |
- |
CT vs T1 GRE: Pearson's correlation: 0.94 CT vs Fracture: Pearson's correlation: 0.91 CT vs UTE: Pearson's correlation: 0.98 |
CT vs T1 GRE: Bland-Altman plot: mean: not reported; 95% LoA: -1.80,1.50 CT vs Fracture: Bland-Altman plot: mean: not reported; 95% LoA: -2.20, 1.75; CT vs UTE: Bland-Altman plot: mean: not reported; 95% LoA: -1.85,1.95 |
+ (T1GRE) + (Fracture) + (UTE) |
Very good‡ |
||||
|
Best-fit circle: (diameter bone loss / diameter of intact glenoid) * 100 |
|||||||||||
|
Kumar 2023 |
16.53% [SD: 11.47] |
16.03% [SD: 11.06] |
No statistical significant difference |
ICC=0.998 |
- |
+ |
Inadequate‡ |
||||
|
Best-fit circle: (length of surface defect in circle / circle diameter) |
|||||||||||
|
Sgroi 2022 |
0.75 (0.13-1.47) |
0.76 (0.27-1.13) |
Difference of medians: 0.01; Wilcoxon signed-rank test: not significant. |
- |
- |
? |
Doubtful‡ |
||||
|
Best-fit circle: [(circle diameter – diameter of intact glenoid) / circle diameter] * 100 |
|||||||||||
|
Stillwater 2017 |
15.6±5.8 |
15.2±5.5 |
Not statistically significant |
- |
- |
? |
High† |
||||
|
Best-fit circle: (distance from center to anterior rim of defect / distance from center to posterior rim of glenoid) * 100 |
|||||||||||
|
Sgroi 2022 |
15.48 (1.44-42.01) |
12.88 (1.43-36.34)
|
Difference of medians: 2.60; Wilcoxon signed-rank test: not significant |
- |
- |
? |
Doubtful‡ |
||||
|
Best-fit circle: [(circle diameter – diameter of intact glenoid) / circle diameter] * 100 |
|||||||||||
|
Cui 2003 |
16.21±5.95 |
16.61±5.66 |
Paired t test not significant |
- |
Bland-Altman plot: mean: 0.29; 95% LoA: -1.54, 2.11 |
+ |
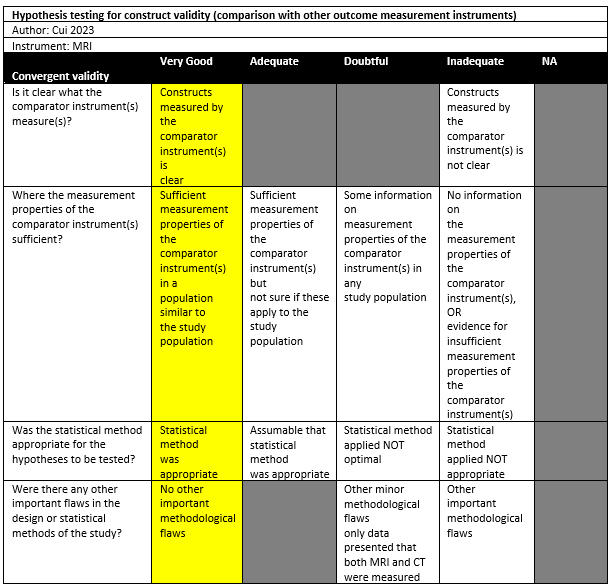
Very good‡ |
||||
|
Surface area methods |
|||||||||||
|
Best-fit circle: 1 – [(area of circle of unaffected glenoid – area of intact glenoid of affected side within circle) * 100] |
|||||||||||
|
Lansdown 2019 |
R1: 13±8; R2: 16±8; R2': 14±8 |
R1: 13±7; R2: 16±8; R2': 14±7 |
|
R1: ICC=0.94 (0.83-0.98) R2: ICC=0.99 (0.99-1.00) R2’: ICC=0.99 (0.97-1.00) |
R1: difference: 2.19±1.65, 95%LoA: -4.9, 5.9 R2: difference: 0.38±0.16, 95%LoA: -0.8, 0.9 R2’: difference: 0.79±0.88, 95%LoA: -1.9, 2.6 |
– (R1) + (R2) |
High† |
||||
|
Best-fit circle: (area of articular surface of defect / best-fit circle area) * 100 |
|||||||||||
|
Sgroi 2022 |
14.01 (0.87-38.25) |
11.72 (2.45-37.97) |
Difference of medians: 2.29; Wilcoxon signed-rank test: not significant |
- |
- |
? |
Doubtful‡ |
||||
|
Best-fit circle: (in-circle area of glenoid defect / best-fit circle area) * 100 |
|||||||||||
|
Stecco 2013 |
4.34 |
4.38 |
Not statistically significant |
- |
- |
? |
Doubtful‡ |
||||
|
Chalmers 2020 |
18.3% (SD 7.5) |
16.8% (SD 7.1) |
Mean difference = 1.6%, 95%CI: 0.5-2.7, p=0.03 |
- |
- |
? |
Doubtful‡ |
||||
|
Best-fit circle: (best-fit circle area – surface area of glenoid socket within circle) / best-fit circle area * 100 |
|||||||||||
|
Vopat 2018 |
Automated: 6.6% (range: 3.7-10.0) Manual: of 6.6% (range: 3.8-8.9) |
Automated: 6.5% (range: 5.1-9.2) Manual: 6.5% (range: 4.6-9.5) |
Both automated and manual methods: no statistically significant difference |
- |
- |
? |
High† |
||||
|
Glenoid Track |
|||||||||||
|
Best-fit circle: (0.83 * circle diameter) – diameter bone loss |
|||||||||||
|
Lander 2022 |
- |
- |
Reported that there were no differences between the imaging modalities |
- |
- |
? |
High† |
||||
|
Sgroi 2021 |
21.6 ± 0.5 |
21.5 ± 0.4 |
Paired t test: not siginificant. |
- |
- |
? |
Doubtful‡ |
||||
|
Cui 2023 |
18.02 ± 2.97 |
18.08 ± 2.98 |
Paired t test: not significant |
- |
Bland-Altman plot: mean: -0.02; 95% LoA: -1.22, 1.17 |
+ |
Very good‡ |
||||
|
Feuerrigel 2023 |
8.2 ± 7.1 |
T1 GRE: 8.1 ± 7.1 Fracture: 8.2 ± 7.1 UTE: 8.2 ± 7.1 |
- |
- |
CT vs T1 GRE: Bland-Altman plot: mean: not reported; 95% LoA: -1.35, 0.80; CT vs Fracture: Bland-Altman plot: mean: not reported; 95% LoA: -1.30, 1.00; CT vs UTE: Bland-Altman plot: mean: not reported; 95% LoA: -1.20, 0.90; |
+ |
Very good‡ |
||||
|
Abbreviations: GBL, glenoid bone loss. 95% LoA: 95% limit of agreement. ICC, Intraclass correlation coefficient. R1: rater 1, R2: rater 2, R2’: Rater 2 re-assessment. * Outcomes were rated as + (sufficient, when: correlation ≥0.70, AUC ≥0.70, Kappa ≥7.0), – (insufficient, when correlation <0.70, AUC <0.7, Kappa <7.0), or ? (indeterminate, when correlation, AUC or Kappa not reported) based on the criteria for good measurement properties (Prinsen, 2018). Bland-Altman plots showing 95% limits of agreement within the intervals of clinical relevance (±2mm [glenoid track], ±5% [proportion bone loss] from 0 [i.e. no difference]) were also rated as + (sufficient) even if a correlation coefficient is absent. †QUADAS-C assessment from Liu (2024) was used. ‡Assessed with COSMIN risk of bias tool. |
|||||||||||
Level of evidence of the literature
Linear based measurement methods for glenoid bone loss
The level of evidence regarding measuring glenoid bone loss using linear based measurement methods was downgraded by 1 level because of the number of included patients (1 level for imprecision: the number of included patients is below 100 for the studies with adequate or very good quality). We did not downgrade for risk of bias (reason: two studies with very good quality), inconsistency (Reason: findings appear to be relatively similar between studies), and indirectness (reason: seems to be no deviation). Publication bias was not assessed.
Area based measurement methods for glenoid bone loss
The level of evidence regarding measuring glenoid bone loss using area-based measurement methods was downgraded by 3 level because of limitations in the studies (1 level for risk of bias: only studies of doubtful quality) and heterogeneity (2 levels for inconsistency: the two largest studies reported conflicting results [statistically significant vs. not statistically significant differences]. We did not downgrade for imprecision (reason: total number of participants was >100) and indirectness (reason: seems to be no deviation). Publication bias was not assessed.
Glenoid Track
The level of evidence regarding measuring the glenoid track was downgraded by 2 levels because of the number of participants (1 levels for imprecision: the total sample was <100 We did not downgrade for risk of bias (reason: Two studies with very good quality), inconsistency (correlation coefficients and 95%LoAs appear to be relatively similar), and indirectness (reason: seems to be no deviation). Publication bias was not assessed.
A systematic review of the literature was performed to answer the following question:
‘’Which measurement method is the most accurate to measure glenoid bone loss in patients diagnosed with posttraumatic shoulder instability?’’
Table 1. PICO
| Patients | Patients with posttraumatic shoulder instability and glenoid bone loss, confirmed by CT or MRI |
| Intervention | Different measurement methods of glenoid bone loss in literature by MRI: linear glenoid defect, area-based glenoid defect, glenoid track |
| Control | Different measurement methods of bone loss in literature by CT |
| Outcomes | Agreement and correlation parameters on a continuous or categorical level of bone loss measurement (e.g. ICC, Bland-Altman plot, Kappa) |
Relevant outcome measures
The guideline development group considered agreement parameters as a critical outcome measure for decision making; and tests for differences and correlations as an important outcome measure for decision making.
A priori, the guideline development group did not define the outcome measures listed above but used the definitions used in the studies. Outcomes were rated as ‘sufficient’ (correlation ≥0.70, AUC ≥0.70, Kappa ≥0.70), ‘insufficient’ (correlation <0.70, AUC <0.70, Kappa <0.70), or ‘indeterminate’ (correlation, AUC or Kappa not reported) based on the criteria for good measurement properties (Prinsen, 2018).
The guideline development group defined a clinically relevant difference of more than 5% compared to CT assessment as a clinically important disagreement of glenoid bone loss measurements (both linear and area based), and 2mm for measurement of the glenoid track. This is acknowledged to be an arbitrary choice since evidence regarding the clinical importance of these differences is lacking. Bland-Altman plots showing 95% limits of agreement within these intervals (±2mm, ±5% from 0; i.e. no difference) will be rated as ‘sufficient’, even when a correlation coefficient is absent.
Search and select (Methods)
The databases Medline (via OVID) and Embase (via Embase.com) were searched with relevant search terms (after 2000) until February 6, 2024. The detailed search strategy is depicted under the tab Methods. The systematic literature search resulted in 960 hits. Studies were selected based on the following criteria: the population were patients with post-traumatic shoulder instability and glenoid bone loss, the measurement of bone loss was performed by both MRI and CT tests, the comparison of the measurements by MRI and CT was reported. Cadaveric studies were excluded as these studies were not performed in the clinical setting. Studies reporting only a coefficient (e.g., Intraclass correlation coefficient, Pearson’s coefficient etc.) between the measurement and CT without providing more insight of the measurements were excluded.
Because there are a high number of individual studies for this research question, and continuous new systematic reviews are being published, the search has been updated on July 1st, 2024, to cover the latest systematic reviews for this research question. The updated search strategy is depicted under the tab Methods, beneath the original search strategy. The updated systematic literature search resulted in 8 reviews. The reviews were selected based on the following criteria: the population were patients with post-traumatic shoulder instability and glenoid bone loss, the measurement of glenoid track size and/or the measurement of bone loss using linear or area-based methods was performed by both MRI and CT tests, the comparison of the measurements by MRI and CT was reported. After the title and abstract screening, two systematic reviews fulfilled the PICO, where one was excluded due to overlapping data, and the other one was included.
In total, 69 studies were initially selected based on title and abstract screening. The guideline development group checked the methods of the full-text studies to determine whether different measurement methods of glenoid bone loss by MRI and CT was reported. After reading the full text, 60 studies were excluded (see the table with reasons for exclusion under the tab Methods), and one systematic review (containing four eligible primary studies) and eight additional primary studies were included.
Results
One systematic review with four relevant primary studies (Liu, 2024) and eight other primary studies were included in the analysis of the literature. Important study characteristics and results were extracted in the evidence tables. For studies included in the systematic reviews, the study characteristics were extracted from the systematic review. In case of relevant results that were not reported in the systematic review, these relevant results were from extracted from original studies and added in the summary of results. Results are summarized in Table 1. For studies in the systematic reviews, the risk of bias assessments as reported in the systematic review was used. For other individual primary studies, the assessment of the COSMIN risk of bias is summarized in the risk of bias tables.
- Bakshi NK, Cibulas GA, Sekiya JK, Bedi A. A Clinical Comparison of Linear- and Surface Area-Based Methods of Measuring Glenoid Bone Loss: Response. Am J Sports Med. 2019 Mar;47(4):NP29-NP30. doi: 10.1177/0363546519825630. PMID: 30870035.
- Burkhart SS, De Beer JF. Traumatic glenohumeral bone defects and their relationship to failure of arthroscopic Bankart repairs: significance of the inverted-pear glenoid and the humeral engaging Hill-Sachs lesion. Arthroscopy. 2000 Oct;16(7):677-94. doi: 10.1053/jars.2000.17715. PMID: 11027751.
- Chalmers PN, Christensen G, O'Neill D, Tashjian RZ. Does Bone Loss Imaging Modality, Measurement Methodology, and Interobserver Reliability Alter Treatment in Glenohumeral Instability? Arthroscopy. 2020 Jan;36(1):12-19. doi: 10.1016/j.arthro.2019.06.025. PMID: 31864563.
- Cui DD, Long Y, Yan Y, Li C, Yang YT, Zhong JL, Yang R. Three-Dimensional Magnetic Resonance Imaging Fast Field Echo Resembling a Computed Tomography Using Restricted Echo-Spacing Sequence Is Equivalent to 3-Dimensional Computed Tomography in Quantifying Bone Loss and Measuring Shoulder Morphology in Patients With Shoulder Dislocation. Arthroscopy. 2024 Jun;40(6):1777-1788. doi: 10.1016/j.arthro.2023.12.016. Epub 2023 Dec 27. PMID: 38154531.
- Cognetti DJ, DeFoor MT, Hartzler RU, Sheean AJ. Glenoid augmentation for subcritical bone loss: a narrative review. Ann Jt. 2024 Apr 9;9:15. doi: 10.21037/aoj-23-36. PMID: 38690075; PMCID: PMC11058534.
- Di Giacomo G, Itoi E, Burkhart SS. Evolving concept of bipolar bone loss and the Hill-Sachs lesion: from "engaging/non-engaging" lesion to "on-track/off-track" lesion. Arthroscopy. 2014 Jan;30(1):90-8. doi: 10.1016/j.arthro.2013.10.004. PMID: 24384275.
- Gouveia K, Rizvi SFH, Dagher D, Leroux T, Bedi A, Khan M. Assessing Bone Loss in the Unstable Shoulder: a Scoping Review. Curr Rev Musculoskelet Med. 2022 Oct;15(5):369-376. doi: 10.1007/s12178-022-09773-4. Epub 2022 Jul 5. PMID: 35788508; PMCID: PMC9463415.
- Hoyt BW, Tisherman RT, Popchak AJ, Dickens JF. Arthroscopic Bone Block Stabilization for Anterior Shoulder Instability with Subcritical Glenohumeral Bone Loss. Curr Rev Musculoskelet Med. 2024 Nov;17(11):465-475. doi: 10.1007/s12178-024-09921-y. Epub 2024 Aug 19. PMID: 39158663; PMCID: PMC11464743.
- Kumar G.N., Ramesh M., Elavazhagan K. A PROSPECTIVE STUDY TO ASSESS THE ROLE OF MAGNETIC RESONANCE IMAGING IN ASSESSING GLENOID BONE LOSS IN SHOULDER DISLOCATION. International Journal of Academic Medicine and Pharmacy 2023 5:2 (1030-1033)
- Lander ST, Liles JL, Kim BI, Taylor DC, Lau BC. Comparison of computed tomography and 3D magnetic resonance imaging in evaluating glenohumeral instability bone loss. J Shoulder Elbow Surg. 2022 Nov;31(11):2217-2224. doi: 10.1016/j.jse.2022.06.015. Epub 2022 Aug 2. PMID: 35931334.
- Lansdown DA, Cvetanovich GL, Verma NN, Cole BJ, Bach BR, Nicholson G, Romeo A, Dawe R, Yanke AB. Automated 3-Dimensional Magnetic Resonance Imaging Allows for Accurate Evaluation of Glenoid Bone Loss Compared With 3-Dimensional Computed Tomography. Arthroscopy. 2019 Mar;35(3):734-740. doi: 10.1016/j.arthro.2018.10.119. Epub 2019 Feb 4. PMID: 30733040.
- Liu G, Huang C, Li Y, Jiang S, Lu W, Yacoub Hassan MH, Essien AE, Pavel V, Xiao W. Accuracy and Consistency of 3-Dimensional Magnetic Resonance Imaging Is Comparable With 3-Dimensional Computed Tomography in Assessing Glenohumeral Instability: A Systematic Review. Arthroscopy. 2024 Apr 9:S0749-8063(24)00266-4. doi: 10.1016/j.arthro.2024.03.043. Epub ahead of print. PMID: 38599537.
- Prinsen CAC, Mokkink LB, Bouter LM, Alonso J, Patrick DL, de Vet HCW, Terwee CB. COSMIN guideline for systematic reviews of patient-reported outcome measures Qual Life Res. 2018 May;27(5):1147-1157. doi: 10.1007/s11136-018-1798-3. Epub 2018 Feb 12. PubMed PMID: 29435801; PubMed Central PMCID: PMC5891568.
- Rossi LA, Frank RM, Wilke D, Provencher CMT, Millet PJ, Romeo A, Walch G, Lo I, Yamamoto N, Bokor D, Di Giacomo G, Tokish J, Lech O, Itoi E, Garrigues G, Scheibel M, Boileau P, Calvo E, Arce G, Toro F, Sugaya H, Ranalletta M, Parada S, Savoie F, Verma NN, Chahla J. Evaluation and Management of Glenohumeral Instability With Associated Bone Loss: An Expert Consensus Statement Using the Modified Delphi Technique. Arthroscopy. 2021 Jun;37(6):1719-1728. doi: 10.1016/j.arthro.2020.12.237. Epub 2021 Jan 13. Erratum in: Arthroscopy. 2025 Feb;41(2):532. doi: 10.1016/j.arthro.2024.07.008. PMID: 33453347.
- Sgroi M, Huzurudin H, Ludwig M, Dornacher D, Reichel H, Kappe T. With the exception of the Hill-Sachs interval, CT and MRI show no significant differences in the diagnostic value of the HSL measurement regardless of the measurement technique. Knee Surg Sports Traumatol Arthrosc. 2021 Dec;29(12):3981-3988. doi: 10.1007/s00167-021-06695-5. Epub 2021 Aug 16. PMID: 34398261.
- Sgroi M, Huzurudin H, Ludwig M, Zippelius T, Reichel H, Kappe T. MRI Allows Accurate Measurement of Glenoid Bone Loss. Clin Orthop Relat Res. 2022 Sep 1;480(9):1731-1742. doi: 10.1097/CORR.0000000000002215. Epub 2022 Apr 22. PMID: 35452020; PMCID: PMC9384911.
- Stecco A, Guenzi E, Cascone T, Fabbiano F, Fornara P, Oronzo P, Grassi FA, Cecchi G, Caniggia M, Brambilla M, Carriero A. MRI can assess glenoid bone loss after shoulder luxation: inter- and intra-individual comparison with CT. Radiol Med. 2013 Dec;118(8):1335-43. doi: 10.1007/s11547-013-0927-x. Epub 2013 May 27. PMID: 23716283.
- Stillwater L, Koenig J, Maycher B, Davidson M. 3D-MR vs. 3D-CT of the shoulder in patients with glenohumeral instability. Skeletal Radiol. 2017 Mar;46(3):325-331. doi: 10.1007/s00256-016-2559-4. Epub 2016 Dec 27. PMID: 28028575.
- Tian CY, Shang Y, Zheng ZZ. Glenoid bone lesions: comparison between 3D VIBE images in MR arthrography and nonarthrographic MSCT. J Magn Reson Imaging. 2012 Jul;36(1):231-6. doi: 10.1002/jmri.23622. Epub 2012 Feb 22. PMID: 22359387.
Summary of included studies
|
Study reference |
Study characteristics |
Patient characteristics |
Index test (test of interest) |
Measurement method |
Outcome measures and effect size |
Risk of bias * |
||||||||||||||||||||||||||||||||||||||
|
Studies from systematic review Liu 2024 |
||||||||||||||||||||||||||||||||||||||||||||
|
Lander 2022 |
Diagnostic study |
N=18
Mean /median age ± SD/range: 34 (not reported)
Sex: 67% M/ 33% F |
3D CT: 64-multidetector row CT and helical imaging
3D MRI (3T): Siemens Skyra (3 Tesla magnets) |
Best-fit circle (circle diameter): The glenoid height line (blue) runs from the supraglenoid tubercle to the medial aspect of the inferior base. Glenoid bone loss size (orange) and circle diameter (green) was quantified with the glenoid height line marking the center of the circle. Percentage glenoid bone loss was determined as [(glenoid bone loss size/circle diameter) *100%]. |
Extracted from individual study: Bland-Altman analysis
Glenoid track ([(0.83 * circle diameter) – glenoid bone loss size): After calculating the glenoid track for each imaging modality, we determined no difference between any of the 4 imaging modalities and, therefore, were identical (on vs. off) for each patient analysis |
QUADAS-C Patient selection: low Index test: low Reference standard: unclear Flow & Timing: high |
||||||||||||||||||||||||||||||||||||||
|
Lansdown 2019 |
Retrospective study
|
N=16
Mean /median age ± SD/range: 33.8±9.4
Sex: 69% M/ 31% F |
3D CT: Not reported.
3D MRI (1.5T): 1.5-T imager (MAGNETOM Espree; Siemens Healthcare, Erlangen, Germany)
|
Best-fit circle (PICO method): A: area of a perfect circle that was fit to the inferior two-thirds of the intact glenoid (healthy shoulder) |
Extracted from individual study:
For 88% of the measurements (42 of 48), a less than 2% difference between MR- and CT-based estimates was found.
|
QUADAS-C Patient selection: high Index test: low Reference standard: unclear Flow & Timing: high |
||||||||||||||||||||||||||||||||||||||
|
Vopat 2018 |
Case-control study |
N=8
Mean /median age ± SD/range: 44±19
Sex: 75% M/ 25% F |
3D CT: Ethier a GE 64- or 16-slice CT scanner; GE Healthcare, Waukesha, WI
3D MRI (3T): 3-Tesla scanner (Siemens Trio; Siemens Healthcare)
|
Best-fit circle (PICO method): A: surface area of the best-fit circle
|
GBL and glenoid SA
|
QUADAS-C Patient selection: low Index test: low Reference standard: unclear Flow & Timing: high |
||||||||||||||||||||||||||||||||||||||
|
Stillwater 2017 |
Prospective study |
N=10
Mean /median age ± SD/range: 29 (not reported)
Sex: % M/ % F |
3D CT: 64-multidetector row CT (VCT, GE Medical Systems)
3D MRI (3T): 3-T Siemens scanner (MAGNETOM Verio, Siemens Healthcare)
|
Best-fit circle (circle diameter): A: circle diameter of the best-fit circle |
|
QUADAS-C Patient selection: low Index test: low Reference standard: unclear Flow & Timing: high |
||||||||||||||||||||||||||||||||||||||
|
Individual studies |
||||||||||||||||||||||||||||||||||||||||||||
|
Tian 2012 |
Type of study: diagnostic study Setting and country: Department of Radiology, China Funding and conflicts of interest: not declared.
|
Inclusion criteria: This diagnostic test was performed on 56 patients (age range, 14–51 years; mean age, 26 years) referred to our department for shoulder MR arthrography. Patients with glenoid bone loss on nonarthrographic MSCT examination were included, including 35 with recurrent anterior dislocation and five with shoulder pain and motion limitation. Exclusion criteria: Patients with prior shoulder surgery were excluded.
N= 40/56 (diagnosed with GBL)
Mean age (range): 26 (14-51) for all 56 patients
Sex: 82% M /18% F for all 56 patients |
Describe index test: 3D MRI using a 3.0 Tesla MR (Magnetom Trio with TIM system, Siemens, Erlangen, Germany). Plus, an arthrography-specific imaging protocol using a commercially available fat-suppressed 3D VIBE sequence was performed Comparator test: nonar- thrographic MSCT, using a 16-row multidetector CT unit (Sensation 16, Siemens Medical Solutions). The time between MR arthrography and MSCT ranged from 0–27 days (mean, 5.55-6.36 days).
|
Best-fit circle (circle diameter) On a sagittal view, a circle is placed on the glenoid that best fits the 3- to 9-o’clock inferior contour. A line is drawn from the posterior side to the anterior side of the circle to determine the diameter (A); this represents an intact glenoid. A second straight line is drawn following the glenoid defect; this will enable measurement of the glenoid defect (B). The percentage of glenoid bone loss is calculated using the following expression: (B/A)* 100%. |
*paired t-test was used. |
|
||||||||||||||||||||||||||||||||||||||
|
Stecco 2013 |
Type of study: Cross-sectional study
Setting and country: not reported, Italy
Funding and conflicts of interest: none to declare.
|
Inclusion criteria: Twenty-three patients affected by post-traumatic, unidirectional anterior instability (22 males and 1 female; mean age, 34.7 years) were enrolled, underwent MRI and CT of their healthy and pathological shoulders on the same day.
Exclusion criteria: Not reported.
N=22/166
Mean age (range): 28.8 (15-60)
Sex: 91% M /9% F |
Describe index test: MRI: a 1.5 Tesla Philips Achieva (Philips Medical Systems, Best, The Netherlands) Comparator test: CT: a Light Speed VCT with 64 detec- tor rows (GE, Milwaukee, Wisconsin, USA). Patients underwent MRI and CT of their healthy and pathological shoulders on the same day.
|
Best-fit circle (Pico method) : The PICO method involves drawing a circular area (X) on an oblique sagittal en face image of the healthy shoulder using the lower glenoid margin as a base. This circle is then transposed to the image of the pathological shoulder and the area of the sector with missing bone is drawn and calculated (bone loss, Yi). Bone loss was measured three times by two operators in consensus (in order to reduce measurement error), and the mean value of the three measurements was recorded (Y), whereas X was only calculated once by the two operators in consensus. % bone loss=Area Y/area X *100%.
|
*using the MedCalc 12.2.0.1 statistical package.
Bland-Altman plot
|
|
||||||||||||||||||||||||||||||||||||||
|
Chalmers 2020 |
Type of study: Retrospective study
Setting and country: a single institution, Department for Orthopaedic Surgery, the USA
Funding and conflicts of interest: The authors report potential conflicts of interest or sources of funding, details please see the article.
|
Inclusion criteria: (1) patients who underwent the surgical treatment for glenohumeral instability as coded using the Common Procedure Terminology codes 29806, 23455, 23466, 23462, 23460, and 23465 at the University of Utah, and (2) who underwent both a CT and an MRI performed within 1 year of each other.
Exclusion criteria: Patients in whom an intervening surgical pro- cedure was performed on the shoulder.
N=53/55
Mean age ± SD: 31 ± 11
Sex: 49% M / 51% F |
Describe index test: MRI
Comparator test: CT
Both the CT and MRI images were downloaded in DICOM format (Digital Imaging and Communications in Medicine) and uploaded into a free- available viewing software (OsiriX; Pixmeo Sarl, Berne, Switzerland). The MRI and CT scans were obtained within 1 year of each other. The mean (sd) was 45±83 days between scans.
|
On the en face glenoid image, glenoid width at the center of the best fit circle was measured, glenoid defect width, as defined as the distance between the anterior glenoid rim and the best fit circle, and glenoid defect area, as defined as the area of anterior glenoid between the anterior glenoid rim and the best fit circle. From these measurements, linear percent glenoid bone loss was calculated as the width of the glenoid defect divided by the width of the best-fit circle multiplied by 100 and area percent glenoid bone loss as the area of the glenoid defect divided by the area of the best fit circle multiplied by 100. The area of the bone loss was outlined and autocalculated by the software used (OsiriX). |
Mean measurement
NOTE. Results are displayed as mean± standard deviation. Differences are displayed as mean [95% confidence intervals]. P-values were generated using paired Student t-tests.
On/Off track, n and % on-track: Observer 1: CT 15/53 (38.3%), MRI 22/53 (41.5%), agreement CT-MRI 40/53 (75%) Observer 2: CT 20/53 (37.7%), MRI 21/53 (39.6%), agreement CT-MRI 91% (48/53) |
|
||||||||||||||||||||||||||||||||||||||
|
Sgroi 2021 |
Type of study: Cross-sectional study
Setting and country: a single institution, Department for Orthopaedic Surgery, Germany
Funding and conflicts of interest: none declared. |
Inclusion criteria: Eighty consecutive patients with anterior shoulder instability scheduled from 2013 to 2017 in our department for arthroscopy were retrospectively enrolled postoperatively in this study: (1) arthroscopic or open shoulder stabilisation and (2) available CT and MRI scans of the afected shoulder.
Exclusion criteria: (1) concomitant rotator cuf tear, (2) incomplete imaging diagnostics, and (3) insuicient CT or MRI scans quality.
N=50/80
Prevalence: HSL: 100%
Mean age ± SD: 26.4 ± 11.8
Sex: 74% M / 26% F |
Describe index test: MRI: a 1.5-Tesla MRI scanner (Siemens Symphony, Germany)
Comparator test: For all patients CT: Siemens Somatom Emotion, ST: 1.0 mm, pitch: 0.8, 130 kV.
For all patients CT and MRI scans of the shoulders were performed as part of their preoperative diagnostic screening according to our routine clinical setup. Study-related radiological analysis of all patients was conducted postoperatively at 34.7 ± 11.4 months (range: 24.1–52.0 months). Two orthopaedic trainees re-analysed and re-evaluated preoperative CT and MRI scans.
|
The glenoid track method: First, the diameter (D) of the lower glenoid and the extent of glenoid bone loss (GBL) were measured using the best-it-circle method. Second, the glenoid track was extrapolated using the following formula: GT = (0.83 * D)-GBL. Finally, the Hill–Sachs interval (HSI) was deined as the sum of the width of the HSL and the extent of intact bone between the rotator cuf insertion and the lateral rim of the HSL. The HSL was deined as of-track if the HSI was greater than the glenoid track (HSI > GT); otherwise, it was defined as on-track. |
Measurements of the glenoid track (mean)
n. s. not signiicant; none of the measurement results was normally distributed. The Wilcoxon signed-rank test was used to compare the interval-scaled measurements; Yates’s Chi- square test was used for nominal-scaled variables. Signiicant correlations are marked in bold Signiicance level = < 0.05
N off-track lesions: CT: 33.3% 17.1 % (p= n.s.) |
|
||||||||||||||||||||||||||||||||||||||
|
Sgroi 2022 |
Type of study: retrospective diagnostic study Setting and country: a single institution, Department of Orthopaedic Surgery, Germany
Funding and conflicts of interest: none declared. |
Inclusion criteria: patients with available preoperative AP radiographs, WP radiographs, CT, and MR images of the af- fected shoulder as potentially eligible.
Exclusion criteria: 31% (25 of 80) were excluded because not all planes or layers (such as sagittal, axial, or frontal) of each diagnostic imaging modalities were available and 6% (5 of 80) because of the insufficient quality of diagnostic images (for example, setting of the layers did not allow adequate en face view of the glenoid).
N=50/80
Mean age ± SD: 26 ±12
Sex: 74% M / 26% F |
Describe index test: MRI: a Philips 3-T MRI scanner (Amsterdam, The Netherlands) and an 8- channel phased-array coil.
Comparator test: CT: a Siemens Dual Source CT scanner (Erlangen, Germany).
All measurements were performed during the same period.
|
depth and length of a glenoid bone loss: A best-fit circle is placed on the lower two-thirds of the glenoid. A line connecting the anteroinferior and anterosuperior rim of the glenoid bone loss was used to measure the length of the bony defect (blue line). To measure the depth of the glenoid bone loss, a second line (red line) perpendicular to the first line was drawn between the deepest point of the glenoid bone loss and the best-fit circle The best- fit circle width loss method: A best-fit circle was drawn on the inferior part of the glenoid on an en face view of the glenoid. The diameter (blue line) of the best-fit circle was measured. Using a parallel line to the diameter of the best fit circle, the width (red line) of the glenoid bone loss was measured. AP distance method: The bare spot was identified and a best-fit circle with the bare spot as the center was drawn over the inferior glenoid. The distance A from the bare- spot area to the anterior rim of the glenoid was measured. In the same manner, the distance between the bare spot and posterior rim of the glenoid was determined. The amount of glenoidal bone loss was then calculated using the following formula: A/B x100. Surface area measurement: A best-fit circle is placed on the lower two-thirds of the glenoid, starting at the 3 o’clock position (yellow circle). The area of the best-fit circle was calculated digitally. The bony fragment (white line) was identified and delineated. The surface area of the bony fragment was determined digitally. The glenoid bone loss was finally calculated by determining the ratio between the two areas. Gerber X ratio method: Using an en face view of the glenoid, a best-fit circle was drawn over the lower part of the glenoid, and its diameter (red line) was measured. Then, the length of the glenoid bone loss was measured using a line (blue line) connecting the anterocranial and anterocaudal edges of the glenoid bone loss. |
Data presented as the median (range); the results of each measurement were not normally distributed; the Wilcoxon signed-rank test was used to compare the interval scaled measurements; ordinal scaled variables were tested with the sign test.
|
|
||||||||||||||||||||||||||||||||||||||
|
Cui 2023 |
Type of study: Cross-sectional study Setting and country: a single institution, Department of Radiology and department of Orthopaedics, China
Funding and conflicts of interest: none declared. |
Inclusion criteria: Patients with shoulder disloca- tion between July 2022 and June 2023 were identified retrospectively. The inclusion criteria were (1) age of 18 years or older, (2) shoulder anterior dislocation, (3) completion of both MRI and CT of the shoulder joint, and (4) interval between MRI and CT was 1 week or less. Both patients with primary dislocation and patients with recurrent dislocation were included.
Exclusion criteria: Patients with a history of shoulder osseous surgery.
N=16/56
Mean age ± SD: 27.5 ±9.5 of all 56 patients
Sex: 70% M / 30% F of all 56 patients
|
Describe index test: MRI: a Philips 3-T MRI scanner (Amsterdam, The Netherlands) and an 8- channel phased-array coil.
Comparator test: CT: a Siemens Dual Source CT scanner (Erlangen, Germany).
|
Genood defect: A circle was placed on the inferior two-thirds portion of the glenoid with the posterior and inferior margins as guides, ensuring that the center of the circle was on the glenoid height line. Then, the radius (R) of the best-fit circle was obtained directly. The glenoid width was determined as the diameter (D) of the best-fit circle (D 1⁄4 2R). A line segment (W) perpendicular to the glenoid height line was drawn from the center of the best-fit circle to the anterior edge of the remaining glenoid. Glenoid defect (d) was then calculated as d=R-W. The percentage of glenoid defect was determined as follows: (Glenoid defect/Glenoid width) *100%. The GT was calculated using the glenoid diameter (D) and gle- noid defect (d) measured on the en face view (GT=0.83D -d). |
Mean measurement
*paired t test was used.
Bland-Altman plots
|
|
||||||||||||||||||||||||||||||||||||||
|
Feuerriegel 2023 |
Type of study: Cross-sectional study
Setting and country: Single institution, emergency department, Germany
Funding and conflicts of interest: K.W. is employed by Philips GmbH Market DACH but was not involved in data acquisition or analysis.
|
Inclusion criteria: Patients admitted to the emergency department with suspected traumatic dislocation of the shoulder. All participants underwent 3-T MRI of the shoulder within 2 days after trauma, and in patients with fractures a CT examination was commenced as part of the diagnostic workup in clinical routine.
Exclusion criteria: Not reported.
N=20/46
Mean age ± SD: 40±14.5
Sex: 59% M / 41% F |
Describe index test: MRI: a 3-T MR scanner (Ingenia Elition X; Philips Healthcare) with a dedicated 16-channel shoulder coil (dStream shoulder 16ch coil, Philips Healthcare). UTE images were acquired in the sag- ittal plane. Due to the isotropic acquisition voxel size, the T1 GRE and FRACTURE sequences were acquired in axial orientation und reformatted in the sagittal and coronal plane as well as inverted to resemble a bright CT-like bone contrast.
Comparator test: CT: either an IQon Spectral CT scanner (Philips Healthcare) or a Siemens Somatom go.Top scanner (Sie- mens Healthineers).
The interval between MRI and CT unclear, but seemed both in clinial routine.
|
Glenoid bone loss (%): A circle was drawn using the anterior, posterior, and inferior margin of the glenoid surface as outer boundary and the percentage of bone loss was calculated by dividing the width of the anterior bone loss with the diameter of the circle; Glenoid track (mm): The glenoid track is calculated as 0.83 D − d, in which D repre- sents the diameter of the intact glenoid in millimeters and the d corresponds to the amount of glenoid bone loss in millimeters
|
Mean measurement
The comparison between CT and MRI using Student’s t-test were all not significant.
Agreement examined using an Bland-Altman plot showed 95% limits of agreement for CT versus T1 GRE MRI (95%LoA: -1.8% to 1.4%), CT versus Fracture (95%LoA: -2.1% to 1.6%), and CT versus UTE MRI (95%LoA: -1.9% to 1.9%). Pearson’s Correlation regarding percentage of glenoid bone loss
On/off track: All-in agreement; n=6 offtrack and n=14 on-track Kappa = 1.00 |
|
||||||||||||||||||||||||||||||||||||||
|
Kumar 2023
|
Type of study: Prospective
Setting and country: hospital
Funding and conflicts of interest: not reported in the manuscript
|
Inclusion criteria: History of shoulder dislocation
Exclusion criteria: Contraindications for MRI
N=38
Mean age ± SD: 28.92 (7.79.
Sex: 100% male
Cause of dislocation: Sports 5.6% |
Describe index test: 3D MRI
Comparator test: 3D CT |
|
Kumar (2023) did not find statistical significant difference of 3D CT and 3D MRI measurements (CT: 16.53% [SD: 11.47], MRI: 61.03% [SD: 11.06]).
The intraclass correlation coefficient between 3D CT and 3D MRI was 0.998.
|
|
||||||||||||||||||||||||||||||||||||||
COSMIN risk of bias assessment of included studies
List of excluded studies
|
Reference |
Reason for exclusion |
|
Lee 2013 |
Wrong outcome |
|
E Souza 2014 |
Wrong intervention |
|
Markenstein 2014 |
Wrong outcome |
|
Gyftopoulos 2015 |
Wrong intervention |
|
Acid 2012 |
Wrong population |
|
Aliprandi 2006 |
Wrong population |
|
Aygün 2017 |
Wrong population |
|
Bencardino 2013 |
Wrong study design |
|
Bishop 2013 |
Wrong population |
|
Bitzer 2004 |
Article in German |
|
Cagle 2019 |
Wrong outcome |
|
Crossan 2023 |
Wrong study design |
|
Cusmano 2000 |
Article in Italian |
|
Dickens 2019 |
No intervention |
|
Dobson 2009 |
No intervention |
|
Elkharbotly 2016 |
Wrong population |
|
Foster 2023 |
Wrong intervention |
|
Galvin 2016 |
Wrong intervention |
|
Gómez Bermúdez 2022 |
Article in Spain |
|
Gyftopoulos 2012 |
Wrong population |
|
Gyftopoulos 2013 |
Wrong population |
|
Gyftopoulos 2014 |
Wrong intervention |
|
Huijsmans 2007 |
Wrong population |
|
Jezycki 2024 |
Article in German |
|
Khan 2023 |
Wrong population |
|
Khedr 2013 |
Wrong population |
|
Koh 2018 |
No intervention |
|
Vopat 2020 |
Wrong outcome |
|
Madhuchandra 2022 |
Wrong outcome |
|
Mahmoud 2013 |
Wrong population |
|
Moroder 2013 |
Wrong population |
|
Oh 2010 |
Wrong population |
|
Owens 2014 |
Wrong population |
|
Parmar 2002 |
Wrong population |
|
Rossi 2021 |
Wrong study design |
|
Rutgers 2022 |
Wrong population |
|
Thacher 2023 |
Wrong study design |
|
Vopat 2021 |
Wrong intervention |
|
Weel 2016 |
Wrong study design |
|
Weil 2022 |
Wrong study design |
|
Wu 2022 |
Wrong population |
|
Yanke 2017 |
Wrong population |
|
DGMSR 2023 |
Wrong study design |
|
Breighner 2018 |
Wrong outcome |
|
Ma 2018 |
Included in the Systematic review Liu 2024 |
|
de Mello 2020 |
Wrong outcome |
|
Vopat 2018 |
Included in the Systematic review Liu 2024 |
|
Lansdown 2019 |
Included in the Systematic review Liu 2024 |
|
Rerko 2013 |
Wrong outcome |
|
Makovicka 2023 |
Wrong outcome |
|
Min 2023 |
Wrong outcome |
|
Friedman 2014 |
Wrong outcome |
|
Saliken 2015 |
Wrong intervention (Review) |
|
Miao 2019 |
Wrong intervention (Review) |
|
Walter 2019 |
Wrong intervention (Review) |
|
Kumar 2023 |
Wrong outcome |
|
Zappia 2023 |
Wrong outcome |
|
Verweij 2020 |
Not the latest review (Review) |
|
Kim 2023 |
Wrong outcome |
|
Weber 2021 |
Wrong outcome |
|
Lander 2022 |
Included in the Systematic review Liu 2024 |
Beoordelingsdatum en geldigheid
Publicatiedatum : 17-02-2026
Beoordeeld op geldigheid : 17-02-2026
Algemene gegevens
De ontwikkeling/herziening van deze richtlijnmodule werd ondersteund door het Kennisinstituut van de Federatie Medisch Specialisten (www.demedischspecialist.nl/kennisinstituut) en werd gefinancierd door de Stichting Kwaliteitsgelden Medisch Specialisten (SKMS). De financier heeft geen enkele invloed gehad op de inhoud van de richtlijnmodule.
Samenstelling werkgroep
Voor het ontwikkelen van de richtlijnmodules is in 2022 een multidisciplinaire werkgroep ingesteld, bestaande uit vertegenwoordigers van alle relevante specialismen (zie hiervoor de Samenstelling van de werkgroep) die betrokken zijn bij de zorg voor patiënten met schouderinstabiliteit.
Werkgroep richtlijn schouderinstabiliteit
- Prof. Dr. M.P.J (Michel) Bekerom, orthopedisch chirurg OLVG en MC Jan van Gooijen, NOV – voorzitter richtlijnwerkgroep
- Dr. J.J.A.M. (Jos) van Raaij, orthopedisch chirurg, niet praktiserend, NOV
- Dr. O.A.J. (Olivier) van der Meijden, orthopedisch chirurg Albert Schweitzer Ziekenhuis, NOV
- Dr. A.R. (Alex) Poublon, orthopedisch chirurg Ziekenhuis Gelderse Vallei, NOV
- Dr. T.D.W. (Tjarco) Alta, orthopedisch chirurg Spaarne Gasthuis, NOV
- Dr. R.J. (Robert Jan) Derksen, traumachirurg, Zaans Medisch Centrum, NVvH
- MSc. F. (Femke) Boon, fysio-, manueel therapeut, extended scope specialist Schoudercentrum IBC, KNGF
- MSc. K.M.C. (Karin) Hekman, fysio-, manueel therapeut, extended scope specialist, Schoudercentrum IBC, KNGF
- Dr. I.D. (Iris) Kilsdonk, radioloog Deventer Ziekenhuis, NVvR
- Dr. H.J. (Henk-Jan) van der Woude, radioloog OLVG, NVvR
- Drs. H.K. (Rik) van der Kolk, sportarts OLVG, VSG
- Mevr. drs. G. (Gerardine) Willemsen-de Mey, patiëntvertegenwoordiger Nationale Vereniging ReumaZorg Nederland
Met ondersteuning van
- Dr. J. (Jacqueline) Jennen, adviseur Kennisinstituut van de Federatie Medisch Specialisten (tot december 2023)
- Dr. F. (Floor) Willeboordse, senior adviseur Kennisinstituut van de Federatie Medisch Speciaisten (tot januari 2025)
- Dr. M.S. (Matthijs) Ruiter, senior adviseur, Kennisinstituut van de Federatie Medisch Specialisten (vanaf januari 2025)
- MSc. D.G. (Dian) Ossendrijver, adviseur kennisinstituut van de Federatie Medisch Specialisten (vanaf december 2023)
- Dr. M. (Michiel) Oerbekke, adviseur Kennisinstituut van de Federatie Medisch Specialisten
- Dr. J. (Jing) de Haan-Du, adviseur Kennisinstituut van de Federatie Medisch Specialisten
- E. (Esther) van Bijl, medisch informatiespecialist, kennisinstituut van de Federatie Medisch Specialisten
Belangenverklaringen
Een overzicht van de belangen van werkgroepleden en het oordeel over het omgaan met eventuele belangen vindt u in onderstaande tabel. De ondertekende belangenverklaringen zijn op te vragen bij het secretariaat van het Kennisinstituut van de Federatie Medisch Specialisten via secretariaat@kennisinstituut.nl.
Gemelde (neven)functies en belangen werkgroep
|
Naam |
Hoofdfunctie |
Neven werkzaamheden |
Persoonlijke financiële belangen |
Persoonlijke relaties |
Extern gefinancierd onderzoek |
Intellectuele belangen en reputatie |
Overige belangen |
Datum |
Restrictie |
|
Michel van den Bekerom (voorzitter) |
Orthopedisch chirurg, OLVG, Amsterdam |
Betaald onderwijs geven bij/voor: |
Geen |
Geen |
Onderzoek gesteund door: SECEC (European Society for surgery of the shoulder an the elbow), ZonMW, SNN (Smith and Nephew). Het OLVG ontvangt financiële support voor een shoulder and elbow clinical and research fellowship van van Smith en Nephew. Dit fellowship wordt mede (financieel) ondersteund door een firma die materiaal maakt dat gebruikt wordt voor schouderstabilisaties. Het betreft een overeenkomst tussen het OLVG en de firma vanwege educatieve doeleinden. |
Geen |
Het OLVG is voornemens om een consultancy contract met zimmer/biomet op te stellen zodat ik op vraag elders kan opereren. |
19-10-2022 |
Geen restricties
|
|
Jos van Raaij |
Orthopedisch chirurg, Martini ziekenhuis Groningen |
Geen |
Geen |
Geen |
Geen |
Geen |
Geen |
11-07-2022 |
Geen restricties |
|
Olivier van der Meijden |
Orthopedisch chirurg |
Geen |
Geen |
Geen |
Geen |
Geen |
Geen |
28-09-2023 |
Geen restricties |
|
Alexander Poublon |
Orthopedisch chirurg met aandachtsgebied schouder |
Geen |
Geen |
Geen |
Geen |
Geen |
Geen |
06-10-2023 |
Geen restricties |
|
Tjarco Alta |
Orthopedisch Chirurg |
Geen |
Geen |
Geen |
Geen |
Geen |
Geen |
28-09-2023 |
Geen restricties |
|
Karin Hekman |
Fysiotherapeut bij Schoudercentrum IBC |
Voorzitter Schoudernetwerk Nederland; onkostenvergoeding |
Ik behandel patiënten die schouderinstabiliteit hebben binnen het schoudercentrum en binnen MC Jan van Goyen, dit is de reden voor het plaatsnemen in deze expertise groep. |
Geen |
Geen |
Het enige voordeel dat deelname aan deze richtlijn oplevert is nog meer persoonlijke expertise wat mogelijk leidt tot een verdieping van de fysiotherapeutische toepassingen bij schouderinstabiliteit. Dit is voor het SchouderNetwerk Nederland van primair belang en kan leiden tot uitdragen van kennis naar de regionale netwerken. Als voorzitter van deze stichting voel ik mij hier verantwoordelijk voor. |
Geen |
09-10-2023 |
Geen restricties |
|
Femke Boon |
Fysio- manueel therapeut en Extended Scope specialist bij Schoudercentrum IBC locatie Amstelland |
- 2x/ maand elleboog-schouder orthopedie poli bij Medisch Centrum Jan van Goyen (betaald, gedetacheerd vanuit IBC) |
Werkzaam bij Schoudercentrum IBC Amstelland |
Geen |
Richtlijn ontwikkeling FMS primaire anterieure schouderluxaties |
Geen |
Geen |
4-10-2023 |
Geen restricties |
|
Iris Kilsdonk |
Deventer Ziekenhuis |
Bestuurslid NVvR, sectie muskuloskeletale radiologie |
Geen |
Geen |
Geen |
Geen |
Geen |
2-10-2023 |
Geen restricties |
|
Robert Jan Derksen |
Traumachirurg Zaans Medisch Centrum |
Bestuurslid NVT |
Geen |
Geen |
Geen |
Geen |
Geen |
28-08-2022 |
Geen restricties |
|
Rik van der Kolk |
Sportarts, OLVG |
Geen |
Geen |
Geen |
Geen |
Geen |
Geen |
10-08-2022 |
Geen restricties |
|
Henk-Jan van der Woude |
Radioloog Onze Lieve Vrouwe Gasthuis Amsterdam |
Consulent Commissie voor Beentumoren, onbezoldigd |
Geen |
Geen |
Geen |
Geen |
Geen |
07-02-2023 |
Geen restricties |
Inbreng patiëntenperspectief
De werkgroep besteedde aandacht aan het patiëntenperspectief door het uitnodigen van de Patiëntenfederatie Nederland en de Nationale Vereniging ReumaZorg Nederland voor de knelpunteninventarisatie. Daarnaast nam een patiëntvertegenwoordiger van ReumaZorg Nederland deel aan de werkgroep. De verkregen input is meegenomen bij het opstellen van de uitgangsvragen, de keuze voor de uitkomstmaten en bij het opstellen van de overwegingen. De conceptrichtlijn is tevens voor commentaar voorgelegd aan Patiëntenfederatie Nederland en ReumaZorg Nederland en de eventueel aangeleverde commentaren zijn bekeken en verwerkt
Kwalitatieve raming van mogelijke financiële gevolgen in het kader van de Wkkgz
Bij de richtlijnmodule voerde de werkgroep conform de Wet kwaliteit, klachten en geschillen zorg (Wkkgz) een kwalitatieve raming uit om te beoordelen of de aanbevelingen mogelijk leiden tot substantiële financiële gevolgen. Bij het uitvoeren van deze beoordeling is de richtlijnmodule op verschillende domeinen getoetst (zie het stroomschema bij Werkwijze).
|
Module |
Uitkomst raming |
Toelichting |
|
Meetmethoden Glenoïdaal botverlies |
Geen financiële gevolgen |
Uit de toetsing volgt dat de aanbeveling(en) niet breed toepasbaar zijn (<5.000 patiënten) en zal daarom naar verwachting geen substantiële financiële gevolgen hebben voor de collectieve uitgaven.
|
Werkwijze
Voor meer details over de gebruikte richtlijnmethodologie verwijzen wij u naar de Werkwijze. Relevante informatie voor de ontwikkeling van deze richtlijn is hieronder weergegeven.
Zoekverantwoording
Algemene informatie
|
Cluster/richtlijn: Schouderinstabiliteit - Module 2 Posttraumatische schouderinstabiliteit |
|
|
Uitgangsvraag/modules: Welk (aanvullend?) beeldvormend onderzoek moet worden verricht bij post traumatische schouderinstabiliteit? |
|
|
Database(s): Embase.com, Ovid/Medline |
Datum: 6-2-2024 |
|
Periode: vanaf 2000 |
Talen: geen restrictie |
|
Literatuurspecialist: Esther van der Bijl |
Rayyan review: https://rayyan.ai/reviews/922035 |
|
BMI-zoekblokken: voor verschillende opdrachten wordt (deels) gebruik gemaakt van de zoekblokken van BMI-Online https://blocks.bmi-online.nl/ Bij gebruikmaking van een volledig zoekblok zal naar de betreffende link op de website worden verwezen. |
|
|
Toelichting: Voor deze vraag is gezocht op de elementen Schouderinstabiliteit en MRI.
→ De sleutelartikelen PMID 22996361, PMID 18061117 en PMID 35452020 worden gevonden met deze search.
Zoals besproken is er gezocht met de P, I en het diagnostisch filter. In overleg zijn bij de P ook de zoektermen ‘glenoid bone loss’ en ‘glenoid defect’ meegenomen, omdat anders relevante artikelen gemist worden. |
|
|
Te gebruiken voor richtlijntekst: In de databases Embase.com en Ovid/Medline is op 6 februari 2024 systematisch gezocht naar systematische reviews, RCTs en observationele studies over de diagnostische accuratesse van MRI bij patiënten met verdenking op posttraumatische schouderinstabiliteit (ossale component). De literatuurzoekactie leverde 960 unieke treffers op. |
|
Zoekopbrengst - 6 februari 2024
|
|
EMBASE |
OVID/MEDLINE |
Ontdubbeld |
|
SR |
80 |
11 |
83 |
|
RCT |
199 |
30 |
210 |
|
Observationeel |
633 |
206 |
667 |
|
Totaal |
912 |
247 |
960* |
*in Rayyan
Zoekstrategie - 6 februari 2024
Embase.com
|
No. |
Query |
Results |
|
#1 |
'shoulder dislocation'/exp OR 'recurrent shoulder dislocation'/exp OR 'bankart lesion'/exp OR ((('shoulder*' OR 'gleno-humer*' OR 'glenoid*' OR 'humer*' OR 'scapulohumer*' OR 'glenohumer*') NEAR/3 ('dislocat*' OR 'diastasis' OR 'instabil*' OR 'luxat*' OR 'subluxat*' OR 'defect*')):ti,ab,kw) OR (('shoulder*':ti,ab,kw OR glenoid*:ti,ab,kw OR 'gleno-humer*':ti,ab,kw OR 'humer*':ti,ab,kw OR 'scapulohumer*':ti,ab,kw OR 'glenohumer*':ti,ab,kw) AND (('bon*' NEAR/3 ('loss*' OR 'erosion*')):ti,ab,kw)) OR ((('bankart' OR 'hill-sachs') NEAR/3 ('fracture*' OR 'lesion*' OR 'tear*')):ti,ab,kw) OR ((('on track' OR 'off track') NEAR/3 ('hill sachs' OR 'bone loss*' OR 'shoulder*' OR 'lesion*')):ti,ab,kw) |
17298 |
|
#2 |
'nuclear magnetic resonance imaging'/exp OR 'mri scanner'/exp OR ('magnetic resonance':ab,ti AND (image:ab,ti OR images:ab,ti OR imaging:ab,ti)) OR mri:ab,ti OR mris:ab,ti OR nmr:ab,ti OR mra:ab,ti OR mras:ab,ti OR zeugmatograph*:ab,ti OR 'mr tomography':ab,ti OR 'mr tomographies':ab,ti OR 'mr tomographic':ab,ti OR 'mr imag*':ti,ab,kw OR 'proton spin':ab,ti OR ((magneti*:ab,ti OR 'chemical shift':ab,ti) AND imaging:ab,ti) OR fmri:ab,ti OR fmris:ab,ti OR rsfmri:ti,ab,kw |
1604297 |
|
#3 |
'diagnostic procedure'/exp OR 'sensitivity and specificity'/de OR sensitivity:ab,ti OR specificity:ab,ti OR predict*:ab,ti OR 'roc curve':ab,ti OR 'receiver operator':ab,ti OR 'receiver operators':ab,ti OR likelihood:ab,ti OR 'diagnostic error'/exp OR 'diagnostic accuracy'/exp OR 'diagnostic test accuracy study'/exp OR 'inter observer':ab,ti OR 'intra observer':ab,ti OR interobserver:ab,ti OR intraobserver:ab,ti OR validity:ab,ti OR kappa:ab,ti OR reliability:ab,ti OR reproducibility:ab,ti OR ((test NEAR/2 're-test'):ab,ti) OR ((test NEAR/2 'retest'):ab,ti) OR 'reproducibility'/exp OR accuracy:ab,ti OR 'differential diagnosis'/exp OR 'validation study'/de OR 'measurement precision'/exp OR 'diagnostic value'/exp OR 'reliability'/exp OR 'predictive value'/exp OR ppv:ti,ab,kw OR npv:ti,ab,kw OR (((false OR true) NEAR/3 (negative OR positive)):ti,ab) OR diagnos*:ti,ab |
24669709 |
|
#4 |
#1 AND #2 AND #3 |
2429 |
|
#5 |
#4 AND [2000-2024]/py NOT ('conference abstract'/it OR 'editorial'/it OR 'letter'/it OR 'note'/it) NOT (('animal'/exp OR 'animal experiment'/exp OR 'animal model'/exp OR 'nonhuman'/exp) NOT 'human'/exp) |
1863 |
|
#6 |
'meta analysis'/exp OR 'meta analysis (topic)'/exp OR metaanaly*:ti,ab OR 'meta analy*':ti,ab OR metanaly*:ti,ab OR 'systematic review'/de OR 'cochrane database of systematic reviews'/jt OR prisma:ti,ab OR prospero:ti,ab OR (((systemati* OR scoping OR umbrella OR 'structured literature') NEAR/3 (review* OR overview*)):ti,ab) OR ((systemic* NEAR/1 review*):ti,ab) OR (((systemati* OR literature OR database* OR 'data base*') NEAR/10 search*):ti,ab) OR (((structured OR comprehensive* OR systemic*) NEAR/3 search*):ti,ab) OR (((literature NEAR/3 review*):ti,ab) AND (search*:ti,ab OR database*:ti,ab OR 'data base*':ti,ab)) OR (('data extraction':ti,ab OR 'data source*':ti,ab) AND 'study selection':ti,ab) OR ('search strategy':ti,ab AND 'selection criteria':ti,ab) OR ('data source*':ti,ab AND 'data synthesis':ti,ab) OR medline:ab OR pubmed:ab OR embase:ab OR cochrane:ab OR (((critical OR rapid) NEAR/2 (review* OR overview* OR synthes*)):ti) OR ((((critical* OR rapid*) NEAR/3 (review* OR overview* OR synthes*)):ab) AND (search*:ab OR database*:ab OR 'data base*':ab)) OR metasynthes*:ti,ab OR 'meta synthes*':ti,ab |
999431 |
|
#7 |
'clinical trial'/exp OR 'randomization'/exp OR 'single blind procedure'/exp OR 'double blind procedure'/exp OR 'crossover procedure'/exp OR 'placebo'/exp OR 'prospective study'/exp OR rct:ab,ti OR random*:ab,ti OR 'single blind':ab,ti OR 'randomised controlled trial':ab,ti OR 'randomized controlled trial'/exp OR placebo*:ab,ti |
3963976 |
|
#8 |
'major clinical study'/de OR 'clinical study'/de OR 'case control study'/de OR 'family study'/de OR 'longitudinal study'/de OR 'retrospective study'/de OR 'prospective study'/de OR 'comparative study'/de OR 'cohort analysis'/de OR ((cohort NEAR/1 (study OR studies)):ab,ti) OR (('case control' NEAR/1 (study OR studies)):ab,ti) OR (('follow up' NEAR/1 (study OR studies)):ab,ti) OR (observational NEAR/1 (study OR studies)) OR ((epidemiologic NEAR/1 (study OR studies)):ab,ti) OR (('cross sectional' NEAR/1 (study OR studies)):ab,ti) |
8055848 |
|
#9 |
'case control study'/de OR 'comparative study'/exp OR 'control group'/de OR 'controlled study'/de OR 'controlled clinical trial'/de OR 'crossover procedure'/de OR 'double blind procedure'/de OR 'phase 2 clinical trial'/de OR 'phase 3 clinical trial'/de OR 'phase 4 clinical trial'/de OR 'pretest posttest design'/de OR 'pretest posttest control group design'/de OR 'quasi experimental study'/de OR 'single blind procedure'/de OR 'triple blind procedure'/de OR (((control OR controlled) NEAR/6 trial):ti,ab,kw) OR (((control OR controlled) NEAR/6 (study OR studies)):ti,ab,kw) OR (((control OR controlled) NEAR/1 active):ti,ab,kw) OR 'open label*':ti,ab,kw OR (((double OR two OR three OR multi OR trial) NEAR/1 (arm OR arms)):ti,ab,kw) OR ((allocat* NEAR/10 (arm OR arms)):ti,ab,kw) OR placebo*:ti,ab,kw OR 'sham-control*':ti,ab,kw OR (((single OR double OR triple OR assessor) NEAR/1 (blind* OR masked)):ti,ab,kw) OR nonrandom*:ti,ab,kw OR 'non-random*':ti,ab,kw OR 'quasi-experiment*':ti,ab,kw OR crossover:ti,ab,kw OR 'cross over':ti,ab,kw OR 'parallel group*':ti,ab,kw OR 'factorial trial':ti,ab,kw OR ((phase NEAR/5 (study OR trial)):ti,ab,kw) OR ((case* NEAR/6 (matched OR control*)):ti,ab,kw) OR ((match* NEAR/6 (pair OR pairs OR cohort* OR control* OR group* OR healthy OR age OR sex OR gender OR patient* OR subject* OR participant*)):ti,ab,kw) OR ((propensity NEAR/6 (scor* OR match*)):ti,ab,kw) OR versus:ti OR vs:ti OR compar*:ti OR ((compar* NEAR/1 study):ti,ab,kw) OR (('major clinical study'/de OR 'clinical study'/de OR 'cohort analysis'/de OR 'observational study'/de OR 'cross-sectional study'/de OR 'multicenter study'/de OR 'correlational study'/de OR 'follow up'/de OR cohort*:ti,ab,kw OR 'follow up':ti,ab,kw OR followup:ti,ab,kw OR longitudinal*:ti,ab,kw OR prospective*:ti,ab,kw OR retrospective*:ti,ab,kw OR observational*:ti,ab,kw OR 'cross sectional*':ti,ab,kw OR cross?ectional*:ti,ab,kw OR multicent*:ti,ab,kw OR 'multi-cent*':ti,ab,kw OR consecutive*:ti,ab,kw) AND (group:ti,ab,kw OR groups:ti,ab,kw OR subgroup*:ti,ab,kw OR versus:ti,ab,kw OR vs:ti,ab,kw OR compar*:ti,ab,kw OR 'odds ratio*':ab OR 'relative odds':ab OR 'risk ratio*':ab OR 'relative risk*':ab OR 'rate ratio':ab OR aor:ab OR arr:ab OR rrr:ab OR ((('or' OR 'rr') NEAR/6 ci):ab))) |
14796927 |
|
#10 |
#5 AND #6 – SR’s |
80 |
|
#11 |
#5 AND #7 NOT #10 – RCT’s |
199 |
|
#12 |
#5 AND (#8 OR #9) NOT (#10 OR #11) – Observationele studies |
633 |
|
#13 |
#10 OR #11 OR #12 |
912 |
Ovid/Medline
|
# |
Searches |
Results |
|
1 |
exp Shoulder Dislocation/ or exp Bankart Lesions/ or ((shoulder* or gleno-humer* or glenoid* or humer* or scapulohumer* or glenohumer*) adj3 (dislocat* or diastasis or instabil* or luxat* or subluxat* or defect*)).ti,ab,kf. or ((shoulder* or glenoid* or gleno-humer* or humer* or scapulohumer* or glenohumer*) and (bon* adj3 (loss* or erosion*))).ti,ab,kf. or ((bankart or hill-sachs) adj3 (fracture* or lesion* or tear*)).ti,ab,kf. or ((on track or off track) adj3 (hill sachs or bone loss* or shoulder* or lesion*)).ti,ab,kf. |
13706 |
|
2 |
exp magnetic resonance imaging/ or ("magnetic resonance" and (image or images or imaging)).ti,ab,kf. or mri.ti,ab,kf. or mris.ti,ab,kf. or nmr.ti,ab,kf. or mra.ti,ab,kf. or mras.ti,ab,kf. or zeugmatograph*.ti,ab,kf. or "mr tomography".ti,ab,kf. or "mr tomographies".ti,ab,kf. or "mr tomographic".ti,ab,kf. or 'mr imag*'.ti,ab,kf. or "proton spin".ti,ab,kf. or ((magneti* or "chemical shift") and imaging).ti,ab,kf. or fmri.ti,ab,kf. or fmris.ti,ab,kf. or rsfmri.ti,ab,kf. |
981588 |
|
3 |
exp "Sensitivity and Specificity"/ or (sensitivity or specificity).ti,ab. or (predict* or ROC-curve or receiver-operator*).ti,ab. or (likelihood or LR*).ti,ab. or exp Diagnostic Errors/ or (inter-observer or intra-observer or interobserver or intraobserver or validity or kappa or reliability).ti,ab. or reproducibility.ti,ab. or (test adj2 (re-test or retest)).ti,ab. or "Reproducibility of Results"/ or accuracy.ti,ab. or Diagnosis, Differential/ or Validation Study/ or ((false or true) adj3 (negative or positive)).ti,ab. |
5006646 |
|
4 |
1 and 2 and 3 |
408 |
|
5 |
limit 4 to yr="2000 -Current" |
349 |
|
6 |
5 not (comment/ or editorial/ or letter/) not ((exp animals/ or exp models, animal/) not humans/) |
343 |
|
7 |
meta-analysis/ or meta-analysis as topic/ or (metaanaly* or meta-analy* or metanaly*).ti,ab,kf. or systematic review/ or cochrane.jw. or (prisma or prospero).ti,ab,kf. or ((systemati* or scoping or umbrella or "structured literature") adj3 (review* or overview*)).ti,ab,kf. or (systemic* adj1 review*).ti,ab,kf. or ((systemati* or literature or database* or data-base*) adj10 search*).ti,ab,kf. or ((structured or comprehensive* or systemic*) adj3 search*).ti,ab,kf. or ((literature adj3 review*) and (search* or database* or data-base*)).ti,ab,kf. or (("data extraction" or "data source*") and "study selection").ti,ab,kf. or ("search strategy" and "selection criteria").ti,ab,kf. or ("data source*" and "data synthesis").ti,ab,kf. or (medline or pubmed or embase or cochrane).ab. or ((critical or rapid) adj2 (review* or overview* or synthes*)).ti. or (((critical* or rapid*) adj3 (review* or overview* or synthes*)) and (search* or database* or data-base*)).ab. or (metasynthes* or meta-synthes*).ti,ab,kf. |
724616 |
|
8 |
exp clinical trial/ or randomized controlled trial/ or exp clinical trials as topic/ or randomized controlled trials as topic/ or Random Allocation/ or Double-Blind Method/ or Single-Blind Method/ or (clinical trial, phase i or clinical trial, phase ii or clinical trial, phase iii or clinical trial, phase iv or controlled clinical trial or randomized controlled trial or multicenter study or clinical trial).pt. or random*.ti,ab. or (clinic* adj trial*).tw. or ((singl* or doubl* or treb* or tripl*) adj (blind$3 or mask$3)).tw. or Placebos/ or placebo*.tw. |
2687808 |
|
9 |
Epidemiologic studies/ or case control studies/ or exp cohort studies/ or Controlled Before-After Studies/ or Case control.tw. or cohort.tw. or Cohort analy$.tw. or (Follow up adj (study or studies)).tw. or (observational adj (study or studies)).tw. or Longitudinal.tw. or Retrospective*.tw. or prospective*.tw. or consecutive*.tw. or Cross sectional.tw. or Cross-sectional studies/ or historically controlled study/ or interrupted time series analysis/ [Onder exp cohort studies vallen ook longitudinale, prospectieve en retrospectieve studies] |
4645843 |
|
10 |
Case-control Studies/ or clinical trial, phase ii/ or clinical trial, phase iii/ or clinical trial, phase iv/ or comparative study/ or control groups/ or controlled before-after studies/ or controlled clinical trial/ or double-blind method/ or historically controlled study/ or matched-pair analysis/ or single-blind method/ or (((control or controlled) adj6 (study or studies or trial)) or (compar* adj (study or studies)) or ((control or controlled) adj1 active) or "open label*" or ((double or two or three or multi or trial) adj (arm or arms)) or (allocat* adj10 (arm or arms)) or placebo* or "sham-control*" or ((single or double or triple or assessor) adj1 (blind* or masked)) or nonrandom* or "non-random*" or "quasi-experiment*" or "parallel group*" or "factorial trial" or "pretest posttest" or (phase adj5 (study or trial)) or (case* adj6 (matched or control*)) or (match* adj6 (pair or pairs or cohort* or control* or group* or healthy or age or sex or gender or patient* or subject* or participant*)) or (propensity adj6 (scor* or match*))).ti,ab,kf. or (confounding adj6 adjust*).ti,ab. or (versus or vs or compar*).ti. or ((exp cohort studies/ or epidemiologic studies/ or multicenter study/ or observational study/ or seroepidemiologic studies/ or (cohort* or 'follow up' or followup or longitudinal* or prospective* or retrospective* or observational* or multicent* or 'multi-cent*' or consecutive*).ti,ab,kf.) and ((group or groups or subgroup* or versus or vs or compar*).ti,ab,kf. or ('odds ratio*' or 'relative odds' or 'risk ratio*' or 'relative risk*' or aor or arr or rrr).ab. or (("OR" or "RR") adj6 CI).ab.)) |
5616453 |
|
11 |
6 and 7 – SR’s |
11 |
|
12 |
(6 and 8) not 11 – RCT’s |
30 |
|
13 |
(6 and (9 or 10)) not (11 or 12) – Observationele studies |
206 |
|
14 |
11 or 12 or 13 |
247 |
Update 1 juli 2024
Algemene informatie
|
Cluster/richtlijn: Schouderinstabiliteit - Module 2 Posttraumatische schouderinstabiliteit Update |
|
|
Uitgangsvraag/modules: Welk (aanvullend?) beeldvormend onderzoek moet worden verricht bij post traumatische schouderinstabiliteit? |
|
|
Database(s): Embase.com, Ovid/Medline |
Datum: 1-7-2024 |
|
Periode: vanaf 6-7-2024 |
Talen: geen restrictie |
|
Literatuurspecialist: Esther van der Bijl |
Rayyan review: https://rayyan.ai/reviews/1080630 |
|
BMI-zoekblokken: voor verschillende opdrachten wordt (deels) gebruik gemaakt van de zoekblokken van BMI-Online https://blocks.bmi-online.nl/ Bij gebruikmaking van een volledig zoekblok zal naar de betreffende link op de website worden verwezen. |
|
|
Toelichting: Voor deze vraag is gezocht op de elementen Schouderinstabiliteit en MRI.
→ Het sleutelartikel van Gaoming Liu et al. (2024) wordt gevonden met deze search.
Zoals besproken is er gezocht met de P, I en het diagnostisch filter. In overleg zijn bij de P ook de zoektermen ‘glenoid bone loss’ en ‘glenoid defect’ meegenomen, omdat anders relevante artikelen gemist worden. |
|
|
Te gebruiken voor richtlijntekst: In de databases Embase.com en Ovid/Medline is op 1 juli 2024 systematisch gezocht naar systematische reviews, RCTs en observationele studies over de diagnostische accuratesse van MRI bij patiënten met verdenking op posttraumatische schouderinstabiliteit (ossale component). De literatuurzoekactie leverde 67 unieke treffers op. |
|
Zoekopbrengst - 1 juli 2024
|
|
EMBASE |
OVID/MEDLINE |
Rayyan |
Ontdubbeld |
|
SR |
87 |
12 |
83 |
8 |
|
RCT |
208 |
30 |
210 |
12 |
|
Observationeel |
666 |
215 |
667 |
47 |
|
Totaal |
961 |
257 |
960 |
67* |
*in Rayyan
Zoekstrategie - 1 juli 2024
Embase.com
|
No. |
Query |
Results |
|
#1 |
'shoulder dislocation'/exp OR 'recurrent shoulder dislocation'/exp OR 'bankart lesion'/exp OR ((('shoulder*' OR 'gleno-humer*' OR 'glenoid*' OR 'humer*' OR 'scapulohumer*' OR 'glenohumer*') NEAR/3 ('dislocat*' OR 'diastasis' OR 'instabil*' OR 'luxat*' OR 'subluxat*' OR 'defect*')):ti,ab,kw) OR (('shoulder*':ti,ab,kw OR glenoid*:ti,ab,kw OR 'gleno-humer*':ti,ab,kw OR 'humer*':ti,ab,kw OR 'scapulohumer*':ti,ab,kw OR 'glenohumer*':ti,ab,kw) AND (('bon*' NEAR/3 ('loss*' OR 'erosion*')):ti,ab,kw)) OR ((('bankart' OR 'hill-sachs') NEAR/3 ('fracture*' OR 'lesion*' OR 'tear*')):ti,ab,kw) OR ((('on track' OR 'off track') NEAR/3 ('hill sachs' OR 'bone loss*' OR 'shoulder*' OR 'lesion*')):ti,ab,kw) |
17924 |
|
#2 |
'nuclear magnetic resonance imaging'/exp OR 'mri scanner'/exp OR ('magnetic resonance':ab,ti AND (image:ab,ti OR images:ab,ti OR imaging:ab,ti)) OR mri:ab,ti OR mris:ab,ti OR nmr:ab,ti OR mra:ab,ti OR mras:ab,ti OR zeugmatograph*:ab,ti OR 'mr tomography':ab,ti OR 'mr tomographies':ab,ti OR 'mr tomographic':ab,ti OR 'mr imag*':ti,ab,kw OR 'proton spin':ab,ti OR ((magneti*:ab,ti OR 'chemical shift':ab,ti) AND imaging:ab,ti) OR fmri:ab,ti OR fmris:ab,ti OR rsfmri:ti,ab,kw |
1648669 |
|
#3 |
'diagnostic procedure'/exp OR 'sensitivity and specificity'/de OR sensitivity:ab,ti OR specificity:ab,ti OR predict*:ab,ti OR 'roc curve':ab,ti OR 'receiver operator':ab,ti OR 'receiver operators':ab,ti OR likelihood:ab,ti OR 'diagnostic error'/exp OR 'diagnostic accuracy'/exp OR 'diagnostic test accuracy study'/exp OR 'inter observer':ab,ti OR 'intra observer':ab,ti OR interobserver:ab,ti OR intraobserver:ab,ti OR validity:ab,ti OR kappa:ab,ti OR reliability:ab,ti OR reproducibility:ab,ti OR ((test NEAR/2 're-test'):ab,ti) OR ((test NEAR/2 'retest'):ab,ti) OR 'reproducibility'/exp OR accuracy:ab,ti OR 'differential diagnosis'/exp OR 'validation study'/de OR 'measurement precision'/exp OR 'diagnostic value'/exp OR 'reliability'/exp OR 'predictive value'/exp OR ppv:ti,ab,kw OR npv:ti,ab,kw OR (((false OR true) NEAR/3 (negative OR positive)):ti,ab) OR diagnos*:ti,ab |
25239131 |
|
#4 |
#1 AND #2 AND #3 |
2539 |
|
#5 |
#4 AND [2000-2024]/py NOT ('conference abstract'/it OR 'editorial'/it OR 'letter'/it OR 'note'/it) NOT (('animal'/exp OR 'animal experiment'/exp OR 'animal model'/exp OR 'nonhuman'/exp) NOT 'human'/exp) |
1935 |
|
#6 |
'meta analysis'/exp OR 'meta analysis (topic)'/exp OR metaanaly*:ti,ab OR 'meta analy*':ti,ab OR metanaly*:ti,ab OR 'systematic review'/de OR 'cochrane database of systematic reviews'/jt OR prisma:ti,ab OR prospero:ti,ab OR (((systemati* OR scoping OR umbrella OR 'structured literature') NEAR/3 (review* OR overview*)):ti,ab) OR ((systemic* NEAR/1 review*):ti,ab) OR (((systemati* OR literature OR database* OR 'data base*') NEAR/10 search*):ti,ab) OR (((structured OR comprehensive* OR systemic*) NEAR/3 search*):ti,ab) OR (((literature NEAR/3 review*):ti,ab) AND (search*:ti,ab OR database*:ti,ab OR 'data base*':ti,ab)) OR (('data extraction':ti,ab OR 'data source*':ti,ab) AND 'study selection':ti,ab) OR ('search strategy':ti,ab AND 'selection criteria':ti,ab) OR ('data source*':ti,ab AND 'data synthesis':ti,ab) OR medline:ab OR pubmed:ab OR embase:ab OR cochrane:ab OR (((critical OR rapid) NEAR/2 (review* OR overview* OR synthes*)):ti) OR ((((critical* OR rapid*) NEAR/3 (review* OR overview* OR synthes*)):ab) AND (search*:ab OR database*:ab OR 'data base*':ab)) OR metasynthes*:ti,ab OR 'meta synthes*':ti,ab |
1041201 |
|
#7 |
'clinical trial'/exp OR 'randomization'/exp OR 'single blind procedure'/exp OR 'double blind procedure'/exp OR 'crossover procedure'/exp OR 'placebo'/exp OR 'prospective study'/exp OR rct:ab,ti OR random*:ab,ti OR 'single blind':ab,ti OR 'randomised controlled trial':ab,ti OR 'randomized controlled trial'/exp OR placebo*:ab,ti |
4060691 |
|
#8 |
'major clinical study'/de OR 'clinical study'/de OR 'case control study'/de OR 'family study'/de OR 'longitudinal study'/de OR 'retrospective study'/de OR 'prospective study'/de OR 'comparative study'/de OR 'cohort analysis'/de OR ((cohort NEAR/1 (study OR studies)):ab,ti) OR (('case control' NEAR/1 (study OR studies)):ab,ti) OR (('follow up' NEAR/1 (study OR studies)):ab,ti) OR (observational NEAR/1 (study OR studies)) OR ((epidemiologic NEAR/1 (study OR studies)):ab,ti) OR (('cross sectional' NEAR/1 (study OR studies)):ab,ti) |
8297412 |
|
#9 |
'case control study'/de OR 'comparative study'/exp OR 'control group'/de OR 'controlled study'/de OR 'controlled clinical trial'/de OR 'crossover procedure'/de OR 'double blind procedure'/de OR 'phase 2 clinical trial'/de OR 'phase 3 clinical trial'/de OR 'phase 4 clinical trial'/de OR 'pretest posttest design'/de OR 'pretest posttest control group design'/de OR 'quasi experimental study'/de OR 'single blind procedure'/de OR 'triple blind procedure'/de OR (((control OR controlled) NEAR/6 trial):ti,ab,kw) OR (((control OR controlled) NEAR/6 (study OR studies)):ti,ab,kw) OR (((control OR controlled) NEAR/1 active):ti,ab,kw) OR 'open label*':ti,ab,kw OR (((double OR two OR three OR multi OR trial) NEAR/1 (arm OR arms)):ti,ab,kw) OR ((allocat* NEAR/10 (arm OR arms)):ti,ab,kw) OR placebo*:ti,ab,kw OR 'sham-control*':ti,ab,kw OR (((single OR double OR triple OR assessor) NEAR/1 (blind* OR masked)):ti,ab,kw) OR nonrandom*:ti,ab,kw OR 'non-random*':ti,ab,kw OR 'quasi-experiment*':ti,ab,kw OR crossover:ti,ab,kw OR 'cross over':ti,ab,kw OR 'parallel group*':ti,ab,kw OR 'factorial trial':ti,ab,kw OR ((phase NEAR/5 (study OR trial)):ti,ab,kw) OR ((case* NEAR/6 (matched OR control*)):ti,ab,kw) OR ((match* NEAR/6 (pair OR pairs OR cohort* OR control* OR group* OR healthy OR age OR sex OR gender OR patient* OR subject* OR participant*)):ti,ab,kw) OR ((propensity NEAR/6 (scor* OR match*)):ti,ab,kw) OR versus:ti OR vs:ti OR compar*:ti OR ((compar* NEAR/1 study):ti,ab,kw) OR (('major clinical study'/de OR 'clinical study'/de OR 'cohort analysis'/de OR 'observational study'/de OR 'cross-sectional study'/de OR 'multicenter study'/de OR 'correlational study'/de OR 'follow up'/de OR cohort*:ti,ab,kw OR 'follow up':ti,ab,kw OR followup:ti,ab,kw OR longitudinal*:ti,ab,kw OR prospective*:ti,ab,kw OR retrospective*:ti,ab,kw OR observational*:ti,ab,kw OR 'cross sectional*':ti,ab,kw OR cross?ectional*:ti,ab,kw OR multicent*:ti,ab,kw OR 'multi-cent*':ti,ab,kw OR consecutive*:ti,ab,kw) AND (group:ti,ab,kw OR groups:ti,ab,kw OR subgroup*:ti,ab,kw OR versus:ti,ab,kw OR vs:ti,ab,kw OR compar*:ti,ab,kw OR 'odds ratio*':ab OR 'relative odds':ab OR 'risk ratio*':ab OR 'relative risk*':ab OR 'rate ratio':ab OR aor:ab OR arr:ab OR rrr:ab OR ((('or' OR 'rr') NEAR/6 ci):ab))) |
15203455 |
|
#10 |
#5 AND #6 – SR’s |
87 |
|
#11 |
#5 AND #7 NOT #10 – RCT’s |
208 |
|
#12 |
#5 AND (#8 OR #9) NOT (#10 OR #11) – Observationele studies |
666 |
|
#13 |
#10 OR #11 OR #12 |
961 |
Ovid/Medline
|
# |
Searches |
Results |
|
1 |
exp Shoulder Dislocation/ or exp Bankart Lesions/ or ((shoulder* or gleno-humer* or glenoid* or humer* or scapulohumer* or glenohumer*) adj3 (dislocat* or diastasis or instabil* or luxat* or subluxat* or defect*)).ti,ab,kf. or ((shoulder* or glenoid* or gleno-humer* or humer* or scapulohumer* or glenohumer*) and (bon* adj3 (loss* or erosion*))).ti,ab,kf. or ((bankart or hill-sachs) adj3 (fracture* or lesion* or tear*)).ti,ab,kf. or ((on track or off track) adj3 (hill sachs or bone loss* or shoulder* or lesion*)).ti,ab,kf. |
14039 |
|
2 |
exp magnetic resonance imaging/ or ("magnetic resonance" and (image or images or imaging)).ti,ab,kf. or mri.ti,ab,kf. or mris.ti,ab,kf. or nmr.ti,ab,kf. or mra.ti,ab,kf. or mras.ti,ab,kf. or zeugmatograph*.ti,ab,kf. or "mr tomography".ti,ab,kf. or "mr tomographies".ti,ab,kf. or "mr tomographic".ti,ab,kf. or 'mr imag*'.ti,ab,kf. or "proton spin".ti,ab,kf. or ((magneti* or "chemical shift") and imaging).ti,ab,kf. or fmri.ti,ab,kf. or fmris.ti,ab,kf. or rsfmri.ti,ab,kf. |
1002425 |
|
3 |
exp "Sensitivity and Specificity"/ or (sensitivity or specificity).ti,ab. or (predict* or ROC-curve or receiver-operator*).ti,ab. or (likelihood or LR*).ti,ab. or exp Diagnostic Errors/ or (inter-observer or intra-observer or interobserver or intraobserver or validity or kappa or reliability).ti,ab. or reproducibility.ti,ab. or (test adj2 (re-test or retest)).ti,ab. or "Reproducibility of Results"/ or accuracy.ti,ab. or Diagnosis, Differential/ or Validation Study/ or ((false or true) adj3 (negative or positive)).ti,ab. |
5126703 |
|
4 |
1 and 2 and 3 |
423 |
|
5 |
limit 4 to yr="2000 -Current" |
364 |
|
6 |
5 not (comment/ or editorial/ or letter/) not ((exp animals/ or exp models, animal/) not humans/) |
356 |
|
7 |
meta-analysis/ or meta-analysis as topic/ or (metaanaly* or meta-analy* or metanaly*).ti,ab,kf. or systematic review/ or cochrane.jw. or (prisma or prospero).ti,ab,kf. or ((systemati* or scoping or umbrella or "structured literature") adj3 (review* or overview*)).ti,ab,kf. or (systemic* adj1 review*).ti,ab,kf. or ((systemati* or literature or database* or data-base*) adj10 search*).ti,ab,kf. or ((structured or comprehensive* or systemic*) adj3 search*).ti,ab,kf. or ((literature adj3 review*) and (search* or database* or data-base*)).ti,ab,kf. or (("data extraction" or "data source*") and "study selection").ti,ab,kf. or ("search strategy" and "selection criteria").ti,ab,kf. or ("data source*" and "data synthesis").ti,ab,kf. or (medline or pubmed or embase or cochrane).ab. or ((critical or rapid) adj2 (review* or overview* or synthes*)).ti. or (((critical* or rapid*) adj3 (review* or overview* or synthes*)) and (search* or database* or data-base*)).ab. or (metasynthes* or meta-synthes*).ti,ab,kf. |
756806 |
|
8 |
exp clinical trial/ or randomized controlled trial/ or exp clinical trials as topic/ or randomized controlled trials as topic/ or Random Allocation/ or Double-Blind Method/ or Single-Blind Method/ or (clinical trial, phase i or clinical trial, phase ii or clinical trial, phase iii or clinical trial, phase iv or controlled clinical trial or randomized controlled trial or multicenter study or clinical trial).pt. or random*.ti,ab. or (clinic* adj trial*).tw. or ((singl* or doubl* or treb* or tripl*) adj (blind$3 or mask$3)).tw. or Placebos/ or placebo*.tw. |
2744645 |
|
9 |
Epidemiologic studies/ or case control studies/ or exp cohort studies/ or Controlled Before-After Studies/ or Case control.tw. or cohort.tw. or Cohort analy$.tw. or (Follow up adj (study or studies)).tw. or (observational adj (study or studies)).tw. or Longitudinal.tw. or Retrospective*.tw. or prospective*.tw. or consecutive*.tw. or Cross sectional.tw. or Cross-sectional studies/ or historically controlled study/ or interrupted time series analysis/ [Onder exp cohort studies vallen ook longitudinale, prospectieve en retrospectieve studies] |
4763832 |
|
10 |
Case-control Studies/ or clinical trial, phase ii/ or clinical trial, phase iii/ or clinical trial, phase iv/ or comparative study/ or control groups/ or controlled before-after studies/ or controlled clinical trial/ or double-blind method/ or historically controlled study/ or matched-pair analysis/ or single-blind method/ or (((control or controlled) adj6 (study or studies or trial)) or (compar* adj (study or studies)) or ((control or controlled) adj1 active) or "open label*" or ((double or two or three or multi or trial) adj (arm or arms)) or (allocat* adj10 (arm or arms)) or placebo* or "sham-control*" or ((single or double or triple or assessor) adj1 (blind* or masked)) or nonrandom* or "non-random*" or "quasi-experiment*" or "parallel group*" or "factorial trial" or "pretest posttest" or (phase adj5 (study or trial)) or (case* adj6 (matched or control*)) or (match* adj6 (pair or pairs or cohort* or control* or group* or healthy or age or sex or gender or patient* or subject* or participant*)) or (propensity adj6 (scor* or match*))).ti,ab,kf. or (confounding adj6 adjust*).ti,ab. or (versus or vs or compar*).ti. or ((exp cohort studies/ or epidemiologic studies/ or multicenter study/ or observational study/ or seroepidemiologic studies/ or (cohort* or 'follow up' or followup or longitudinal* or prospective* or retrospective* or observational* or multicent* or 'multi-cent*' or consecutive*).ti,ab,kf.) and ((group or groups or subgroup* or versus or vs or compar*).ti,ab,kf. or ('odds ratio*' or 'relative odds' or 'risk ratio*' or 'relative risk*' or aor or arr or rrr).ab. or (("OR" or "RR") adj6 CI).ab.)) |
5725437 |
|
11 |
6 and 7 – SR’s |
12 |
|
12 |
(6 and 8) not 11 – RCT’s |
30 |
|
13 |
(6 and (9 or 10)) not (11 or 12) – Observationele studies |
215 |
|
14 |
11 or 12 or 13 |
257 |