Prognostische factoren ernstige bacteriële infectie
Uitgangsvraag
1. Welke (combinatie van) anamnestische gegevens en symptomen bij het lichamelijk onderzoek zijn geassocieerd met een verhoogd risico op de aanwezigheid van een ernstige bacteriële infectie bij kinderen met koorts op de SEH?
2. Welk predictiemodel kan het beste gebruikt worden om de kans op ernstige bacteriële infecties (op basis van klinische kenmerken en aanvullende diagnostiek) bij kinderen met koorts op een SEH te voorspellen?
Aanbeveling
Gebruik een vaste structuur om op basis van de klinische symptomen van het kind in te schatten hoe groot de kans is op een ernstige bacteriële infectie. De ‘NICE stoplichttabel’ is hier een bruikbare benadering voor.
Overweeg daarnaast het gebruik van een predictiemodel om aan de hand van symptomen en laboratoriumwaarden van het kind in te schatten hoe groot de kans is op een ernstige bacteriële infectie. Bruikbare modellen zijn o.a.de Step-by-Step Approach to Febrile Infants bij kinderen ≤3 maanden, om laag risico kinderen te identificeren (Mintegi, 2014), De Lab-score bij kinderen < 12 maanden (Galetto-Lacour, 2010) of de Feverkidstool (Nijman, 2013). Besef dat geen enkel model sluitend is en dat daarom bij kinderen die als laag-risico worden geclassificeerd, een plan voor eventuele klinische observatie of herbeoordeling moet worden opgesteld.
Overwegingen
Voor- en nadelen van de interventie en de kwaliteit van het bewijs
Enkele studies onderzochten predictoren voor ernstige bacteriële infecties (SBI’s) in een multivariaat model. Doordat deze studies verschillende uitkomstmaten gebruikten, zijn de resultaten apart gerapporteerd voor urineweginfecties (UWI’s), pneumonie, IBI en totale SBI. Een aantal factoren lijkt in de studies geassocieerd met een verhoogd of juist verlaagd risico op deze uitkomstmaten. In studies die rapporteerden over totale SBI is het goed om te bedenken dat ook in die groep de diagnoses pneumonie en UWI de verre meerderheid van de SBI betroffen. De aard van de predictoren komt daardoor redelijk overeen.
De volgende factoren lijken predictoren te zijn voor UWI’s bij kinderen jonger dan 5 jaar oud die zich met koorts op de afdeling spoedeisende hulp melden: langere ziekteduur, zieke indruk, het hebben van een chronische ziekte, huilen, heet aanvoelen, koude rillingen, verminderde intake, verhoogde hartslag, niet-ingeënt zijn voor meningokokken, zeer hoge lichaamstemperatuur en koorts voor meer dan 2 dagen. De volgende factoren lijken het risico op een UWI juist te verlagen: luchtwegsymptomen, diarree, hoesten, abnormale keel, neus en oorsymptomen, mannelijk geslacht, focale bacteriële infectie, infectiecontact en rash.
De volgende factoren lijken predictoren te zijn voor pneumonie bij kinderen van 1 maand tot 16 jaar oud die zich met koorts op de afdeling spoedeisende hulp melden: langere ziekteduur/duur van koorts, zieke indruk, ademhalingsmoeilijkheden, lage zuurstofverzadiging, het hebben van een chronische ziekte, hoesten, gekraak op de borst, abnormaal borstgeluid, verhoogde hartslag, verhoogde ademhalingsfrequentie, niet-ingeënt zijn voor pneumokokken, zeer hoge lichaamstemperatuur en CRP. De volgende factoren maken pneumonie juist minder waarschijnlijk: abnormale keel, neus en oorsymptomen, huiduitslag en hoorbare piepende ademhaling.
Vrouwelijk geslacht en CRP lijken predictoren te zijn voor totale SBI bij kinderen jonger dan 5 jaar oud die zich met koorts op de afdeling spoedeisende hulp melden.
Een goed uitgevoerde RCT (de Vos-Kerkhof, 2015), zij het met een laag aantal events, laat zien dat het gebruiken van het beschreven klinische predictiemodel, de zgn. Feverkidstool (Nijman, 2013) bij het beslissen wel of niet diagnostisch onderzoek uit te voeren leidt tot een gestandaardiseerde benadering, met vergelijkbare diagnostische accuratesse tov de reguliere zorg van het diagnosticeren van ernstige bacteriële infecties in kinderen onder 16 jaar oud die zich met koorts op de afdeling spoedeisende hulp melden. De bewijskracht hiervoor is redelijk. Met deze studie is de bewijskracht voor de onderzochte beslisregel niveau 4 volgens Reilly (2006), namelijk impact analyse in 1 setting na brede cross validatie.
Enkele studies onderzochten de diagnostische accuratesse van verschillende klinische predictiemodellen voor SBI’s. De Lab-score (Galetto-Lacour, 2010), gebaseerd op de factoren urineanalyse, PCT en CRP, en het predictiemodel van Bachur en Harper (2001), gebaseerd op leeftijd, temperatuur, urineanalyse en WBC resulteerden in de laagste post-test kans op SBI bij een negatieve test en de hoogste post-test kans op SBI bij een positieve test. De lab-score heeft een aangetoond consistente diagnostische waarde in een prospectieve nieuwe populatie (niveau 3 volgens Reilly (2006)). De bewijskracht hiervoor is redelijk.
De NICE-stoplichttabel en NHG-alarmsymptomen zijn gerapporteerd in een low-event validatieonderzoek (Kerkhof, 2014). Geen van de beide kon een statistisch significant verhoogde of verlaagde kans op SBI laten zien.
Waarden en voorkeuren van patiënten (en evt. hun verzorgers)
Wij hebben de waarden voorkeuren van patiënten niet onderzocht. Het is echter aannemelijk dat het voor ouders met name belangrijk is dat goed wordt gekeken naar hun individuele kind, en dat de zorgen van de ouders daarbij serieus worden genomen. Wij hebben geen bewijs gevonden voor het gebruik van het alarmsymptoom “bezorgdheid van ouders” op de SEH; dit kenmerk is daarom niet als zodanig terug te vinden in de aanbevelingen. Wel is de werkgroep van mening dat bezorgdheid van de ouders, in de betekenis dat de ziekte “anders is dan anders”, serieus genomen dient te worden. Ook in het Dutch PEWS systeem wordt dit als factor meegenomen (Fuijkschot, 2015).
Kosten (middelenbeslag)
De ervaring leert dat artsen bij kinderen met koorts zonder focus relatief vaak geneigd zijn diagnostiek in te zetten en/of te kiezen voor opname, al dan niet met antibiotica. Dit uit angst om ernstige bacteriële infecties te missen. Daar waar het gebruik van data en modellen kan helpen om deze middelen gerichter in te zetten, zal dit dus eerder leiden tot een afname dan een toename van de kosten. Hierbij dient te worden opgemerkt dat kosten van diagnostiek gemiddeld slechts 1-3% van de totale kosten van beoordeling en behandeling van kinderen met koorts betreffen (Kerkhof, 2014; Van de Maat, 2020), dus effecten op kosten door blijven beperkt.
Indien predictiemodellen worden aanbevolen waarin het standaard gebruik van relatief dure biomarkers zoals procalcitonine is opgenomen, zou dit wel de zorgkosten enkele procenten van de totale kosten kunnen doen toenemen.
Aanvaardbaarheid, haalbaarheid en implementatie
De beschreven modellen zijn nog niet allemaal vrij beschikbaar als app of andere praktische tool. Om een model te kunnen implementeren wat een berekening bevat (versus een checklist), moet het model wel op enige wijze beschikbaar zijn.
In de lab-score is een procalcitonine bepaling opgenomen. Deze bepaling is momenteel in veel ziekenhuizen nog niet beschikbaar.
In enkele modellen is het neutrofielen getal opgenomen. In kleinere ziekenhuizen kan het zijn dat een leucocyten differentiatie alleen onder kantooruren wordt uitgevoerd.
Rationale van de aanbeveling: weging van argumenten voor en tegen de interventies
Voor deze module was de werkgroep op zoek naar handvatten om uit de groep met kinderen die zich op de SEH presenteren met koorts zonder focus, die kinderen te identificeren die een verhoogd risico hebben op de aanwezigheid van een ernstige bacteriële infectie. Eerst is gekeken naar de voorspellende waarde van individuele symptomen (anamnestische gegevens en/of bevindingen bij het lichamelijk onderzoek). Helaas blijkt de vraag welke individuele symptomen geassocieerd zijn met een verhoogd risico op een ernstige bacteriële infectie, indien er nog geen verdenking is op een specifieke infectie, erg lastig te beantwoorden. Enerzijds omdat er vele symptomen zijn die potentieel geassocieerd zijn met een verhoogd risico op een ernstige bacteriële infectie. Anderzijds zou ook mee kunnen spelen dat er verschillende soorten ernstige bacteriële infecties bestaan, waarbij de mate van ziek zijn behoorlijk uiteen kan lopen. Hierdoor konden wij enkel symptomen beschrijven die zijn geassocieerd met een verhoogd of juist verlaagd risico op UWI of pneumonie. Ook bij studies die zich hebben gericht op total SBI nemen deze 2 ziektebeelden een grote plaats in. Op de vraag bij welke individuele symptomen je aan een ernstige bacteriële infectie moet denken, op het moment dat je nog niet een specifieke infectie in gedachten hebt, heeft de werkgroep geen duidelijk antwoord gevonden in de literatuur.
In de literatuur analyse is tevens gezocht naar predictiemodellen die de kans op ernstige bacteriële infecties voorspellen. Er zijn veel modellen beschikbaar, elk met eigen karakteristieken: niet alleen de kenmerken die mee worden gewogen, maar ook de leeftijdsgroep waar het voor is ontwikkeld, de wijze waarop de uitkomstmaat is gedefinieerd, en of het een dichotoom of continue model betreft. Zie appendix tabel 1 (Table 1. Included models and predictor variables) voor het overzicht van alle beschreven modellen. De werkgroep beschouwt een hoge sensitiviteit (laag aantal fout-negatieve uitslagen) als een belangrijk kenmerk van een goed predictiemodel voor koorts zonder focus op de SEH. Dit omdat het erg gevaarlijk kan zijn om een kind onterecht als laag-risico patiënt te beschouwen. Uiteraard is het model ook van weinig toegevoegde waarde als er sprake is van een lage specificiteit: indien veel kinderen onterecht als hoog risico worden gezien dan zal dit leiden tot onnodige over-diagnostiek en -behandeling. Een aanvullend criterium voor de bewijslast van de predictiemodellen is het niveau van evaluatie op de trap van 5 (Reilly, 2006): 1) derivatie, 2) validatie in 1 setting, 3) brede validatie in meer settings, 4) impact analyse in 1 setting en 5) brede impact analyse in meer settings.
Geen van de modellen had dusdanig overtuigende resultaten dat een sterke aanbeveling op zijn plek lijkt. Er zijn meerdere modellen beschikbaar die bewezen ondersteunend kunnen zijn in het proces, maar slechts een beperkt aantal daarvan heeft een hoog niveau van evaluatie op basis van brede cross validatie of impact analyse.
De modellen die de beste resultaten laten zien zijn modellen die ook laboratorium waarden bevatten; er is geen overtuigend model gevonden dat enkel uit symptomen bestaat. Vooral bij kinderen jonger dan 3 maanden lijkt een laboratoriumwaarde de kracht van het model te vergroten (De Vos-Kerkhof 2018). Dit wordt ook bevestigd door een studie van Kuppermann (2019), die een normale urine dipstick en laag procalcitonine en neutrofielen in het bloed als belangrijke voorspellers voor afwezigheid van meningitis, bacteriemie of urineweginfectie identificeert. Deze studie is op basis van design (analysemethoden en het ontbreken van de voorspellende waarde van de onafhankelijke predictoren) geexcludeerd bij de literatuurselectie. Echter qua bewijslast (grote populatie van bijna 200 zuigelingen <60 dagen) is de studie noemenswaardig. De werkgroep is van mening dat het belangrijk is om ook voordat laboratoriumwaarden bekend zijn, een onderbouwde inschatting te kunnen maken van de kans op een ernstige infectie. Enerzijds omdat bij evidente hoog-risico kinderen zo snel mogelijk antibiotica moet worden gestart. Anderzijds omdat bij wat oudere kinderen met enkel laag-risico symptomen, soms juist kan worden afgezien van laboratoriumonderzoek. Daarnaast moet men zich realiseren dat de meeste predictiemodellen vrij beperkt zijn en verre van waterdicht, waardoor het van toegevoegde waarde kan zijn om bij een patiënt op verschillende manieren een inschatting te maken van de kans op een ernstige bacteriële infectie.
In de vorige versie van deze richtlijn, alsmede in de NICE richtlijn, wordt geadviseerd om gebruik te maken van de NICE stoplichttabel. Deze stoplichttabel bevat slechts een overzicht van losse individuele kenmerken en kan daarmee beter als een gestandaardiseerde checklist dan als een predictiemodel worden beschouwd. In de literatuuranalyse kon de waarde van dit model dan ook niet goed worden aangetoond. Desondanks zou de werkgroep het als een gemis zien als deze tabel uit de richtlijn zou verdwijnen. Als gestandaardiseerde checklist is de tabel de afgelopen jaren in de praktijk wel degelijk van toegevoegde waarde gebleken. Vandaar dat de werkgroep dit model toch opnieuw in de aanbevelingen opneemt. Daarbij zijn de beschreven lijsten met symptomen die zijn geassocieerd met een verhoogd risico op UWI of pneumonie, naast de NICE stoplichttabel gelegd. Hetzelfde is gedaan met de symptomen die in de verschillende modellen werden meegenomen. De werkgroep heeft bekeken of in die lijsten belangrijke symptomen genoemd staan, die in de NICE stoplichttabel ontbreken. Op basis hiervan zijn geen nieuwe items toegevoegd. Wel heeft de werkgroep een item opgenomen in de stoplichttabel wat in de vorige versie van deze richtlijn was weggelaten: het oranje “koorts > 39 graden bij leeftijd 3-6 maanden”. Dit item is samengevoegd met het rode NICE item “koorts > 38 graden bij leeftijd <3 maanden" tot een oranje item “koorts > 39 graden bij leeftijd 0-6 maanden”. Hiervoor is gekozen omdat de werkgroep van mening is dat niet alle kinderen < 3 maanden per definitie in de rode (hoog-risico) categorie hoeven te vallen. Met de verhoogde kwetsbaarheid van kinderen <3 maanden is uiteraard wel rekening gehouden bij het opstellen van de adviezen voor kinderen in deze leeftijdsgroep in de oranje en groene risico-categorieën (NICE stoplichtentabel, link toevoegen appendix tabel 2).
Los van de (consensus-based) alarmsymptomen moet bij sommige kinderen rekening worden gehouden op een a priori verhoogde kans op een ernstige bacteriële infectie. Denk hierbij aan kinderen met een onderliggende afweerstoornis, prematuur geboren kinderen of aan kinderen die niet gevaccineerd zijn. Tevens moet men in de benadering van een kind met koorts zonder focus altijd alert blijven op symptomen die wel in de richting van een focus kunnen wijzen. In de appendix tabel 3 ‘Samenvatting van symptomen van specifieke aandoeningen’ staan kenmerken voor specifieke aandoeningen. Indien deze kenmerken aanwezig zijn bij kinderen met koorts dient aanvullende diagnostiek voor specifieke aandoeningen te worden overwogen.
Onderbouwing
Achtergrond
Het merendeel van de kinderen die zich met koorts presenteren op de SEH heeft een virale infectie die geen antibiotische behandeling behoeft. De grote uitdaging is om die kinderen die wél een ernstige bacteriële infectie (meningitis, sepsis, urineweginfectie, pneumonie) hebben, vroegtijdig te herkennen. Indien met behulp van anamnese en lichamelijk onderzoek kinderen met een verhoogd risico op een bacteriële infectie kunnen worden geïdentificeerd, kan bij een deel van de kinderen met een self-limiting infectie, onnodige diagnostiek en/of behandeling voorkomen worden. In de vorige versie van de richtlijn werd hiervoor het gebruik van de NICE stoplichttabel geadviseerd. Deze tabel, met een overzicht van verschillende klinische kenmerken, wordt inmiddels al jarenlang intensief gebruikt. De vraag is of er op basis van de literatuur redenen zijn om andere klinische kenmerken te gaan gebruiken.
Vervolgens is de vraag of er een voldoende gevalideerd predictiemodel beschikbaar is, gebaseerd op klinische karakteristieken en aanvullende diagnostiek, die kan ondersteunen om de kans op ernstige bacteriële infecties bij kinderen met koorts op een SEH te voorspellen.
Conclusies / Summary of Findings
|
Low GRADE |
The evidence suggests that longer duration of illness, general appearance, having a chronic disease, crying, feeling hot, having chills, no fluid intake, elevated heart rate, being unvaccinated for meningococcal, very high recorded temperature and fever for more than 2 days are predictors of urinary tract infection in children <5 year presenting to the emergency department with fever.
The evidence suggests that having respiratory symptoms, having diarrhoea, cough, abnormal ear, nose and throat signs, being male, having focal bacterial infection, infectious contacts and rash makes the diagnosis of urinary tract infection in children <5 year presenting to the emergency department with fever less likely.
Sources: Craig, 2010; Williams-Smith, 2020 |
|
Low GRADE |
The evidence suggests that longer duration of illness/fever, general/ill appearance, breathing difficulty, low oxygen saturation, having a chronic disease, cough, chest crackles, abnormal chest sound, elevated heart rate, elevated respiratory rate, being unvaccinated for pneumococcal, very high recorded temperature and CRP are predictors of pneumonia in children aged 1 month to 16 years old presenting to the emergency department with fever.
The evidence suggests that abnormal ear, nose and throat signs, rash and audible wheeze makes the diagnosis of pneumonia in children aged 1 month to 16 years old presenting to the emergency department with fever less likely.
Sources: Craig, 2010; Nijman, 2013; Nijman, 2018 |
|
Very low GRADE |
The evidence is very uncertain about the predictors of Invasive bacterial infection in children aged ≤6 months old presenting to the emergency department with fever.
Sources: Aronson, 2019 |
|
Very low GRADE |
The evidence is very uncertain about the predictors of total serious bacterial infection in children aged 1 month to 16 years old presenting to the emergency department with fever.
Sources: Nomura, 2019; Brent, 2011 |
|
Low GRADE |
The evidence suggests that being female and CRP are predictors of total serious bacterial infection in children <5 year presenting to the emergency department with fever.
Sources: Nijman, 2013; Nijman, 2018 |
|
Moderate GRADE |
Diagnostic testing guided by the clinical prediction model by Nijman et al. (2013; based on age, temperature, sex, duration fever, prolonged capillary refill, chest wall retractions, ill appearance, oxygen saturation, respiratory rate, heart rate, and C-reactive protein) results in standardized evaluation with little to no difference in diagnostic accuracy of SBI in children aged under 16 years of age presenting to the emergency department with fever without a clear source compared to clinical routine evaluation.
Sources: de Vos-Kerkhof, 2015 |
|
Low GRADE |
Children younger than 3 months The evidence suggests that the continuous clinical prediction model by Craig (2010) is not useful in predicting UTI in children aged <3 months old presenting to the emergency department with fever.
Children 3-12 months old In absence of evidence for children with UTI specifically, no conclusions can be drawn about models predicting UTI in children aged 3-12 months old presenting to the emergency department with fever.
Children older than 12 months In absence of evidence for children with UTI specifically, no conclusions can be drawn about models predicting UTI in children older than 12 months presenting to the emergency department with fever.
Sources: de Vos-Kerkhof, 2018 |
|
Low GRADE |
Children younger than 3 months The evidence suggests that higher scores on the continuous clinical prediction rules by Nijman (2013) and Craig (2010) somewhat increase the probability of pneumonia in children under 3 months presenting to the emergency department with fever.
Children 3-12 months old The evidence suggests that a higher score on the continuous clinical prediction rule by Nijman (2013) somewhat increases the probability of pneumonia in children aged 3-12 months presenting to the emergency department with fever. This was consistent in external cohorts. Application impacts management for hospitalization and antibiotic use.
Children older than 12 months The evidence suggests that the dichotomous prediction rules by Mahabee-Gittens (2005), van den Bruel (2007), and Neuman (2011) have little value in predicting pneumonia in children under 3 years presenting to the emergency department with fever. This was consistent in external cohorts. Application impacts management for hospitalization and antibiotic use.
The evidence suggests that a higher score on the continuous clinical prediction rule by Oostenbrink (2013) somewhat increases the probability of pneumonia in children under 3 years presenting to the emergency department with fever.
Sources: de Vos-Kerkhof, 2018; van de Maat, 2019 |
|
Low GRADE |
Children younger than 3 months The evidence suggests that a positive outcome on the dichotomous clinical prediction rule by Galetto-Lacour (2010, Lab-score) somewhat increases the probability of IBI in infants presenting to the emergency department with fever. This was consistent in external cohorts. The step-by-step rule (ref Mintegi) has in particular sensitivity to detect IBI, but with low specificity.
Children 3-12 months old Due to a lack of research data, no conclusions can be drawn about models predicting IBI in children aged 3-12 months old presenting to the emergency department with fever.
Children older than 12 months Due to a lack of research data, no conclusions can be drawn about models predicting IBI in children older than 12 months presenting to the emergency department with fever.
Sources: Gomez, 2016 |
|
Moderate GRADE |
Children younger than 3 months A positive outcome on the dichotomous clinical prediction rules by Bachur and Harper (2001) increases the probability of total SBI in children under 3 months presenting to the emergency department with fever. A positive outcome on the clinical prediction rule by Van den Bruel (2007) somewhat increases the probability of total SBI in children under 3 months presenting to the emergency department with fever.
A higher score on the continuous clinical prediction model by Bleeker et al. (2007) increases the probability of total SBI in children under 3 months presenting to the emergency department with fever.
Children 3-12 months old A positive outcome on the dichotomous clinical prediction rules by Galetto-Lacour (2010, Lab-score) or Bachur and Harper (2001) increases the probability of total SBI in children 3-12 months old presenting to the emergency department with fever.
Children older than 12 months A negative score on the pneumonia rule or the 5 stage decision tree somewhat lowers the probability of total SBI children aged 0-3 years
Sources: de Vos-Kerkhof, 2018 |
Samenvatting literatuur
1. Prognostic factors
Description of studies
Williams-Smith (2020) performed a prospective cohort study comparing potential predictors of SBI between children with and without SBI aged 0 to 36 months old visiting the emergency department with fever (≥38.0°C) without a source between October 2015 and October 2017. The main outcome was any SBI, including bacteremia, UTI (pyelonephritis), community-acquired pneumonia, bacterial meningitis, osteomyelitis, or septic arthritis
within a 10-day follow-up period. A total of 173 children were included, with a median age of 4.4 months (IQR 2.1-11 months), from which 54% was male. A total of 47 children (27%) had a final diagnosis of SBI, which were all urinary tract infections (UTI’s).
Hagedoorn (2021) performed a prospective observational study to develop and validate a clinical prediction model to identify invasive bacterial infections (IBI’s) in febrile children presenting to different European emergency departments (EDs). Children aged from 0 to 18 years with temperature ≥38.0°C or fever <72 hours before ED visit were included. Twelve EDs in 8 countries participated: Austria, Germany, Greece, Latvia, the Netherlands (n=3), Spain, Slovenia and the UK (n=3). Data were collected for at least 1 year from January 2017 to April 2018. IBI included bacterial meningitis, bacteraemia and bacterial bone/joint infections, defined as culture or PCR detection of a single pathogenic bacterium in blood, cerebrospinal or synovial fluid. A total of 16268 patient were included, from which 135 (0.8%) were diagnosed with an IBI. The median age was 3.2 (IQR 0.8-6.0) and 44% was male for those with an IBI and 2.8 (IQR 1.4-6.0) and 45% was male for those with no IBI. Hagedoorn did not report the 95% confidence interval for the odds ratio in the multivariate logistic model for IBI, whereby the statistical significance of predictors could not be distracted.
Nomura (2019) investigated the predictive value of vital sign parameters for serious bacterial infection (SBI) in young infants (<90 days) visiting the emergency department with axillary temperature ≥38.0°C at triage between November 2011 and November 2013. The recorded vital signs were axillary temperature, heart rate, oxygen saturation and respiratory rate. Respiratory rate was not analyzed, because >20% of the patients had missing values. An SBI was defined as a clinically diagnosed bacterial infection, such as bacterial meningitis, bacteremia, urinary tract infection (UTI), bacterial pneumonia, bacterial soft-tissue infection, suppurative lymphadenitis, osteomyelitis, and bacterial enteritis. Bacterial meningitis, bacteremia, UTI or bacterial enteritis was diagnosed on detection of pathogens from specimens taken from the focus of the infection. Bacterial pneumonia and osteomyelitis diagnosis was based on the clinical manifestations and imaging. Bacterial soft-tissue infection and suppurative lymphadenitis diagnosis was based on the symptoms and physical examination. Multivariate logistic regression analysis was performed to identify the SBI predictors. Gender (male), heart rate (≥180 beats/min), oxygen saturation (≤96%) and body temperature (≥38.5°C) were selected as potential predictors in a multivariate logistic regression analysis. A total of 269 infants were analyzed, from which 59% was male and the mean age was 55.4 (SD 21.7) days. 43 children (16.0%) had an SBI.
Aronson (2019) performed a case-control study of febrile infants ≤60 days old to develop and internally validate a prediction model for invasive bacterial infection (IBI). Children ≤60 days with IBI were identified through query of each hospital’s microbiology laboratory database or electronic medical record system for blood (bacteremia) and/or CSF (bacterial meningitis) cultures with growth of a pathogen. Children with a rectal temperature ≥38°C, documented not ill appearing and without complex condition were included. Each case patients was matched to 2 control children at the same hospital with the closest date of visit to the case patient. The following data was extracted from the medical record: age, sex, gestational age, household sick contacts, symptoms of upper respiratory infection, duration of fever, measured temperature, triage heart rate, respiratory rate, signs of URI and/or bronchiolitis; WBC count, ANC, CRP, procalcitonin, urinalysis results, urine culture and blood culture. IBI was defined by growth of a pathogen in blood (bacteremia) and/or cerebrospinal fluid (bacterial meningitis). A total of 181 children with IBI were included (median age 28 (IQR 16-43) days; 56% male), from which 155 (85.6%) had bacteremia without meningitis and 26 (14.4%) had bacterial meningitis. The case patients were matched to 362 control patients (median age 35.5 (23-47) days; 55% male).
Nijman (2018) performed a prospective observational study in two Dutch emergency departments to validate the Feverkidstool to identify SBI’s in febrile children aged 1 month to 16 years old, and to determine the incremental diagnostic value of procalcitonin (PCT). Children were recruited at the moment of triage and included between February 2009 and May 2012. Fever was defined as a body temperature ≥ 38.5 °C at triage, fever recorded at home within 24 h before consultation, fever as reason for referral by the general practitioner, or fever as positive discriminator in the Manchester Triage System. CRP was measured either by a bedside test (84%) or by a traditional laboratory test (16%). SBI was categorized into children with pneumonia and children with other SBI (UTI, septicemia, meningitis, orbital cellulitis, erysipelas, bacterial gastroenteritis, bacterial arthritis, bacterial upper airway infection, and bacterial osteomyelitis) vs. children with no SBI. A total of 1085 children were included, from which 56% was male and the median age was 1.59 (25th-75th percentile 0.85 to 3.45) years. 73 children (7%) had pneumonia and 98 children (9%) had other SBI’s.
Nijman (2013) performed a prospective observational study in three paediatric emergency departments to derive, cross validate and externally validate a clinical prediction model to assess the risk of different bacterial infections in children with fever at the emergency department. For the derivation and cross validation, all children aged 1 month to 15 years old were prospectively enrolled presenting with fever at the emergency department of the Erasmus MC-Sophia children’s hospital, Rotterdam (2003-05), and the Haga-Juliana children’s hospital, the Hague (2007), the Netherlands. The investigated predictor variables were: age, sex, duration of fever (days), temperature (°C), tachypnoea, tachycardia, oxygen saturation, capillary refill time, chest wall retractions, ill appearance, lnCRO (ln/mg/L) and C statistic. The outcome categories were pneumonia, other serious bacterial infections (SBIs), and no SBIs. Other SBIs included meningitis, septicaemia, UTI, and other (erysipelas, cellulitis, bacterial gastroenteritis, orbital cellulitis, bacterial upper airway infection, ethmoiditis, arthritis, osteomyelitis). A total of 2717 children were included for the development of the prediction model, from which 57% and 55% was male in Erasmus MC-Sophia and Haga-Juliana. The median age was 1.8 (IQR 0.9 to 3.7) years in Erasmus MC-Sophia and 1.5 (IQR 0.7 to 3.2) years. 171 children (6.3%) had pneumonia, 88 children had an UTI (3.2%), 22 children (0.8%) had speticaemia or meningitis, and 60 children had other SBI (2.2%). The external validation was performed in a UK population. Children aged 1 month to 15 years were recruited prospectively at the paediatric assessment unit at the University Hospital Coventry and Warwickshire NHS Trust, United Kingdom, in 2005 and 2006, if an acute infection was suspected by the parents, the referring clinician, or the triage nurse. Children were eligible if fever was reported by the parents or was documented by the triaging nurse (≥38.5ºC). Children with an increased risk of recurrent serious infections, including those with iatrogenic immunosuppression and haematological malignancies were excluded. A total of 487 children were included in the validation population, from which 44% was maile. The median age was 2.5 (IQR 1.3 to 6.3). 59 children (12%) had pneumonia, 28 children had an UTI (6%), 3 children (1%) had speticaemia or meningitis, and 34 children had other SBI (7 %).
Brent (2011) investigated univariate associations between clinical variables and risk of serious bacterial infection (SBI) in children presenting to the emergency department between September 2000/2001 and March 2001/2002. The investigated clinical variables were: age, sex, risk factor for infection, developmental delay, consciousness level (AVPU score), state variation, temperature, tachycardia, capillary refill time, hydration status, hypotension, tachypnoea, hypoxia, purpuric rash, petechial rash and macular rash. SBI was defined as a positive bacterial culture from blood or another normally sterile site in the appropriate clinical context, radiological signs of pneumonia, clinical meningitis plus a cerebrospinal fluid polymorphonuclear leukocytosis, acute febrile purpura, deep collection(s) requiring intravenous antibiotics±surgical drainage, a white blood cell count ≥20×10 9 /l, a C reactive protein ≥120 mg/l, or a final diagnosis of septic arthritis, osteomyelitis, empyema or mastoiditis. Multivariate logistic regression models
were then derived including variables with at least a weak association with SBI in the univariate analysis, to develop a clinical prediction score for SBI.
A total of 1951 children were included in the final analysis, from which 55% was male and the mean age was 19 months (range 1 month to 15 years). 72 of the children (3.7%) had SBI.
Craig (2010) performed a prospective cohort study to develop and test a multivariable model to distinguish serious bacterial infections from self-limiting non-bacterial illnesses in children <5 years old presenting with a febrile illness to an Australian ED between July 2004 and June 2006. More than 40 clinical signs and symptoms that were routinely elicited in children with fever suspected of having a serious bacterial infection were considered for the diagnostic model. A total of 26 items were included in the final multinomial logistic regression model. The OR’s were calculated from data in the appendix, as only coefficients and SE’s were reported by Craig et al. The primary outcome was serious bacterial infection, defined as UTI, pneumonia or bacteraemia. A total of 14876 febrile illnesses involved one presentation to the ED, 44% was male. The prevalence of children with SBI was 7.2%, from which 3.4% with UTI, 3.4% with pneumonia, 0.4% with bacteraemia.
Results
The outcome presence of serious bacterial infection was defined differently in the included studies. Two studies (Craig, 2010; Williams-Smith, 2020) reported prognostic factors for urinary tract infection (UTI), three studies (Craig, 2010; Nijman, 2013; Nijman, 2018) reported prognostic factors for pneumonia and two studies (Nomura, 2019; Brent, 2011) reported prognostic factors for serious bacterial infection (SBI). Two studies (Nijman, 2013; Nijman, 2018) reported prognostic factors for other SBI, which was defined as UTI, septicemia, meningitis, orbital cellulitis, erysipelas, bacterial gastroenteritis, bacterial arthritis, bacterial upper airway infection, and bacterial osteomyelitis. In fact, the Nijman 2018 study can be considered as a prospective validation of the results of the Nijman 2013 study for the clinical factors. The multivariable odds ratios of the prognostic factors are shown in the tables below for the different outcome measures. The predictors with a statistically significant OR are colored green and the predictors being not statistically significant are colored red. The results could not be pooled due to the prognostic design, the use of different multivariate models and differences in populations studied.
1. Urinary Tract Infection (UTI)
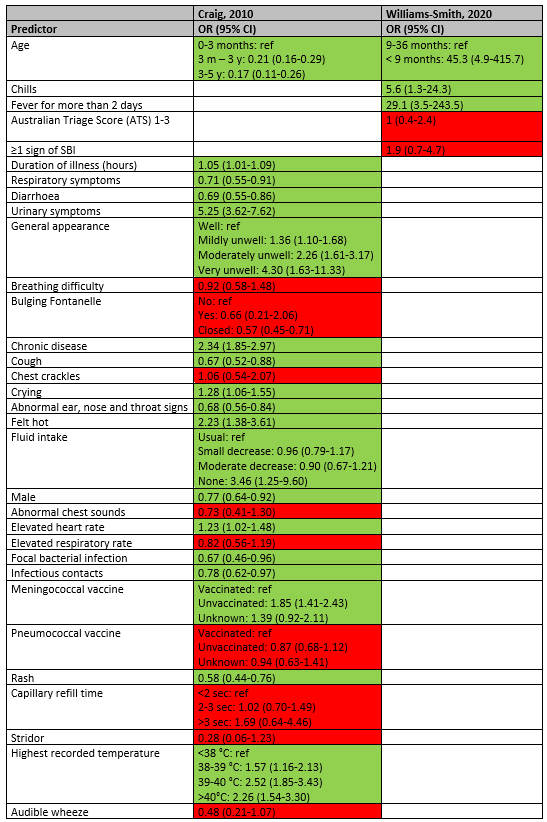
The overview of predictors for UTI is listed in table 1.
In the study of Craig (2010), the following statistically significant predictors were identified for the diagnosis of UTI (OR>1): longer duration of illness (OR 1.05; 95% CI 1.01-1.09), urinary symptoms (OR 5.25; 95% CI 3.62-7.62), general appearance (mildly unwell OR 1.36; 95% CI 1.10-1.68; moderately unwell OR 2.26; 95% CI 1.61-3.17; very unwell OR 4.30; 95% CI 1.63-11.33), having a chronic disease (OR 2.34; 95% CI 1.85-2.97), crying (OR 1.28; 95% CI 1.06-1.55), feeling hot (2.23; 95% CI 1.38-3.61), no fluid intake (OR 3.46; 95% CI 1.25-9.60), elevated heart rate (OR 1.23; 95% CI 1.02-1.48), unvaccinated for meningococcal (OR 1.85; 95% CI 1.41-2.43), and high recorded temperature (38-39 °C OR 1.57; 95% CI 1.16-2.13; 39-40 °C OR 2.52; 95% CI 1.85-3.43; >40°C OR 2.26; 95% CI 1.54-3.30).
In the study of Williams-Smith (2020), age < 9 months (OR 45.3; 95% CI 4.9-415.7), having chills (OR 5.6; 95% CI 1.3-24.3) and fever for more than 2 days (OR 29.1; 95% CI 3.5-243.5) were statistically significant predictors of UTI.
In the study of Craig (2010), the following predictors makes the diagnosis of UTI less likely (OR<1): higher age (3 months – 3 year OR 0.21; 95% CI 0.16-0.29; 3 – 5 year OR 0.17; 95% CI 0.11-0.26), having respiratory symptoms (OR 0.71; 95% CI 0.55-0.91), having diarrhoea (OR 0.69; 95% CI 0.55-0.86), cough (OR 0.67; 95% CI 0.52-0.88), abnormal ear, nose and throat signs (OR 0.68; 95% CI 0.56-0.84), being male (OR 0.77; 95% CI 0.64-0.92), focal bacterial infection (OR 0.67; 95% CI 0.46-0.96), infectious contacts (OR 0.78; 95% CI 0.62-0.97), and rash (OR 0.58; 95% CI 0.44-0.76).
Table 1. Overview of prognostic factors for UTI
2. Pneumonia
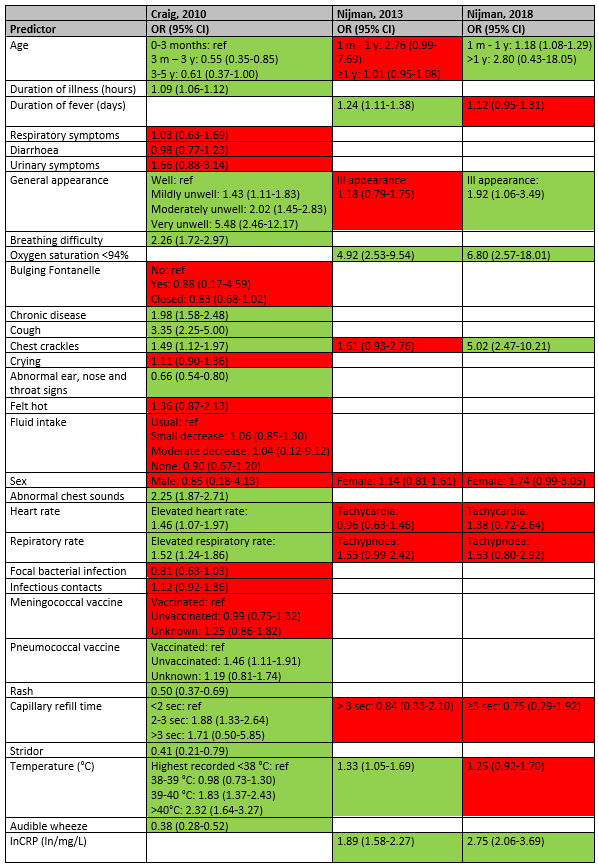
The overview of predictors for pneumonia is listed in table 2.
Duration of illness and fever were statistically significant predictors of pneumonia in the studies of Craig (OR 1.09; 95% CI 1.06-1.12) and Nijman 2013 (OR 1.24; 95% CI 1.11-1.38), but not in the study of Nijman 2018 (OR 1.12; 95% CI 0.95-1.31). General appearance was a statistically significant predictor for pneumonia in the study of Craig (mildly unwell OR 1.43; 95% CI 1.11-1.83; moderately unwell OR 2.02; 95% CI 1.45-2.83; very unwell OR 5.48; 95% CI 2.46-12.17) and the study of Nijman 2018 (ill appearance OR 1.92; 95% CI 1.06-3.49), but not in the study of Nijman 2013 (ill appearance OR 1.18; 95% CI 0.79-1.75). Breathing difficulty was a predictor in the study of Craig (OR 2.26; 95% CI 1.72-2.97) and oxygen saturation <94% was a statistically significant predictor in Nijman 2013 (OR 4.92; 95% CI 2.53-9.54) and Nijman 2018 (OR 6.80; 95% CI 2.57-18.01). Chest crackles was a statistically significant predictor in the study of Craig (OR 1.49; 95% CI 1.12-1.97) and Nijman 2018 (OR 5.02; 95% CI 2.47-10.21), but not in the study of Nijman 2013 (OR 1.61; 95% CI 0.93-2.76).
In the study of Craig (2010), chronic disease (OR 1.98; 95% CI 1.58-2.48), cough (OR 3.35; 95% CI 2.25-5.00), abnormal chest sounds (OR 2.25; 95% CI 1.87-2.71), being unvaccinated for pneumococcal (OR 1.46; 95% CI 1.33-2.64), 2-3 sec capillary refill time (Or 1.88; 95% CI 1.33-2.64) were statistically significant predictors of pneumonia. The factors abnormal ear, nose and throat signs (OR 0.66; 95% CI 0.54-0.80), rash (OR 0.50; 95% CI 0.37-0.69), stridor (OR 0.41; 95% CI 0.21-0.79) and audible wheeze (OR 0.38; 95% CI 0.28-0.52) makes the diagnosis of pneumonia less likely.
An elevated heart rate (OR 1.46; 95% CI 1.07-1.97) and elevated respiratory rate (OR 1.52; 95% CI 1.24-1.86) were statistically significant predictors of pneumonia in the study of Craig, but not in the studies of Nijman 2013 and Nijman 2018.
Higher body temperature was a statistically significant predictor in the studies of Craig (39-40°C OR 1.83; 95% CI 1.37-2.43; >40°C OR 2.32; 95% CI 1.64-3.27) and Nijman 2013 (OR 1.33; 95% CI 1.05-1.69), but not statistically significant in the study of Nijman 2018.
C-reactive protein was a statistically significant predictor of pneumonia in the studies of Nijman 2013 (OR 1.89;95% CI 1.58-2.27) and Nijman 2018 (OR 2.75; 95% CI 2.06-3.69).
Table 2. Overview of prognostic factors for pneumonia
3. Invasive bacterial infections (IBI)
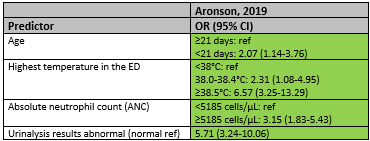
The overview of predictors for IBI is listed in table 3.
Only the results of Aronson (2019) are shown in table 3, because Hagedoorn (2021) did not report the 95% confidence interval for the odds ratio in the multivariate logistic model.
Aronson (2019) reported the statistically significant predictors for IBI only (table 4). These factors were: age < 21 days (OR .07; 95% CI 1.14-3.76), higher temperature in the emergency department (38.0-38.4°C OR 2.31; 95% CI 1.08-4.95; ≥38.5°C OR 6.57; 95% CI 3.25-13.29), higher absolute neutrophil count ≥5185 cells/µL (OR 3.15; 95% CI 1.83-5.43) and abnormal urinalysis results (OR 5.71; 95% CI 3.24-10.06).
Table 3. Overview of prognostic factors for IBI
4. Total serious bacterial infections (SBI)
The overview of predictors for total SBI is listed in table 4.
Higher body temperature was a statistically significant predictor of total SBI in the study of Nomura 2019 (≥38.5°C OR 2.80; 95% CI 1.37-5.74) but was not statistically significant in the study of Brent (OR 1.9; 95% CI 0.6-5.8). Hypoxia (OR 1.6; 95% CI 1.1-2.4), developmental delay (OR 5.4; 95% CI 1.6-18.6) and hydration status (OR 3.9; 95% CI 2.0-7.6) were statistically significant predictors of total SBI in the study of Brent (2011). However, the studies of Nomura (2019) and Brent (2011) did not account for the potential confounder age in their multivariate analyses, whereby these results should be interpreted with caution.
Table 4. Overview of prognostic factors for total SBI
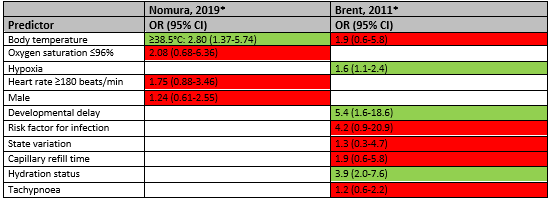
*Multivariate analysis not corrected for age
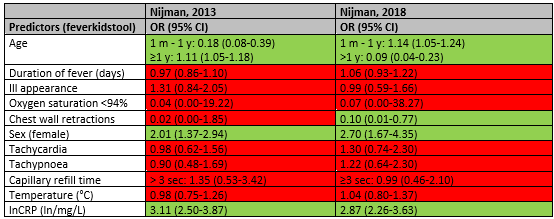
Nijman (2013, 2018) reported total SBI except pneumonia. The overview of predictors for SBI is listed in table 5.
Higher age (≥1 year) was a statistically significant predictor of SBI in the study of Nijman 2013 (OR 1.11; 95% CI 1.05-1.18) but makes the diagnosis less likely in the study of Nijman 2018 (OR 0.04; 95% CI 0.04-0.23). Female sex was a statistically significant predictor of SBI in both studies (Nijman 2013 OR 2.01; 95% CI 1.37-2.94; Nijman 2018 Or 2.70; 95% CI 1.67-4.35). C-reactive protein was also statistically significant predictor of SBI in the studies of Nijman 2013 (OR 3.11;95% CI 2.50-3.87) and Nijman 2018 (OR 2.87; 95% CI 2.26-3.63).
Having chest wall contractions makes the diagnosis of SBI less likely in the study of Nijman 2018 (OR 0.10; 95% CI 0.01-0.77).
Table 5. Overview of prognostic factors for SBI (except pneumonia)
Level of evidence of the literature
The level of evidence regarding the outcome measure UTI was downgraded by two levels because of imprecision (-2, large number of prognostic factors included in the model and limited number of patients) to Low GRADE.
The level of evidence regarding the outcome measure pneumonia was downgraded by two levels because of imprecision (-2, large number of prognostic factors included in the model and limited number of patients) to Low GRADE.
The level of evidence regarding the outcome measure IBI was downgraded by three levels because of study limitations (-2, risk of bias: case-control design whereby case cohort differed from control cohort, prognostic factors were not independent from outcome) and imprecision (limited number of patients) to Very low GRADE.
The level of evidence regarding the outcome measure total SBI in children aged 1 month to 16 years old was downgraded by three levels because of study limitations (-1, risk of bias: no correction for possible confounder age) and imprecision (-2, large number of prognostic factors included in the model and limited number of patients) to Very low GRADE.
The level of evidence regarding the outcome measure total SBI in children <5 year was downgraded by two levels because of imprecision (-2, large number of prognostic factors included in the model and limited number of patients) to Low GRADE.
Summary of literature
2. Clinical prediction models
Description of studies
De Vos-Kerkhof (2015) performed a randomized controlled trial aiming to assess the clinical impact of the implementation of a clinical decision model (Nijman, 2013, model based on age, temperature, sex, duration fever, prolonged capillary refill, chest wall retractions, ill appearance, oxygen saturation, respiratory rate, heart rate, and C-reactive protein) for febrile children at risk for serious bacterial infections (SBI) attending the emergency department (ED). They included 439 consecutive pediatric patients (≥1 month to <16 years) presenting with fever at the ED, from the first of September 2010 until June 30, 2012. Fever was defined as fever noted at home in the 24 hours prior to presentation, body temperature ≥38.5°C measured at the ED, or use of fever as a positive discriminator of the Manchester Triage System. Well-appearing febrile children with a clear focus of uncomplicated rhinitis or otitis, severely ill children, children with chronic co-morbidities, and children who reattended the ED within one week of their first presentation were excluded. The primary outcome measure was correctly diagnosed SBI.
Results
Randomized controlled trials (RCTs)
Serious bacterial infections (SBI)
In the RCT by de Vos-Kerkhof (2015), the accuracy of the clinical prediction model was similar to the accuracy of clinical judgement. In the intervention group, 42 children underwent chest-radiography, 25 (60%) of which were diagnosed with pneumonia. Similarly, in the control group, 28 children underwent chest radiography, 16 (57%) of which were diagnosed with pneumonia. Thus, for pneumonia, chest radiography based on the clinical prediction model had a sensitivity of 0.89 (95% CI 0.69–0.97) and a specificity of 0.88 (95% CI 0.82–0.91). Chest radiography based on clinicians’ judgement had a sensitivity of 0.86 (95% CI 0.60–0.96) and a specificity of 0.92 (95% CI 0.88–0.95). For SBI other than pneumonia, the clinical prediction model had a sensitivity of 1.0 (95% CI 0.61–1.0) and a specificity of 0.94 (95% CI 0.90–0.97). Clinicians’ judgement had a sensitivity of 0.89 (95% CI 0.57–0.98) and a specificity of 0.96 (95% CI 0.92–0.98). There were no significant differences in rate of hospitalization, length of stay, or revisits, however the study was underpowered to detect such differences. The authors concluded that although the clinical prediction model performed well, its implementation had no substantial impact on patient outcomes.
Level of evidence of the literature
The level of evidence regarding the outcome measure SBI was downgraded by one level because of imprecision (low number of events); Moderate GRADE.
Observational studies
The included prediction models and information about the development and validation cohorts of the models are shown in table 1 in the appendix (Table 1. Included models and predictor variables). The validation studies are summarized here. A total of 11 decision models (Mahabee, 2005; van de Bruel, 2007; Neuman, 2011; Lynch, 2004; Oostenbrink, 2013; Craig, 2010; Irwin, 2017; Bachur and Harper, 2001; Thompson, 2009; Bleeker, 2007; Brent, 2011) were cross validated at external datasets, but not at the level of broad prospective validation (Reilly, 2006), and two decision models (Mintegi, 2014 and Galetto-Lacour, 2010) were prospectively broad validated. The decision model of Nijman has been prospectively cross validated, evaluated at the level of narrow impact analysis for ‘other- SBI’ (De Vos-Kerkhof, 2015), and at the level of broad impact analysis for ‘pneumonia’ (Van de Maat, 2020). Most models predicted the diagnosis SBI vs absence of SBI, with SBI incorporating pneumonia, UTI as mainly prevalent diagnosis in the derivation sets, and other SBI as sepsis, meningitis in lower frequency. Craig (2010) developed specific models for UTI, pneumonia, other SBI vs absence of SBI. Nijman predicted pneumonia, other SBI (with 50% being UTI cases in the derivation set).
Van de Maat (2019) aimed to evaluate the performance of eight clinical prediction models for childhood pneumonia (Mahabee, 2005; van de Bruel, 2007; Neuman, 2011; Lynch, 2004; Oostenbrink, 2013; Craig, 2010; Nijman, 2013; and Irwin, 2017). They used two prospectively collected cohorts to evaluate the performance of the prediction models; cohort 1 included children aged between 1 month and 5 years who presented with fever and cough or dyspnea at the emergency department at the Erasmus MC—Sophia, Rotterdam, the Netherlands 2012-2013 (n=248); cohort 2 included children aged between 3 months and 5 years who presented with fever and respiratory symptoms at a pediatric assessment unit at the University Hospitals Coventry and Warwickshire NHS Trust, United Kingdom 2005-2006 (n=301). The reference standard for definite or probable pneumonia was defined as a bacterial syndrome with matching pathogenic bacteria detected (definite bacterial infection), or bacterial syndrome and CRP>60 mg/l (probable bacterial infection). The prevalence of definite or probable pneumonia was 7% in cohort 1 and 12% in cohort 2.
De Vos-Kerkhof (2018) aimed to evaluate the performance of eight clinical prediction models for serious bacterial infections (dichotomous models: Bachur and Harper, 2001; Van den Bruel, 2007; Galetto-Lacour, 2010; Thompson, 2009. Continuous models: Bleeker, 2007; Brent, 2011; Craig, 2010; Nijman, 2013). They used four prospectively collected cohorts to evaluate the performance of the prediction models. Cohort 1 included all children under 3 months of age who presented with fever at the emergency departments of the Erasmus MC-Sophia Children’s Hospital or the Maasstad Hospital Rotterdam, the Netherlands, 2009-2012 (n=159, prevalence of SBI 15%, with 4/24 pneumonia, 17/24 UTI and 3/24 other SBI), excluding children with chronic comorbidities. Cohort 2 came from the same study, but included included all children >3–12 months of age (n=766, prevalence of SBI 10%, with 16/75 pnemonia, 40/75 UTI and 19/75 other SBI). Cohort 3 included children younger than 3 months presenting with fever without source at the Paediatric Emergency Department of Cruces University Hospital in Bilbao, Spain, between 2003 and 2012 (n=2148, prevalence of SBI 16%, with 4/353 pneumonia, 303/353 UTI and 46/353 other SBI). Cohort 4 included children between 7 and 91 days without major comorbidities who presented with fever at one of 15 pediatric emergency departments in France from October 2008 through March 2011 (n=2204, prevalence of SBI 17%, with 45/381 pneumonia, 319/381 UTI and 17/381 other SBI). The outcome serious bacterial infection included pneumonia, meningitis, septicaemia, urinary tract infections, erysipelas, cellulitis, bacterial gastroenteritis, orbital cellulitis, bacterial upper respiratory infection, ethmoiditis, septic arthritis or osteomyelitis. All diagnoses were confirmed with bacteriological cultures, or nodular infiltrates or consolidations in the lung on chest radiographs.
Aronson (2018) aimed to evaluate the performance of the Rochester criteria and the modified Philadelphia criteria for the risk of invasive bacterial infections (IBI) using data from a case-control study. Data was collected in the emergency departments of nine children’s hospitals between July 2011 and June 2016. Cases (n=135; 118 bacteremia and 17 meningitis cases) were children ≤60 days with IBI who were identified through query of each hospital’s microbiology laboratory database or electronic medical record system for blood (bacteremia) and/or CSF (bacterial meningitis) cultures with growth of a pathogen. Children with a rectal temperature ≥38°C, documented not ill appearing and without complex condition were included. Each case patient was matched to 2 control children (n=249) at the same hospital with the closest date of visit to the case patient. Ten cases and 41 controls were excluded because of missing data. IBI was defined by growth of a pathogen in blood (bacteremia) and/or cerebrospinal fluid (bacterial meningitis). Because of the study design the prevalence of IBI could not be estimated.
Gomez (2016) aimed to evaluate and compare the Step-by-step approach (developed by the authors. Mintegi, 2014), the Rochester criteria (ref), and the Lab-score (Lacour, 2008), three clinical prediction models for the risk of invasive bacterial infections (IBI). They used a prospectively collected multicenter cohort, including infants ≤90 days old who presented with fever without source to one of eight Spanish, two Italian or one Swiss pediatric emergency department between September 2012 and august 2014 (n=2185, prevalence of IBI 3.9% with 36/87 sepsis/meningitis, 25/87 bacteremic UTI, 24/87 occult bacteremia). IBI was defined as isolation of bacterial pathogen (staphylococcus epidermidis, propionibacterium acnes, streptococcus viridans, or diphtheroides) in blood or cerebrospinal fluid culture. In addition, they distinghuished non-invasive bacterial infections (19.1%, of whom 409/417 UTI).
Verbakel (2013) aimed to evaluate four clinical prediction rules (5-stage Decision Tree, Pneumonia Rule, Meningitis Rule, and Yale Observation Scale cutoff >8 and cutoff >10) and two national guidelines (NICE guideline, and NHG alarm symptoms) for SBI. SBI was defined as sepsis (including bacteremia), meningitis, pneumonia, osteomyelitis, cellulitis, or complicated urinary tract infection. They used seven patient cohorts for as validation cohorts. Three of the cohorts (Roukema, 2008; Bleeker, 2007; Monteny, 2008) were relevant for this guideline since they included children with fever without a source. The Roukema (2008) cohort included all children presenting to a Dutch emergency department with fever (>38°), without meningeal irritation, chronic comorbidities, or immunodeficiency (n=1750, mean age 2.9 years, age range 0.1 to 15.7 years). The Bleeker (2007) cohort included children presenting to a Dutch emergency department with fever (>38°) without focus, without chronic comorbidities or immunodeficiency (n=595, mean age 0.9 years, age range 0.0 to 3.0 years). The Monteny (2008) cohort included children presenting to a Dutch general practitioner with fever, if there was no language barrier (n=506, mean age 2.2 years, age range 0.3 to 5.9 years).
Results
De Vos-Kerkhof (2018) reported the outcome UTI, van de Maat (2019) and de Vos-Kerkhof reported the outcome pneumonia, Gomez (2016) and Aronson (2016) reported the outcome IBI, de Vos-Kerkhof (2018) and Verbakel (2013) reported the outcome SBI. De Vos-Kerkhof (2013) also reported the outcomes SBI other than pneumonia and bacteremia separately. It should be noted, however, that for most cohorts, the majority of SBI other than pneumonia include UTI.
1. Urinary Tract Infection (UTI)
In the study by de Vos-Kerkhof (2018), the clinical prediction model by Craig (2010) had an AUC of 0.47 (95% CI 0.44-0.51) for predicting UTI in a cohort of children under 3 months, meaning that it made a correct prediction in 47% of the children.
Table 7. Continuous models, outcome UTI
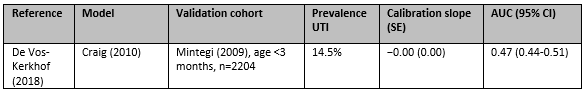
UTI, urinary tract infection; SE, standard error; AUC, area under the curve; CI, confidence interval
2. Pneumonia
In the study by de Vos-Kerkhof (2018), the clinical prediction model by Craig (2010) was validated in a French cohort of children under 3 months and had an AUC of 0.74 (95% CI 0.67-0.82) for predicting pneumonia, meaning that it made a correct prediction in 74% of the children. The clinical prediction model by Nijman (2012) was validated in three different cohorts of children with AUCs ranging from 0.72 to 0.89.
In the study by van de Maat (2019), the performance of the clinical prediction models was reported graphically, but not in confusion matrices. The performance of the clinical prediction models evaluated by van de Maat (2019) could therefore not be compared with the performance of clinical prediction models evaluated by de Vos-Kerkhof (2018).
Table 8. Dichotomous models, outcome pneumonia (per cohort)
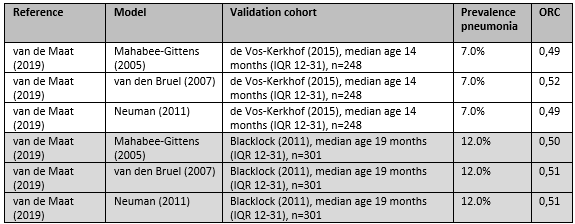
IQR, interquartile range; ORC, ordinal c-statistic or concordance statistic
Table 9. Continuous models, outcome pneumonia (per cohort)
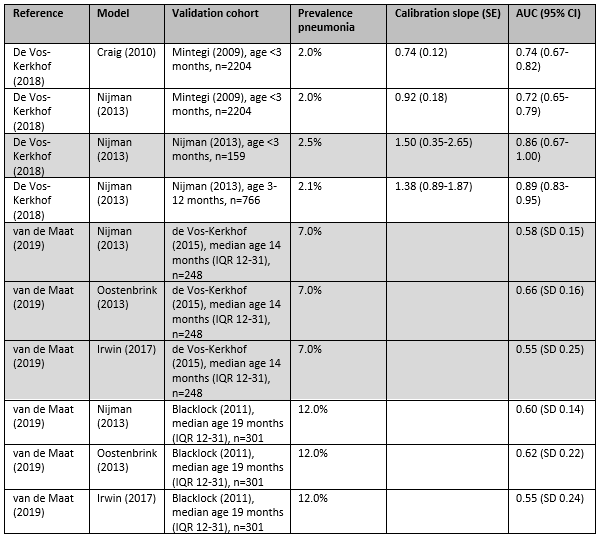
IQR, interquartile range; AUC, area under the curve; CI, confidence interval
3. Invasive bacterial infections (IBI)
In the study by Gomez (2016), the clinical prediction models the Lab-score, Step-by-step, and the Rochester criteria were evaluated. All three models had significant positive and negative likelihood ratios. The Lab-score had the highest positive likelihood ratio (3.74), and the highest post-test probability following a positive test (13%), meaning that children with a positive Lab-score had probability of 13% for having IBI, as compared with a probability of 4% in the whole population. Step-by-step had the lowest negative likelihood ratio (0.17) and the lowest post-test probability following a negative test (1%), meaning that children with a negative Step-by-step-score had probability of 1% for having IBI, as compared with a probability of 4% in the whole population. Gomez (2016) concluded that their own Step-by-Step was the most sensitive of the three evaluated models (Step-by-step, Lab-score, Rochester criteria). However, the specificity and overall performance of the Lab-score was better.
In the case-control study by Aronson (2016), the sensitivity and specificity of the Rochester criteria and the modified Philadelphia criteria were evaluated. In children younger than 60 days, the Rochester criteria had a sensitivity of 82% and a specificity of 45%, the modified Philadelphia criteria had a sensitivity of 92% and a specificity of 35%. Aronson (2016) concludes that their findings support the use of the modified Philadelphia criteria in febrile children between 29 and 60 days who do not receive routine CSF testing.
Table 10. Dichotomous models, outcome IBI (per cohort)
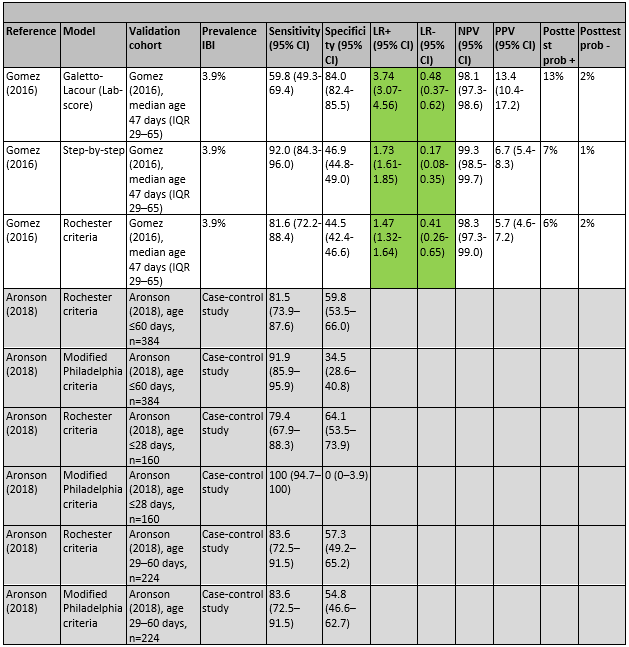
IBI, invasive bacterial infection; CI, confidence interval; LR+, positive likelihood ratio; LR-, negative likelihood ratio; Posttest prob +, post-test probability of IBI with a positive test result; Posttest prob -, post-test probability of IBI with a negative test result
4. Total serious bacterial infections (SBI)
De Vos-Kerkhof (2018) and Verbakel (2013) evaluated the performance of six clinical prediction rules for SBI and two national guidelines. The prediction rules of Bachur and Harper and the Lab-score had significant positive and negative likelihood ratios in all four validation cohorts. Positive likelihood ratios for Bachur and Harper ranged from 3.68 to 4.65, negative likelihood ratios ranged from 0.08 to 0.47. Positive likelihood ratios for Galetto-Lacour ranged from 7.02 to 17.59, and negative likelihood ratios ranged from 0.33 to 0.55.
In the Milcent (2009) cohort, a positive Lab score had the highest post-test probability (78%), and a negative Bachur and Harper score had the lowest post-test probability (2%). In the Mintegi (2009) cohort, a positive Lab score had the highest post-test probability (72%), and a negative Lab-score the lowest post-test probability (8%). In the Nijman (2013) cohort of children under 3 months, a positive Lab score had the highest post-test probability (62%), and a negative Bachur and Harper score had the lowest post-test probability (6%). In the Nijman (2013) cohort of children between 3 and 12 months, a positive Lab score had the highest post-test probability (43%), and a negative Bachur and Harper score had the lowest post-test probability (2%). In the Monteny (2008) cohort, a Yale Observation Scale score >10 had the highest post-test probability (12%), and a negative score on the 5-stage Decision Tree or the Pneumonia rule had the lowest post-test probability (both 1%).
De Vos-Kerkhof (2018) concludes that the best overall performance was achieved with the Bachur and Harper, Galetto-Lacour, Bleeker, and Nijman models, all including different combinations of clinical signs and symptoms, urine dipstick analysis and laboratory markers. Verbakel (2013) concludes that none of the evaluated prediction rules were valuable for high prevalence settings.
Table 11. Dichotomous models, outcome SBI (per cohort)
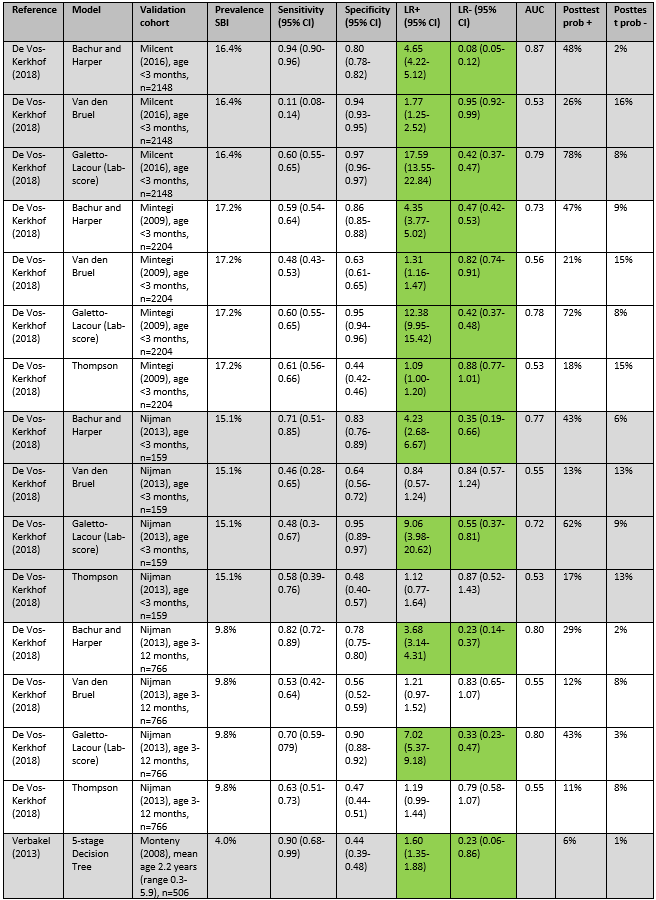
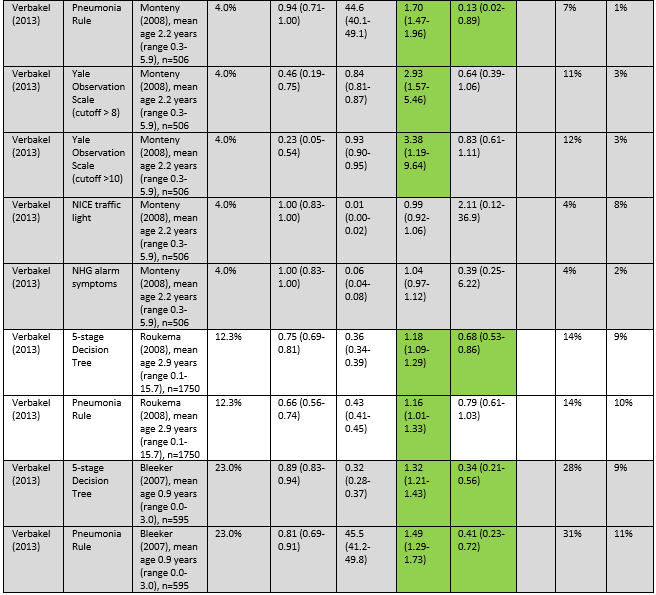
IBI, invasive bacterial infection; CI, confidence interval; LR+, positive likelihood ratio; LR-, negative likelihood ratio; AUC, area under the curve; Posttest prob +, post-test probability of IBI with a positive test result; Posttest prob -, post-test probability of IBI with a negative test result
Of the continuous models evaluated by de Vos-Kerkhof (2018), Bleeker (2007) had the highest AUC, ranging from 0.80 to 0.94.
Table 12. Continuous models, outcome SBI (per cohort)
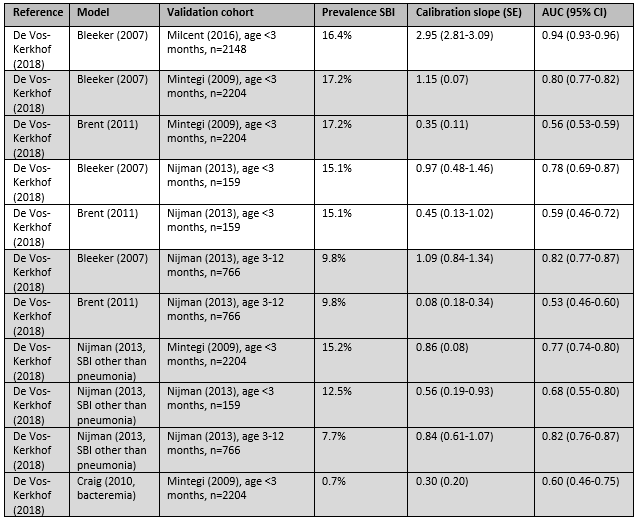
SBI, serious bacterial infection; SE, standard error; AUC, area under the curve; CI, confidence interval
Level of evidence of the literature
The level of evidence regarding the outcome measure UTI was downgraded by two levels because of indirectness (no comparison with other models) to Low GRADE.
The level of evidence regarding the outcome measure pneumonia was downgraded by two levels because of high risk of bias (low number of events) to Low GRADE.
The level of evidence regarding the outcome measure IBI was downgraded by two levels because of high risk of bias (low number of events) to Low GRADE.
The level of evidence regarding the outcome measure total SBI was downgraded by one level because of indirectness (no comparison with other models) to Moderate GRADE.
Zoeken en selecteren
A systematic review of the literature was performed to answer the following questions:
1. Which prognostic/diagnostic factors are associated with a higher risk on the presence of a serious bacterial infection (meningitis, sepsis, urinary tract infection, pneumonia) in children (0-16 years old) with fever?
P: Children (0-16 years) with fever in secondary care
I: Prognostic/diagnostic factors: anamnesis and symptoms during physical examination
C: Absence of prognostic/diagnostic factors
O: Presence of serious bacterial infection (meningitis, sepsis, urinary tract infection, pneumonia)
2. What is the best prediction model to predict the risk of serious bacterial infections in children (0-16 years old) with a fever in the emergency department?
P: Children (0-16 years) with fever in secondary care
I: Prediction model A
C: Prediction model B
O: Presence of serious bacterial infection (meningitis, sepsis, urinary tract infection, pneumonia)
Relevant outcome measures
The guideline development group considered presence of serious bacterial infection as a critical outcome measure for decision making, defined as meningitis, sepsis, urinary tract infection or pneumonia.
The working group defined age as a possible confounder, for which must be corrected in the included studies.
A priori, no minimal clinically (patient) important difference was defined.
For this prognostic clinical question, the aim is to investigate multiple factors that may predict presence of serious bacterial infection in children with fever. To investigate whether factors are predictive, a longitudinal relation between candidate prognostic factors (measured at T0) and outcome (measured at T1) has to be investigated. Often, prognostic factors are correlated with other factors, and as a result, their individual associations with
outcomes may be potentially misleading (Foroutan, 2020). To describe the effect of single prognostic factors, these should be measured in relation to its confounders. Mostly, important confounders can be predefined. Only multivariable analyses, including all predefined confounders and independent prognostic factors, can be taken into account.
Search and select (Methods)
A combined search was performed for the present module and the module about prediction models. The databases Medline (via OVID) and Embase (via Embase.com) were searched with relevant search terms until 1 December 2020. The detailed search strategy is depicted under the tab Methods. The systematic literature search resulted in 923 hits. Studies were selected based on the following criteria: systematic reviews, randomized controlled trials, and observational studies after 2010 about how children (0-16 year) with a serious bacterial infection (defined as meningitis, sepsis, urinary tract infection or pneumonia), presenting with fever on the SEH, could be recognised, using a multivariate analysis of prognostic factors. For this module, 51 studies were initially selected based on title and abstract screening. After reading the full text, 43 studies were excluded (see the table with reasons for exclusion under the tab Methods), and 8 studies were included.
Results
1. Prognostic factors
Eight studies were included in the analysis of the literature for the first clinical question. Two studies (Nomura, 2019; Brent, 2011) reported multivariate analyses of factors predicting serious bacterial infection (SBI). These studies did not adjust for the possible confounder age in the multivariate analysis. The outcome SBI was reported differently in the included studies, six studies reported for example pneumonia, UTI, IBI or ‘other SBI’. Important study characteristics and results are summarized in the evidence tables. The assessment of the risk of bias is summarized in the risk of bias tables.
2. Clinical prediction models
Six studies were included in the analysis of the literature for the second clinical question. Important study characteristics and results are summarized in the evidence tables. The assessment of the risk of bias is summarized in the risk of bias tables. Five further studies, comparing the accuracy of several clinical prediction models, are also described but not graded.
Referenties
- Aronson, P. L., Wang, M. E., Shapiro, E. D., Shah, S. S., DePorre, A. G., McCulloh, R. J., ... & Neuman, M. I. (2018). Risk stratification of febrile infants≤ 60 days old without routine lumbar puncture. Pediatrics, 142(6).
- Brent, A. J., Lakhanpaul, M., Thompson, M., Collier, J., Ray, S., Ninis, N., ... & MacFaul, R. (2011). Risk score to stratify children with suspected serious bacterial infection: observational cohort study. Archives of disease in childhood, 96(4), 361-367.
- Craig, J. C., Williams, G. J., Jones, M., Codarini, M., Macaskill, P., Hayen, A., Irwig, L., Fitzgerald, D. A., Isaacs, D., & McCaskill, M. (2010). The accuracy of clinical symptoms and signs for the diagnosis of serious bacterial infection in young febrile children: prospective cohort study of 15 781 febrile illnesses. BMJ (Clinical research ed.), 340, c1594.
- Davis, J., & Lehman, E. (2019). Fever characteristics and risk of serious bacterial infection in febrile infants. The Journal of emergency medicine, 57(3), 306-313.
- de Vos-Kerkhof, E., Nijman, R. G., Vergouwe, Y., Polinder, S., Steyerberg, E. W., van der Lei, J., Moll, H., & Oostenbrink, R. (2015). Ernstige infecties bij kinderen met koorts op de SEH: bruikbaarheid en implementatie van een klinisch beslismodel [Impact of a clinical decision model for febrile children at risk for serious bacterial infections at the emergency department: a randomized controlled trial]. Nederlands tijdschrift voor geneeskunde, 159, A9552.
- de Vos-Kerkhof, E., Gomez, B., Milcent, K., Steyerberg, E. W., Nijman, R. G., Smit, F. J., ... & Oostenbrink, R. (2018). Clinical prediction models for young febrile infants at the emergency department: an international validation study. Archives of disease in childhood, 103(11), 1033-1041.
- Foroutan, F., Guyatt, G., Zuk, V., Vandvik, P.O., Alba, A.C., e.a. (2020). GRADE Guidelines 28: Use of GRADE for the assessment of evidence about prognostic factors: rating certainty in identification of groups of patients with different absolute risks. Journal of Clinical Epidemiology 121, 62-70.
- Fuijkschot, J., Vernhout, B., Lemson, J., Draaisma, J. M., & Loeffen, J. L. (2015). Validation of a Paediatric Early Warning Score: first results and implications of usage. European journal of pediatrics, 174(1), 15-21.
- Galetto-Lacour, A., Zamora, S. A., Andreola, B., Bressan, S., Lacroix, L., Da Dalt, L., & Gervaix, A. (2010). Validation of a laboratory risk index score for the identification of severe bacterial infection in children with fever without source. Archives of disease in childhood, 95(12), 968-973.
- Gomez, B., Mintegi, S., Bressan, S., Da Dalt, L., Gervaix, A., & Lacroix, L. (2016). Validation of the "step-by-step" approach in the management of young febrile infants. Pediatrics, 138(2).
- Hagedoorn, N. N., Borensztajn, D., Nijman, R. G., Nieboer, D., Herberg, J. A., Balode, A., von Both, U., Carrol, E., Eleftheriou, I., Emonts, M., van der Flier, M., de Groot, R., Kohlmaier, B., Lim, E., Maconochie, I., Martinón-Torres, F., Pokorn, M., Strle, F., Tsolia, M., Zavadska, D., Moll, H. A. (2021). Development and validation of a prediction model for invasive bacterial infections in febrile children at European Emergency Departments: MOFICHE, a prospective observational study. Archives of disease in childhood, 106(7), 641-647.
- Kerkhof, E., Lakhanpaul, M., Ray, S., Verbakel, J. Y., Van den Bruel, A., Thompson, M., ... & European Research Network on recognising serious InfEctions (ERNIE) members. (2014). The predictive value of the NICE red traffic lights in acutely ill children. PLoS One, 9(3), e90847.
- Kuppermann, N., Dayan, P. S., Levine, D. A., Vitale, M., Tzimenatos, L., Tunik, M. G., Saunders, M., Ruddy, R. M., Roosevelt, G., Rogers, A. J., Powell, E. C., Nigrovic, L. E., Muenzer, J., Linakis, J. G., Grisanti, K., Jaffe, D. M., Hoyle, J. D., Jr, Greenberg, R., Gattu, R., Cruz, A. T., Febrile Infant Working Group of the Pediatric Emergency Care Applied Research Network (PECARN) (2019). A Clinical Prediction Rule to Identify Febrile Infants 60 Days and Younger at Low Risk for Serious Bacterial Infections. JAMA pediatrics, 173(4), 342-351.
- Mintegi, S., Bressan, S., Gomez, B., Da Dalt, L., Blázquez, D., Olaciregui, I., de la Torre, M., Palacios, M., Berlese, P., & Benito, J. (2014). Accuracy of a sequential approach to identify young febrile infants at low risk for invasive bacterial infection. Emergency medicine journal : EMJ, 31(e1), e19-e24.
- Nomura, O., Ihara, T., Sakakibara, H., Hirokoshi, Y., & Inoue, N. (2019). Predicting serious bacterial infection in febrile young infants utilizing body temperature. Pediatrics International, 61(5), 449-452.
- Nijman, R. G., Vergouwe, Y., Thompson, M., van Veen, M., van Meurs, A. H., van der Lei, J., Steyerberg, E. W., Moll, H. A., & Oostenbrink, R. (2013). Clinical prediction model to aid emergency doctors managing febrile children at risk of serious bacterial infections: diagnostic study. BMJ (Clinical research ed.), 346, f1706.
- Nijman, R. G., Vergouwe, Y., Moll, H. A., Smit, F. J., Weerkamp, F., Steyerberg, E. W., van der Lei, J., de Rijke, Y. B., & Oostenbrink, R. (2018). Validation of the Feverkidstool and procalcitonin for detecting serious bacterial infections in febrile children. Pediatric research, 83(2), 466-476.
- Reilly, B. M., & Evans, A. T. (2006). Translating clinical research into clinical practice: impact of using prediction rules to make decisions. Annals of internal medicine, 144(3), 201-209.
- Van De Maat, J., Nieboer, D., Thompson, M., Lakhanpaul, M., Moll, H., & Oostenbrink, R. (2019). Can clinical prediction models assess antibiotic need in childhood pneumonia? A validation study in paediatric emergency care. PloS one, 14(6), e0217570.
- Van de Maat, J. S., Peeters, D., Nieboer, D., van Wermeskerken, A. M., Smit, F. J., Noordzij, J. G., ... & Oostenbrink, R. (2020). Evaluation of a clinical decision rule to guide antibiotic prescription in children with suspected lower respiratory tract infection in the Netherlands: a stepped-wedge cluster randomised trial. PLoS medicine, 17(1), e1003034.
- Verbakel, J. Y., Van den Bruel, A., Thompson, M., Stevens, R., Aertgeerts, B., Oostenbrink, R., ... & Buntinx, F. (2013). How well do clinical prediction rules perform in identifying serious infections in acutely ill children across an international network of ambulatory care datasets?. BMC medicine, 11(1), 1-11.
- Williams-Smith, J. A., Fougère, Y., Pauchard, J. Y., Asner, S., Gehri, M., & Crisinel, P. A. (2020). Risk factors for urinary tract infections in children aged 0-36months presenting with fever without source and evaluated for risk of serious bacterial infections. Archives e pediatrie : organe officiel de la Societe francaise de pediatrie, 27(7), 372-379.
Evidence tabellen
Pre-defined core set of confounders:
1. Age
|
Study reference |
Study characteristics |
Patient characteristics |
Prognostic factor(s) |
Follow-up
|
Estimates of prognostic effect |
Comments |
|
Williams-Smith, 2020 |
Type of study: prospective cohort study
Setting and country: ED of tertiary care hospital in Switzerland
Funding and conflicts of interest: non-commercial, no conflicts of interest |
Inclusion criteria: 0–36 months old with fever without source (≥38°C), who were evaluated in emergency department between October 2015 and October 2017; fever duration less than 10 days.
Exclusion criteria: diagnosis of SBI had already been made, ongoing antibiotic treatment, difficulties communicating due to language problems
N=173
Median age (IQR): 4.4 (2.1-11) months
Sex: 54% M / 46% F
Potential confounders or effect modifiers:
|
|
Duration or endpoint of follow-up: 10 days after being enrolled in the study
For how many participants were no complete outcome data available? 0
|
Predictors of UTI (multivariate analysis)
OR 45.3; 95% CI 4.9-415.7); P 0.001
OR 5.6; 95% CI 1.3-24.3); P 0.02
OR 29.1; 95% CI 3.5-243.5); P 0.002
OR 1; 95% CI 0.4-2.4); P 0.9
OR 1.9; 95% CI 0.7-4.7); P 0.2 |
|
|
Hagedoorn, 2020 |
Type of study: prospective observational study
Setting and country: 12 ED’s in 8 European countries (Austria, Germany, Greece, Latvia, the Netherlands, Spain, Slovenia, UK)
Funding and conflicts of interest: non-commercial, no conflicts of interest |
Inclusion criteria: Children aged from 0 to 18 years with temperature ≥38.0°C or fever <72 hours before ED visit; patients with CRP measurement
Exclusion criteria: patients with working diagnosis of urinary tract infections after first assessment at the ED
N=16133
Median age (IQR) IBI: 3.2 (0.8-6.0) Non-IBI: 2.8 (1.4-6.0)
Sex: IBI: 44% M / 56% F Non-IBI: 45% M / 55% F
Potential confounders or effect modifiers:
|
|
Duration or endpoint of follow-up: not reported
For how many participants were no complete outcome data available? 0
|
Predictors of IBI*
|
*95% CI of multivariate model not reported |
|
Nomura, 2019 |
Type of study: retrospective observational study
Setting and country: ED of 1 tertiary care hospital in Japan
Funding and conflicts of interest: no conflict of interest, funding not reported |
Inclusion criteria: age <90 days, visiting the ED with axillary temperature ≥38.0°C at triage
Exclusion criteria: none
N=269
Mean age ± SD: 55.4 ± 21.7 days
Sex: 59% M / 41% F
Potential confounders or effect modifiers:
|
|
Duration or endpoint of follow-up: not reported
For how many participants were no complete outcome data available? N (%): 6 (2.2%)
Reasons for incomplete outcome data described? Yes, insufficient data. |
OR 2.80; 95% CI 1.37-5.74; P 0.005
OR 2.08; 95% CI 0.68-6.36; P 0.199
OR 1.75; 95% CI 0.88-3.46; P 0.110
OR 1.24; 95% CI 0.61-2.55; P 0.554
|
No adjustments for potential confounder age. No statistically significant difference in age and sex between groups with and without SBI. |
|
Aronson, 2019 |
Type of study: case-control study
Setting and country: ED’s of 11 children’s hospitals in USA
Funding and conflicts of interest: non-commercial, no conflict of interest |
Inclusion criteria: age≤60 days, presenting to a participating hospital’s ED either from home or from an outpatient clinic; febrile (rectal temperature ≥38.0°C at home, in an outpatient clinic, or in the ED; (2) not ill appearing, as documented on the ED physical examination; without a complex chronic condition.
Exclusion criteria: Ill-appearing infants and those with complex chronic conditions
N=181 with IBI, N=362 control
Median age (IQR): IBI patients: 28 (16-43) days Non-IBI: 35.5 (23-47) days
Sex: IBI patients: 56% M/ 44% F Non-IBI: 55% M / 45% F
Potential confounders or effect modifiers:
|
|
Duration or endpoint of follow-up: not reported
For how many participants were no complete outcome data available? N (%): not reported
Reasons for incomplete outcome data described? NA |
OR 2.07; 95% CI 1.14-3.76
38.0-38.4°C: OR 2.31; 95% CI 1.08-4.95 ≥38.5°C: 6.57; 95% CI 3.25-13.29
OR 5.71; 95% CI 3.24-10.06
OR 3.15; 95% CI 1.83-5.43 |
|
|
Nijman, 2018 |
Type of study: prospective observational study
Setting and country: 2 emergency departments, the Netherlands
Funding and conflicts of interest: non-commercial, no conflicts of interest |
Inclusion criteria: children aged 1 month to 16 years old with fever (body temperature ≥38.5 °C at triage, fever recorded at home within 24 h before consultation, fever as reason for referral by the general practitioner, or fever as positive discriminator in the Manchester Triage System).
Exclusion criteria: Children with an underlying chronic condition requiring specialist pediatric follow-up that is expected to last for at least 1 year; Well-appearing febrile children with a clear focus of an upper airway infection not undergoing additional investigations
N=1085
Median age (IQR): 1.6 (0.8-3.4) years
Sex: Pneumonia: 47% M / 53% F Other SBI: 48% M / 62% F
Potential confounders or effect modifiers: Pneumonie: 73 (7%) Other SBI: 98 (9%)
|
|
Duration or endpoint of follow-up: 72h
For how many participants were no complete outcome data available? N (%): 0
Reasons for incomplete outcome data described? NA |
Predictors of pneumonia
OR 1.18; 95% CI 1.08-1.29
OR 2.80; 95% CI 0.43-18.05
OR 1.74; 95% CI 0.99-3.05
OR 1.12; 95% CI 0.95-1.31
OR 1.25; 95% CI 0.92-1.70
OR 1.53; 95% CI 0.80-2.92
OR 1.38; 95% CI 0.72-2.64
OR 6.80; 95% CI 2.57-18.01
OR 0.75; 95% CI 0.29-1.92
OR 5.02; 95% CI 2.47-10.21
OR 1.92; 95% CI 1.06-3.49
OR 2.75; 95% CI 2.06-3.69
Predictors of other SBI
OR 1.14; 95% CI 1.05-1.24
OR 0.09; 95% CI 0.04-0.23
OR 2.70; 95% CI 1.67-4.35
OR 1.06; 95% CI 0.93-1.22
OR 1.04; 95% CI 0.80-1.37
OR 1.22; 95% CI 0.64-2.30
OR 1.30; 95% CI 0.74-2.30
OR 0.07; 95% CI 0.00-38.27
OR 0.99; 95% CI 0.46-2.10
OR 0.10; 95% CI 0.01-0.77
OR 0.99; 95% CI 0.59-1.66
OR 2.87; 95% CI 2.26-3.63
|
|
|
Nijman, 2013 |
Type of study: Prospective observational diagnostic study
Setting and country: Three paediatric emergency care units, The Netherlands (N=2), UK (N=1)
Funding and conflicts of interest: no funding, no conflicts of interest |
Inclusion criteria: children aged 1 month to 15 years old, presenting with fever at the emergency department of the Erasmus MC-Sophia children’s hospital, Rotterdam (2003-05; if fever had been noted at home in the 24 hours before presentation or body temperature measured in the ED was ≥38.0°C), and the Haga-Juliana children’s hospital, the Hague (2007; if their temperature when measured rectally in the ED was ≥38.0°C.),
Exclusion criteria: children with chronic comorbidity (for example, malignancies, cystic fibrosis, severe psychomotor retardation) and those who received antibiotics in the week before the EDt visit.
N=967
Median age (IQR): Erasmus MC-Sophia: 1.8 (0.9-3.7) Haga-Juliana: 1.5 (0.7-3.2)
Sex: % M / % F Erasmus MC-Sophia: 57% M / 43% F Haga-Juliana: 55% M / 45% F
Potential confounders or effect modifiers:
Serious bacterial infection: Erasmus MC-Sophia: 13% Haga-Juliana: 12%
|
|
Duration or endpoint of follow-up: 1 week
For how many participants were no complete outcome data available? N (%): not reported
Reasons for incomplete outcome data described? |
Predictors of pneumonia
OR 2.76; 95% CI 0.99-7.69
OR 1.01; 95% CI 0.95-1.08
OR 1.14; 95% CI 0.81-1.61
OR 1.24; 95% CI 1.11-1.38)
OR 1.33; 95% CI 1.05-1.69
OR 1.55; 95% CI 0.99-2.42
OR 0.96; 95% CI 0.63-1.46
OR 4.92; 95% CI 2.53-9.54
OR 0.84; 95% CI 0.33-2.10
OR 1.61; 95% CI 0.93-2.76
OR 1.18; 95% CI 0.79-1.75
OR 1.89; 95% CI 1.58-2.27
OR 0.81; 95% CI 0.73-0.88
Predictors of other SBI
OR 0.18; 95% CI 0.08-0.39
OR 1.11; 95% CI 1.05-1.18
OR 2.01; 95% CI 1.37-2.94
OR 0.97; 95% CI 0.86-1.10
OR 0.98; 95% CI 0.75-1.26
OR 0.90; 95% CI 0.48-1.69
OR 0.98; 95% CI 0.62-1.56
OR 0.04; 95% CI 0.00-19.22
OR 1.35; 95% CI 0.53-3.42
OR 0.02; 95% CI 0.00-1.85
OR 1.31; 95% CI 0.84-2.05
OR 3.11; 95% CI 2.50-3.87
OR 0.86; 95% CI 0.79-0.92 |
|
|
Brent, 2011 |
Type of study: prospective observational cohort study
Setting and country: Emergency Department, UK
Funding and conflicts of interest: Wellcome Trust research training fellowship, no conflicts of interest |
Inclusion criteria: all children presenting to the Queen’s Medical Centre Emergency Department in Nottingham between September 2000 and March 2001, and September 2001 and March 2002; differential diagnosis at presentation included acute infection.
Exclusion criteria: neonates and children requiring immediate emergency resuscitation at presentation; data were insufficient to confidently assign outcome, or who had missing dates of birth.
N=1951
Median age (range): 19 months (1 month – 15 years)
Sex: 55.4% M / 44.6% F
Potential confounders or effect modifiers: 564 (28%) admitted at first presentation from which 72 (13%) had SBI.
|
|
Duration or endpoint of follow-up: not reported
For how many participants were no complete outcome data available? N (%): 0, only those with complete data were included in the analysis
Reasons for incomplete outcome data described? NA |
Final model with factors included associated with SBI in univariate analysis)*
OR 5.4; 95% CI 1.6-18.6; P 0.008
OR 4.2; 95% CI 0.9-20.9; P 0.077
OR 1.3; 95% CI 0.3-4.7; P 0.728
OR 1.9; 95% CI 0.6-5.8; P 0.243
OR 1.9; 95% CI 0.6-5.8; P 0.243
OR 39; 95% CI 2.0-7.6; P <0.001
OR 1.2; 95% CI 0.6-2.2; P 0.585
OR 1.6; 95% CI 1.1-2.4; P 0.026
|
*No adjustments for potential confounders such as age. |
|
Craig, 2010 |
Type of study: prospective cohort study
Setting and country: ED of tertiary university teaching hospital, Australia
Funding and conflicts of interest: non-commercial funding, no conflicts of interest |
Inclusion criteria: <5 years of age presenting to the ED of The Children’s Hospital at Westmead with a febrile illness (≥38°C) between 1 July 2004 and 30 June 2006/
Exclusion criteria: transferred from another hospital, children with cancer and transplant recipients.
N=14876
Age (months) <3: 4.7% 3-6: 5.9% 6-12: 19% 12-24: 30.8% >24: 39.6%
Sex: 44% M /56 % F
Potential confounders or effect modifiers:
|
40 clinical signs and symptomswere taken into account. The 26 items selected in the final multinomial logistic regression model have considerable clinical validity because many are intuitively important for diagnosis. |
Duration or endpoint of follow-up: 10-14 days
For how many participants were no complete outcome data available? N (%): 1114 (7.5%)
Reasons for incomplete outcome data described? Unable to contact |
Predictors of UTI, OR (95% CI)*
1.05 (1.01-1.09)
0.71 (0.55-0.91)
0.69 (0.55-0.86)
5.25 (3.62-7.62)
0.92 (0.58-1.48)
2.34 (1.85-2.97)
0.67 (0.52-0.88)
1.06 (0.54-2.07)
1.28 (1.06-1.55)
0.68 (0.56-0.84)
2.23 (1.38-3.61)
0.77 (0.64-0.92)
0.73 (0.41-1.30)
1.23 (1.02-1.48)
0.82 (0.56-1.19)
0.67 (0.46-0.96)
0.78 (0.62-0.97)
0.58 (0.44-0.76)
0.28 (0.06-1.23)
0.48 (0.21-1.07)
Predictors of pneumonia, OR (95% CI)*
1.09 (1.06-1.12)
1.03 (0.63-1.69)
0.98 (0.77-1.23)
1.66 (0.88-3.14)
2.26 (1.72-2.97)
1.98 (1.58-2.48)
3.35 (2.25-5.00)
1.49 (1.12-1.97)
1.11 (0.90-1.36)
0.66 (0.54-0.80)
1.36 (0.87-2.13)
0.85 (0.18-4.13)
2.25 (1.87-2.71)
1.46 (1.07-1.97)
1.52 (1.24-1.86)
0.81 (0.63-1.03)
1.12 (0.92-1.36)
0.50 (0.37-0.69)
0.41 (0.21-0.79)
0.38 (0.28-0.52) |
*Calculated from coefficients and SD in appendix |
Evidence table for intervention studies clinical question 2
|
Study reference |
Study characteristics |
Patient characteristics 2 |
Intervention (I) |
Comparison / control (C) 3
|
Follow-up |
Outcome measures and effect size 4 |
Comments |
|
De Vos Kerkhof, 2015 |
Type of study: RCT
Setting and country: pediatric ED of a Dutch university hospital
Funding and conflicts of interest: EK and RN: supported by ZonMW, and Erasmus University Medical Centre Rotterdam. RO: fellowship of the European Society of Pediatric Infectious Diseases. No funding bodies had any role in study design, data collection and analysis, decision to publish, or preparation of the manuscript.
The authors have declared that no competing interests exist. |
Inclusion criteria: - consecutive pediatric patients (age ≥1 month to <16 years) presenting with fever at the ED from the first of September 2010 until June 30, 2012 - fever noted at home in the 24 hours prior to presentation or - body temperature measured at the ED ≥38.5°C or fever was used as a positive discriminator of the Manchester Triage System
Exclusion criteria: - well appearing febrile children (no amber/red alarming signs) with a clear focus of uncomplicated rhinitis/otitis - severely ill children (emergent triage category) - chronic co-morbidity - children who reattended the ED within one week of their first presentation were only included at their initial visit.
N total at baseline: 439 Intervention: 219 Control: 220
Important prognostic factors2: Age in years (median, 25–75 percentiles): I: 2.0 (1.0–4.2) C: 1.7 (0.8–3.9)
Sex: I: 64% M C: 66% M
CRP (median, 25–75 percentiles): I: 12.0 (8.0–39.0) C: 13.0 (7.0–35.8)
Groups comparable at baseline? Yes
|
Implementation of a clinical decision model. The clinical decision model presented patient-specific risk estimates (percentages) for both pneumonia and other SBI, which were categorized in high- or low risk groups and consequently were accompanied by recommendations for further diagnostic testing. For high-risk children, nurses were instructed to initiate additional testing before physician’s assessment.
|
Usual care. Physician examined the patient and ordered diagnostic procedures according to their own judgment (aware of a CRP-value used for randomization) |
Length of follow-up: Length of stay, median 2 hours
Loss-to-follow-up: Intervention: N 0 (0%) Reasons (describe)
Control: N 0 (0%) Reasons (describe)
Incomplete outcome data: Intervention: N (%) Reasons (describe)
Control: N (%) Reasons (describe)
|
Outcome measures and effect size (include 95%CI and p-value if available):
Presence of serious infection (meningitis, sepsis, urinary tract infection, pneumonia)
Pneumonia In the intervention group, 42 children underwent chest-radiography, 25 (60%) of which were diagnosed with pneumonia. I: Sensitivity to detect pneumonia 0.89 (95% CI 0.69–0.97), specificity to detect pneumonia 0.88 (95% CI 0.82–0.91) In the control group, 28 children underwent chest radiography, 16 (57%) of which were diagnosed with pneumonia. C: Sensitivity to detect pneumonia 0.86 (95% CI 0.60–0.96), specificity to detect pneumonia 0.92 (95% CI 0.88–0.95)
Other SBI I: Sensitivity to detect other SBI 1.0 (95% CI 0.61–1.0), specificity to detect other SBI 0.94 (95% CI 0.90–0.97)
C: Sensitivity to detect other SBI 0.89 (95% CI 0.57–0.98), specificity to detect other SBI 0.96 (95% CI 0.92–0.98)
|
|
Notes:
- Prognostic balance between treatment groups is usually guaranteed in randomized studies, but non-randomized (observational) studies require matching of patients between treatment groups (case-control studies) or multivariate adjustment for prognostic factors (confounders) (cohort studies); the evidence table should contain sufficient details on these procedures
- Provide data per treatment group on the most important prognostic factors [(potential) confounders]
- For case-control studies, provide sufficient detail on the procedure used to match cases and controls
- For cohort studies, provide sufficient detail on the (multivariate) analyses used to adjust for (potential) confounders
|
Study reference |
Study characteristics |
Patient characteristics |
Candidate predictors |
Model development, performance and evaluation
|
Outcome measures and results |
Comments Interpretation of model |
|
Van de Maat, 2019 |
Validation cohort 1: Source of data1 and date: prospective cohort, 2012–2013
Setting/ number of centres and country: 1 ED, the Netherlands
Validation cohort 2: Source of data1 and date: prospective cohort 2005-2006
Setting/ number of centres and country: 1 paediatric assessment unit, UK
Funding and conflicts of interest:
The Netherlands Organisation for Health Research and Development (ZonMW, JM), the National Institute for Health Research (NIHR) Collaboration for Leadership in Applied Health Research and Care (CLAHRC) North Thames at Bart’s Health NHS Trust (ML).
The authors have declared that no conflicts of interest exist. |
Validation cohort 1: Recruitment method2: not reported
Inclusion criteria: children aged 1 month to 5 years presenting with fever and cough or dyspnoea
Exclusion criteria: children with comorbidity related to increased risk of bacterial infection or complications (e.g. severe neurological impairment, immunodeficiency, severe pulmonary or cardiac defects)
Treatment received? Usual care
Participants: N= 248
Median age (IQR): 14 (7–27) months
Sex: 60% M / 40% F
Other important characteristics:
Validation cohort 2: Recruitment method2: not reported
Inclusion criteria: children aged 3 months to 5 years presenting with fever and respiratory symptoms
Exclusion criteria: children with comorbidity related to increased risk of bacterial infection or complications (e.g. severe neurological impairment, immunodeficiency, severe pulmonary or cardiac defects)
Treatment received? Usual care
Participants: N= 301
Median age (IQR): 19 (12-31) months
Sex: 58% M / 42% F
Other important characteristics:
|
Seven prediction models relevant for this guideline were validated. All prediction models were previously developed and reported.
Mahabee, 2005 Describe candidate predictors3 and method and timing of measurement: ≥12 months; respiratory rate ≥50/min; oxygen saturation ≤96%; nasal flaring in age <12months.
Number of participants with any missing value4? N (%):
How were missing data handled5?
van de Bruel, 2007 Describe candidate predictors3 and method and timing of measurement: age, temperature, clinician’s instinct something is wrong, dyspnoea, diarrhoea.
Number of participants with any missing value4? N (%):
How were missing data handled5?
Neuman, 2011 Describe candidate predictors3 and method and timing of measurement: Oxygen saturation ≤92%, history of fever, wheezing, focal rales, chest pain, focal decreased breath sounds.
Number of participants with any missing value4? N (%):
How were missing data handled5?
Oostenbrink, 2013 Describe candidate predictors3 and method and timing of measurement: ill appearance, tachypnea, O2 <94%, CRP.
Number of participants with any missing value4? N (%):
How were missing data handled5?
Number of participants with any missing value4? N (%):
How were missing data handled5?
Nijman, 2013 Describe candidate predictors3 and method and timing of measurement: 11 demographic, patient history, physical examination, and additional testing predictors.
Number of participants with any missing value4? N (%):
How were missing data handled5?
Irwin, 2017 Describe candidate predictors3 and method and timing of measurement: CRP, respiratory rate, normal air entry, resistine, procalcitonin.
Number of participants with any missing value4? N (%):
How were missing data handled5? |
Development Modelling method6:
Performance Calibration measures7 and 95%CI:
Discrimination measures8 and 95%CI:
Classification measures9: Model performance reported in a figure, without exact numbers.
Validation cohort 1 Mahabee, 2005: ORC 0.49 Van de Bruel, 2007: ORC 0.52 Neuman, 2011: ORC 0.49 Oostenbrink, 2013: ORC 0.66 Nijman, 2013: ORC 0.58 Irwin, 2017: ORC 0.55
Validation cohort 2 Mahabee, 2005: ORC 0.50 Van de Bruel, 2007: ORC 0.51 Neuman, 2011: ORC 0.51 Oostenbrink, 2013: ORC 0.62 Nijman, 2013: ORC 0.60 Irwin, 2017: ORC 0.55
Evaluation Method for testing model performance10: external
|
Definite or probable bacterial pneumonia
Type of outcome: single
Definition and method for measurement of outcome: clinical diagnosis in combination with identification of pathogen and measurement of CRP
Endpoint or duration of follow-up:
Number of events/outcomes: Validation cohort 1: 18 of 248 (7%) Validation cohort 2: 37 of 301 (12%)
RESULTS Multivariable model11:
Alternative presentation of final model12: |
Interpretation: confirmatory
Comparison with other studies?
Generalizability? |
|
De Vos-Kerkhof, 2018 |
Validation cohort 1: Source of data1 and date: prospective cohort 2009–2012
Setting/ number of centres and country: 2 EDs, the Netherlands
Validation cohort 2: Source of data1 and date: prospective cohort 2009–2012
Setting/ number of centres and country: 2 EDs, the Netherlands
Validation cohort 3: Source of data1 and date: prospective cohort 2003–2012
Setting/ number of centres and country: ED, Spain
Validation cohort 4: Source of data1 and date: prospective cohort 2008-2011
Setting/ number of centres and country: 15 paediatric Eds, France
Funding and conflicts of interest: The authors have not declared a specific grant for this research from any funding agency in the public, commercial or not-for-profit sectors.
Authors declare no conflicts of interest. |
Validation cohort 1: Recruitment method2: consecutive
Inclusion criteria: - children aged <3 months presenting with fever at the ED
- fever noted at home in the 24 hours prior to presentation
- body temperature measured at the ED was ≥38.5°C or ‘fever’ was used as a positive discriminator of the Manchester Triage System.
Exclusion criteria: - chronic comorbidities
Treatment received? Usual care
Participants: N= 159
Median age (IQR): 2.0 (0.5–2.4) months
Sex: 62% M / 38% F
Other important characteristics:
Validation cohort 2: Recruitment method2: consecutive
Inclusion criteria: - children aged <3 months presenting with fever at the ED
- fever noted at home in the 24 hours prior to presentation
- body temperature measured at the ED was ≥38.5°C or ‘fever’ was used as a positive discriminator of the Manchester Triage System.
Exclusion criteria: - chronic comorbidities
Treatment received? Usual care
Participants: N= 766
Median age (IQR): 7.9 (6.0–9.6) months
Sex: 59% M / 41% F
Other important characteristics:
Validation cohort 3: Recruitment method2: consecutive
Inclusion criteria: infants younger than 3 months of age with fever without source seen in the ED
Exclusion criteria:
Treatment received? Usual care
Participants: N= 2148
Median age (IQR): 1.7 (1.2–2.4) months
Sex: 57% M / 43% F
Other important characteristics:
Validation cohort 4: Recruitment method2: consecutive
Inclusion criteria: - febrile children (≥38°C at home or on admission) - age between 7 and 91 days
Exclusion criteria: - major comorbidities
Treatment received? Usual care
Participants: N= 2204
Median age (IQR): 1.7 (1.2–2.4) months
Sex: 59% M / 41% F
Other important characteristics: |
Bachur and Harper, 2001 Describe candidate predictors3 and method and timing of measurement: age, temperature, positive urine analysis, white cell count.
Number of participants with any missing value4? N (%):
How were missing data handled5?
Van den Bruel, 2007 Describe candidate predictors3 and method and timing of measurement: age, temperature, clinician’s instinct something is wrong, dyspnoea, diarrhoea.
Number of participants with any missing value4? N (%):
How were missing data handled5?
Galetto-Lacour (Lab-score), 2010 Describe candidate predictors3 and method and timing of measurement: urine dipstick analysis, PCT, CRP.
Number of participants with any missing value4? N (%):
How were missing data handled5?
Thompson, 2009 Describe candidate predictors3 and method and timing of measurement: temperature, oxygen saturation, tachypnoea, tachycardia.
Number of participants with any missing value4? N (%):
How were missing data handled5?
Craig, 2010 Describe candidate predictors3 and method and timing of measurement: 26 demographic, patient history, physical examination, and disease characteristic predictors.
Number of participants with any missing value4? N (%):
How were missing data handled5?
|
Development Modelling method6:
Performance Calibration measures7 and 95%CI:
Discrimination measures8 and 95%CI:
Classification measures9: Validation cohort 1 Bachur and Harper, 2001: Van den Bruel, 2007 Galetto-Lacour (Lab-score), 2010 Thompson, 2009
Validation cohort 2 Bachur and Harper, 2001 Van den Bruel, 2007 Galetto-Lacour (Lab-score), 2010 Thompson, 2009
Validation cohort 3 Bachur and Harper, 2001 Van den Bruel, 2007 Galetto-Lacour (Lab-score), 2010 Thompson, 2009
Validation cohort 4 Bachur and Harper, 2001 Van den Bruel, 2007 Galetto-Lacour (Lab-score), 2010 Thompson, 2009 Craig, 2010: AUC UTI 0.47 (0.44-0.51)
Evaluation Method for testing model performance10: external
|
Type of outcome: single/combined?
Definition and method for measurement of outcome:
Endpoint or duration of follow-up:
Number of events/outcomes:
RESULTS Multivariable model11:
Alternative presentation of final model12: |
Interpretation: confirmatory, i.e. model useful for practice versus exploratory, i.e. more research needed.
Comparison with other studies?
Generalizability? |
|
Aronson, 2018 |
Source of data1 and date: case-control study conducted between July 1, 2011, and June 30, 2016
Setting/ number of centres and country: emergency departments in 11 US hospitals
Funding and conflicts of interest: Clinical and Translational Science Awards grants from the National Center for Advancing Translational Science, funding from the National Institutes of Health (NIH).
Dr Shapiro served as an expert witness in malpractice cases involving the evaluation of febrile children. No other potential conflicts of interest. |
Recruitment method2: consecutive cases and matched
Inclusion criteria: - age ≤60 days - rectal temperature ≥38°C - not ill appearing - cases: IBI - controls: no IBI
Exclusion criteria: - complex conditions - missing data
Treatment received? Usual care
Participants: Cases N=135 Controls N=249
Mean age ± SD: Cases: 50% ≤28 days, 50% 29-60 days Controls: 37% ≤28 days, 63% 29-60 days
Sex: Cases 55% M / 45% F Controls 59% M / 41% F
Other important characteristics: |
Rochester criteria Describe candidate predictors3 and method and timing of measurement: Previously healthy (Y/N); Well appearing (Y/N); Leukocyturia (Y/N); WBC count (≥5000 and ≤15 000); Absolute band count (≤1500 bands per μL).
Number of participants with any missing value4? N (%):
How were missing data handled5?
Modified Philadelphia criteria Describe candidate predictors3 and method and timing of measurement: Age >28 d (Y/N); Previously healthy (Y/N); Skin or soft tissue infection (Y/N); Normal uirinalysis (Y/N); Peripheral WBC count (≥5000 and ≤15 000); I/T ratio (<0.2d).
Number of participants with any missing value4? N (%):
How were missing data handled5? |
Development Modelling method6:
Performance Calibration measures7 and 95%CI:
Discrimination measures8 and 95%CI:
Classification measures9: Rochester criteria: sensitivity 81.5 (95% CI 73.9–87.6). specificity 59.8 (95% CI 53.5–66.0) Modified Philadelphia criteria sensitivity 91.9 (95% CI 85.9–95.9). specificity 34.5 (95% CI 28.6–40.8)
Evaluation Method for testing model performance10: external
|
Type of outcome: combined
Definition and method for measurement of outcome: IBI defined as a blood [bacteremia] and/or CSF [bacterial meningitis] culture with growth of a pathogen
Endpoint or duration of follow-up:
Number of events/outcomes:
RESULTS Multivariable model11:
Alternative presentation of final model12: |
Interpretation: confirmatory, i.e. model useful for practice versus exploratory, i.e. more research needed.
Comparison with other studies?
Generalizability? |
|
Gomez, 2016 |
Source of data1 and date: Prospective study, data collected in pediatric emergency departments between September 2012 and August 2014
Setting/ number of centres and country: 11 emergency departments located in Spain, Italy, and Switzerland
Funding and conflicts of interest: No external funding. The authors state no conflicts of interest |
Recruitment method2: consecutive
Inclusion criteria: infants ≤90 days old attending with FWS presenting between September 2012 and August 2014
Exclusion criteria: - Clear source of fever - No fever on arrival at ED, fever not confirmed by parents with thermometer - Absence of 1 or more of the mandatory ancillary tests (blood culture, urine culture collected by an aseptic technique, urine dipstick, PCT, CRP, or WBC count) - Refusal of the parents or caregiver to participate
Treatment received? Usual care
Participants: N=2185
Age in days, median (IQR), 47 (29–65)
Sex: 59.5% M / 40.5% F
Other important characteristics: |
Rochester criteria Describe candidate predictors3 and method and timing of measurement: Previously healthy (Y/N); Well appearing (Y/N); Leukocyturia (Y/N); WBC count (≥5000 and ≤15 000); Absolute band count (≤1500 bands per μL).
Number of participants with any missing value4? N (%):
How were missing data handled5?
Lab-score Describe candidate predictors3 and method and timing of measurement: Urine dipstick analysis; PCT; CRP.
Number of participants with any missing value4? N (%):
How were missing data handled5?
Step by step Describe candidate predictors3 and method and timing of measurement: Well-appearing (Y/N); >21 d old (Y/N); Leukocyturia (Y/N); PCT; CRP; ANC.
Number of participants with any missing value4? N (%):
How were missing data handled5? |
Development Modelling method6:
Performance Calibration measures7 and 95%CI:
Discrimination measures8 and 95%CI:
Classification measures9: Galetto-Lacour (Lab-score): sensitivity 59.8 (95% CI 49.3-69.4), specificity 84.0 (95% CI 82.4-85.5) Step-by-step: sensitivity 92.0 (95% CI 84.3-96.0), specificity 46.9 (95% CI 44.8-49.0) Rochester criteria: sensitivity 81.6 (95% CI 72.2-88.4), specificity 44.5 (95% CI 42.4-46.6)
Evaluation Method for testing model performance10: external
|
Type of outcome: combined. IBI defined as isolation of a bacterial pathogen in a blood or cerebrospinal fluid culture.
Definition and method for measurement of outcome:
Endpoint or duration of follow-up:
Number of events/outcomes:
RESULTS Multivariable model11:
Alternative presentation of final model12: |
Interpretation: confirmatory, i.e. model useful for practice versus exploratory, i.e. more research needed.
Comparison with other studies?
Generalizability? |
|
Verbakel, 2013 |
Source of data1 and date: three prospective cohorts, collection dates not reported
Setting/ number of centres and country: 3 centres in the Netherlands, two ED’s and one general practice
Funding and conflicts of interest: Funding by the Health Technology Assessment Project 07/37/05, the National Institute for Health Research National School for Primary Care Research, the Fonds Wetenschappelijk Onderzoek Vlaanderen
Authors declare they have no competing interests. |
Validation cohort 1 (Roukema, 2008): Recruitment method2: consecutive
Inclusion criteria: Children with fever at ED
Exclusion criteria: meningeal irritation, chronic disease, immunodeficiency
Treatment received? Usual care
Participants: N= 1750
Age in years, mean (range) 2.9 (0.1 to 15.7)
Sex: not reported
Other important characteristics:
Validation cohort 2 (Bleeker, 2007): Recruitment method2: unclear
Inclusion criteria: - Fever at ED - No clear focus identified after evaluation by pediatrician
Exclusion criteria: - Chronic disease - Immunodeficiency
Treatment received? Usual care
Participants: N= 595
Age in years, mean (range) 0.9 (0.0 to 3.0)
Sex: not reported
Other important characteristics:
Validation cohort 3 (Monteny, 2008): Recruitment method2: unclear
Inclusion criteria: - Age 3 months to 6 years - contacting a GP after hours - fever as the presenting symptom
Exclusion criteria: - Language barrier - Previously included (2 weeks)
Treatment received? Usual care
Participants: N= 506
Age in years, mean (range) 4.0 (2.3 to 5.7)
Sex: not reported
Other important characteristics:
|
5-stage decision tree Describe candidate predictors3 and method and timing of measurement: 1) clinical instinct that something is wrong, 2) dyspnea, 3) temperature greater than 39.5°C, 4) diarrhea, 5) age 15 to 29 months.
Number of participants with any missing value4? N (%):
How were missing data handled5?
Pneumonia rule Describe candidate predictors3 and method and timing of measurement: 1) shortness of breath, 2) clinicians concern
Number of participants with any missing value4? N (%):
How were missing data handled5?
Yale Observation Scale Describe candidate predictors3 and method and timing of measurement: Reaction to parents; state variation; color; hydration (normal 1point, moderate impairment 3 points, severe impairment 5 points).
Number of participants with any missing value4? N (%):
How were missing data handled5?
NICE guideline Describe candidate predictors3 and method and timing of measurement: Colour; Activity; Respiratory; Hydration; Other (fever for temp ≥5 days; swelling of a limb or joint; non-weightbearing limb/not using extremity; a new lump >2 cm; age 0-3 months, temp ≥38°C; age 3-6 months, temp ≥39°C; non-blanching rash; bulging fontanelle; neck stiffness; status epilepticus; focal neurological signs; focal seizures; bile-stained vomiting).
Number of participants with any missing value4? N (%):
How were missing data handled5?
NHG alarm symptoms Describe candidate predictors3 and method and timing of measurement: Seriously ill; Disturbed consciousness; Persistent vomiting; Petechiae; Tachypnoea or dyspnoea; Reduced peripheral circulation; Pallor or ashen or blue; Meningeal irritation.
Number of participants with any missing value4? N (%):
How were missing data handled5?
|
Development Modelling method6:
Performance Calibration measures7 and 95%CI:
Discrimination measures8 and 95%CI:
Classification measures9: Validation cohort 1 5-stage decision tree: sensitivity 0.75 (95% CI 0.69-0.81), specificity 0.36 (95% CI 0.34-0.39) Pneumonia rule: sensitivity 0.66 (95% CI 0.56-0.74), specificity 0.43 (95% CI 0.41-0.45) Yale Observation Scale: n/a NICE guideline: n/a NHG alarm symptoms: n/a
Validation cohort 2 5-stage decision tree: 0.89 (95% CI 0.83-0.94) 0.32 (95% CI 0.28-0.37) Pneumonia rule:0.81 (95% CI 0.69-0.91) 45.5 (95% CI 41.2-49.8) Yale Observation Scale: n/a NICE guideline: n/a NHG alarm symptoms: n/a
Validation cohort 3 5-stage decision tree: sensitivity 0.90 (95% CI 0.68-0.99), specificity 0.44 (95% CI 0.39-0.48) Pneumonia rule: sensitivity 0.94 (95% CI 0.71-1.00), specificity 44.6 (95% CI 40.1-49.1) Yale Observation Scale cutoff >8: sensitivity 0.94 (95% CI 0.71-1.00), specificity 44.6 (95% CI 40.1-49.1) NICE guideline: sensitivity 1.00 (95% CI 0.83-1.00), specificity 0.01 (95% CI 0.00-0.02) NHG alarm symptoms: sensitivity 1.00 (95% CI 0.83-1.00), specificity 0.06 (95% CI 0.04-0.08)
Evaluation Method for testing model performance10: internal/external
|
Type of outcome: combined
Definition and method for measurement of outcome: SBI defined as sepsis (including bacteremia), meningitis, pneumonia, osteomyelitis, cellulitis, and complicated urinary-tract infection (positive urine culture and systemic effects such as fever)
Endpoint or duration of follow-up:
Number of events/outcomes:
RESULTS Multivariable model11:
Alternative presentation of final model12: |
Interpretation: confirmatory, i.e. model useful for practice versus exploratory, i.e. more research needed.
Comparison with other studies?
Generalizability? |
1 Incremental predictive value is the predictive value beyond standard demographic factors and the established risk factors (e.g. smoking, blood pressure, lipid levels, diabetes, cancer stage, etc.), for example change in c-statistic
|
Study reference
(first author, year of publication) |
Study participation1
Study sample represents the population of interest on key characteristics?
(high/moderate/low risk of selection bias) |
Study Attrition2
Loss to follow-up not associated with key characteristics (i.e., the study data adequately represent the sample)?
(high/moderate/low risk of attrition bias) |
Prognostic factor measurement3
Was the PF of interest defined and adequately measured?
(high/moderate/low risk of measurement bias related to PF) |
Outcome measurement3
Was the outcome of interest defined and adequately measured?
(high/moderate/low risk of measurement bias related to outcome) |
Study confounding4
Important potential confounders are appropriately accounted for?
(high/moderate/low risk of bias due to confounding) |
Statistical Analysis and Reporting5
Statistical analysis appropriate for the design of the study?
(high/moderate/low risk of bias due to statistical analysis) |
|
Williams-Smith, 2020 |
Low |
Low |
Low |
Moderate (final diagnosis was not blinded from the results of the predictors) |
Low |
Low |
|
Hagedoorn, 2020 |
Low |
Moderate, number of missing values is not reported. Multiple imputation used for missing values for the covariates. |
Low |
Low |
Low |
High, no confidence intervals or p-value were reported for OR of predictors |
|
Nomura, 2019 |
Low |
Low |
Moderate, vital signs retrieved from patients’ medical chart (retrospective design) |
Low |
Moderate (not accounted for age) |
Low |
|
Aronson, 2019 |
High, case-control design used, whereby control patients were older, had a lower triage temperature and heart rate, had more URI syjptoms, less anormal urinalysis, lower WBC and ANC |
Moderate, number of missing values is not reported. |
Low |
Moderate, outcome IBI used as inclusion criteria |
Low |
Moderate, due to case-control design, predictors differed between populations |
|
Nijman, 2018 |
Low |
Moderate, number of missing values is not reported. Multiple imputation used for missing values for the covariates. |
Low |
Low |
Low |
Low |
|
Nijman, 2013 |
Low |
Moderate, number of missing values is not reported. Multiple imputation used for missing values for the covariates. |
Low |
Low |
Low |
Low |
|
Brent, 2011 |
Low |
Low, only those with complete data were included in the analysis |
Low |
Low |
Moderate (not accounted for age) |
Low |
|
Craig, 2010 |
Low |
Low |
Low |
Low |
Low |
Low |
1 Adequate description of: source population or population of interest, sampling and recruitment, period and place of recruitment, in- and exclusion criteria, study participation, baseline characteristics.
2 Adequate response rate, information on drop-outs and loss to follow-up, no differences between participants who completed the study and those lost to follow-up.
3 Method of measurement is valid, reliable, setting of measurement is the same for all participants.
Risk of bias table for intervention studies clinical question 2|
Study reference
(first author, publication year) |
Describe method of randomisation1 |
Bias due to inadequate concealment of allocation?2
(unlikely/likely/unclear) |
Bias due to inadequate blinding of participants to treatment allocation?3
(unlikely/likely/unclear) |
Bias due to inadequate blinding of care providers to treatment allocation?3
(unlikely/likely/unclear) |
Bias due to inadequate blinding of outcome assessors to treatment allocation?3
(unlikely/likely/unclear) |
Bias due to selective outcome reporting on basis of the results?4
(unlikely/likely/unclear) |
Bias due to loss to follow-up?5
(unlikely/likely/unclear) |
Bias due to violation of intention to treat analysis?6
(unlikely/likely/unclear) |
|
De Vos-Kerkhof, 2015 |
Randomization based on even/odd seconds indicated by the digital computer clock at the time of completing input in the clinical decision model |
Unlikely (method unknown to nurses and physicians) |
Unlikely |
Unclear |
Unlikely |
Unlikely |
Unlikely |
Unlikely |
- Randomisation: generation of allocation sequences have to be unpredictable, for example computer generated random-numbers or drawing lots or envelopes. Examples of inadequate procedures are generation of allocation sequences by alternation, according to case record number, date of birth or date of admission.
- Allocation concealment: refers to the protection (blinding) of the randomisation process. Concealment of allocation sequences is adequate if patients and enrolling investigators cannot foresee assignment, for example central randomisation (performed at a site remote from trial location) or sequentially numbered, sealed, opaque envelopes. Inadequate procedures are all procedures based on inadequate randomisation procedures or open allocation schedules..
- Blinding: neither the patient nor the care provider (attending physician) knows which patient is getting the special treatment. Blinding is sometimes impossible, for example when comparing surgical with non-surgical treatments. The outcome assessor records the study results. Blinding of those assessing outcomes prevents that the knowledge of patient assignement influences the proces of outcome assessment (detection or information bias). If a study has hard (objective) outcome measures, like death, blinding of outcome assessment is not necessary. If a study has “soft” (subjective) outcome measures, like the assessment of an X-ray, blinding of outcome assessment is necessary.
- Results of all predefined outcome measures should be reported; if the protocol is available, then outcomes in the protocol and published report can be compared; if not, then outcomes listed in the methods section of an article can be compared with those whose results are reported.
- If the percentage of patients lost to follow-up is large, or differs between treatment groups, or the reasons for loss to follow-up differ between treatment groups, bias is likely. If the number of patients lost to follow-up, or the reasons why, are not reported, the risk of bias is unclear
- Participants included in the analysis are exactly those who were randomized into the trial. If the numbers randomized into each intervention group are not clearly reported, the risk of bias is unclear; an ITT analysis implies that (a) participants are kept in the intervention groups to which they were randomized, regardless of the intervention they actually received, (b) outcome data are measured on all participants, and (c) all randomized participants are included in the analysis.
(The criteria used in this checklist are based on PROBASTA version 15/05/2019)
|
Study reference (first author, year of publication)
Classification1 |
Participant selection 1) Appropriate data sources?2 2) Appropriate in- and exclusion?
Risk of bias: low/high/unclear |
Predictors 1) Assessed similar for all participants? 2) Assessed without knowledge of outcome? 3) Available at time the model is intended to be used?
Risk of bias: low/high/unclear |
Outcome 1) Pre-specified or standard outcome definition? 2) Predictors excluded from definition? 3) Assessed similar for all participants? 4) Assessed without knowledge of predictors? 5) Time interval between predictor and outcome measurement appropriate?
Risk of bias: low/high/unclear |
Analysis 1) Reasonable number of participants with event/outcome? 2) All enrolled participants included in analysis? 3) Missing data handled appropriately? 4) No selection of predictors based on univariate analysis? 5) Relevant model performance measures evaluated appropriately?3 6) Accounted for model overfitting4 and optimism? 7) Predictors and weights correspond to results from multivariate analysis? Risk of bias: low/high/unclear |
Overall judgment
High risk of bias: at least one domain judged to be at high risk of bias.
Model development only: high risk of bias.
Risk of bias: low/high/unclear |
|
Van de Maat, 2019
External validation of models |
1) LOW (cohort studies) 2) LOW (comorbidity related to increased risk of bacterial infection or complications were excluded)
Domain LOW |
1) LOW 2) LOW 3) LOW
Domain LOW |
1) LOW 2) HIGH (CRP included as predictor and in definition in all models) 3) LOW 4) UNCLEAR 5) LOW
Domain LOW |
1) HIGH (18 and 37 cases, respectively) 2) LOW 3) LOW 4) n/a 5) n/a 6) n/a 7) n/a Domain HIGH |
HIGH |
|
De Vos-Kerkhof, 2018
External validation of models |
1) LOW 2) LOW
Domain LOW |
1) LOW 2) LOW 3) LOW
Domain LOW |
1) LOW 2) LOW 3) LOW 4) UNCLEAR 5) LOW
Domain LOW |
1) SBI: LOW, UTI & pneumonia: HIGH (SBI ok in 2 of the cohorts, pneumonia and UTI too few) 2) LOW 3) LOW 4) n/a 5) n/a 6) n/a 7) n/a Domain LOW |
LOW |
|
Aronson, 2018
External validation of models |
1) LOW 2) LOW
Domain LOW |
1) LOW 2) LOW 3) LOW
Domain LOW |
1) LOW 2) LOW 3) LOW 4) 5)
Domain |
1) LOW 2) LOW 3) LOW 4) n/a 5) n/a 6) n/a 7) n/a Domain |
LOW |
|
Gomez, 2016
External validation of models |
1) LOW 2) LOW
Domain LOW |
1) LOW 2) LOW 3) LOW
Domain LOW |
1) LOW 2) LOW 3) LOW 4) UNCLEAR 5) LOW
Domain LOW |
1) HIGH (87 cases of IBI) 2) LOW 3) LOW 4) n/a 5) n/a 6) n/a 7) n/a Domain HIGH |
HIGH |
|
Verbakel, 2013
External validation of models |
1) LOW 2) LOW
Domain LOW |
1) LOW 2) LOW 3) LOW
Domain LOW |
1) LOW 2) LOW 3) LOW 4) UNCLEAR 5) LOW
Domain LOW |
1) LOW (although HIGH in Monteny cohort) 2) LOW 3) LOW 4) n/a 5) n/a 6) n/a 7) n/a Domain LOW |
LOW |
A Wolff RF, Moons KGM, Riley RD, Whiting PF, Westwood M, Collins GS, Reitsma JB, Kleijnen J, Mallett S; PROBAST Group. PROBAST: A Tool to Assess the Risk of Bias and Applicability of Prediction Model Studies. Ann Intern Med. 20191;170(1):51-58. doi: 10.7326/M18-1376. PubMed PMID: 30596875.
1 Development of model only / Development and external validation of model / External validation of model
2 Cohort, RCT or nested case-control study
3 E.g. calibration (total O:E ratio; expected outcome probabilities versus observed outcome frequencies) and discrimination (range 0.5 (no discriminative ability) to 1.0 (perfect discriminative ability)
4 Overfitting: for low ORs the predicted probability is too low, for high ORs the predicted probability is too high. Correcting is possible with shrinkage.
Table of excluded studies
|
Author and year |
Reason for exclusion |
|
Tsai, 2020 |
Wrong I: only lab values of blood culture as predictors |
|
Velasco, 2020 |
Wrong design: predictive value of separate factors in multivariate model not reported |
|
Gomes, 2020 |
Wrong design: predictive value of separate factors in multivariate model not reported |
|
Klouda, 2020 |
Wrong study design (association between combination of Rochester Risk model/cough and bacterial infection) |
|
Sawaya, 2020 |
Wrong outcome: being on antibiotics |
|
Davis, 2019 |
Wrong design: Only univariate unadjusted analyses performed, infants < 8 weeks old |
|
Bachur, 2019 |
Wrong study design (comparison of 3 models for assessing relation between respiratory rate and temperature and pneumonia) --> UV3 |
|
Yao, 2019 |
Wrong design: predictive value of separate factors in multivariate model not reported |
|
Kuppermann, 2019 |
Wrong design: predictive value of separate factors in multivariate model not reported |
|
Hirsch, 2019 |
Wrong outcome: radiographic pneumonia |
|
Lee, 2019 |
Wrong study design (comparison of severity of clinical manifestations between SBI and non-SBI; AUC of ROC curve not adjusted) |
|
Chong, 2018 |
Wrong design: comparison of serious infection and non-serious infection using t-test and Fisher's exact test (no regression analysis) |
|
Balamuth, 2017 |
Wrong outcome and population: comparison of two methods of identifying sepsis |
|
Nigrovic, 2017 |
Wrong design: predictive value of YOS score (no predictive value of separate factors reported) |
|
Irwin, 2017 |
Wrong design: only results of univariate logistic regression analysis of predictive factors reported in appendix |
|
Díaz, 2016 |
Wrong population (only 11 patients with diagnosed bacteremia) and wrong study design (PCT/CRP as predictors) |
|
Irwin, 2016 |
Wrong design: systematic review (no separate prognostic values) |
|
Balamuth, 2015 |
Wrong population: fever or hypothermia or chief complaint of fever were included |
|
De, 2015 |
Wrong outcome: AUC for temperature as a marker of SBI |
|
Verbakel, 2015 |
Wrong P: acutely ill children |
|
De Vos-Kerkhof, 2015 |
Wrong design: predictive value of separate factors not reported |
|
Kerkhof, 2014 |
Wrong P: children with acute illness |
|
De, 2013 |
Wrong design: predictive value of separate factors for NICE traffic light system not reported |
|
Spruijt, 2013 |
Wrong study design: development of 7 models for age-specific thresholds of heart and respiratory rates (association of separate factors not reported, also not in appendix) |
|
Nijman, 2012 |
Wrong study design (develop thresholds for respiratory rate and body temperature) and wrong outcome (lower respiratory tract infection). |
|
Thompson, 2012 |
Wrong design: systematic review (no separate prognostic values) |
|
Brent, 2011 |
Wrong population: subset of sample with fever (whole sample 35-38.5) |
|
Suffoletto, 2011 |
Wrong population (adults >18 years). Only univariate unadjusted analyses performed |
|
Zarkesh, 2011 |
Wrong design: Rochester criteria, predictive value of separate factors not reported |
|
Nijman, 2011 |
Wrong design: predictive value of separate factors not reported |
|
Bin Salleeh, 2010 |
Wrong study design: duration of fever association with positive bag urinanalyses |
|
Simon, 2010 |
Wrong outcome (bacterial pneumonia) and association between prognostic factor (oxygen saturation) and outcome not reported |
|
Olaciregui, 2009 |
Wrong study design (discrimination ability of PCT, CRP and leucocyte count for SBI and non-SBI) |
|
Karacan, 2007 |
Wrong O: streptococcal pharyngitits |
|
Bleeker, 2007 |
<2010 |
|
Nigrovic, 2007 |
<2010 |
|
Berezin, 2006 |
Wrong outcome (occult bacteremia) and study design (association between temperature and bacteremia, no adjustments) |
|
Trautner, 2006 |
Wrong design: no adjusted multivariate analysis. O: bacterial or viral illness |
|
Al-Majali, 2004 |
Wrong population (only 8 patients with bacterial infection) and wrong study design (WBC/ANC as predictors) |
|
Gorelick, 2003 |
<2010 |
|
Bleeker, 2001 |
Ouder artikel van Bleeker 2007 |
|
Bachur, 2001 |
Wrong design: predictive value of separate factors of Rochester criteria, Philidelphia criteria and Boston criteria not reported |
|
Gorelick, 2000 |
<2010 |
|
Isaacman, 2000 |
<2010 |
Verantwoording
Beoordelingsdatum en geldigheid
Publicatiedatum : 02-07-2024
Beoordeeld op geldigheid : 13-03-2024
Algemene gegevens
De ontwikkeling/herziening van deze richtlijnmodule werd ondersteund door het Kennisinstituut van de Federatie Medisch Specialisten (www.demedischspecialist.nl/kennisinstituut) en werd gefinancierd uit de Kwaliteitsgelden Medisch Specialisten (SKMS). De financier heeft geen enkele invloed gehad op de inhoud van de richtlijnmodule.
Samenstelling werkgroep
Voor het ontwikkelen van de richtlijnmodule is in 2020 een multidisciplinaire werkgroep ingesteld, bestaande uit vertegenwoordigers van alle relevante specialismen (zie hiervoor de Samenstelling van de werkgroep) die betrokken zijn bij de zorg voor kinderen met koorts op de Spoedeisende Hulp.
Werkgroep
- Dr. R. (Rianne) Oostenbrink, kinderarts, werkzaam in het ErasmusMC te Rotterdam, NVK (voorzitter)
- Dr. E.P. (Emmeline) Buddingh, kinderarts- infectioloog/immunoloog, werkzaam in het LUMC te Leiden, NVK
- Drs. J. (Joël) Israëls, kinderarts/pulmonoloog, werkzaam in het LUMC te Leiden, NVK
- Dr. A.E. (Anna) Westra, algemeen kinderarts, werkzaam in het Flevoziekenhuis te Almere, NVK
- Drs. E.P.M. (Erika) van Elzakker, arts-microbioloog, werkzaam in het Amsterdam UMC te Amsterdam, NVMM
- Dr. M.R.A. (Matthijs) Welkers, arts-microbioloog, werkzaam in het Amsterdam UMC te Amsterdam, NVMM, vanaf 25-04-2022
- Dr. C.R.B. (Christian) Ramakers, laboratoriumspecialist Klinische Chemie, werkzaam in het ErasmusMC te Rotterdam, NVKC
- Dr. G. (Jorgos) Alexandridis, spoedeisende hulp-arts, werkzaam in het Franciscus Gasthuis & Vlietland te Rotterdam, NVSHA
- Drs. K.M.A. (Karlijn) Meys, kinderradioloog, werkzaam in het UMC Utrecht te Utrecht, NVvR
- Dr. E (Eefje) de Bont, Huisarts, NHG
- I.J.M. (Ingrid) Vonk, verpleegkundig specialist, werkzaam in het Maasstad ziekenhuis te Rotterdam, V&VN
Klankbordgroep
- R. (Rowy) Uitzinger, junior projectmanager en beleidsmedewerker, Stichting Kind en Ziekenhuis, tot 01-06-2022
- E. (Esen) Doganer, junior projectmanager en beleidsmedewerker, Stichting Kind en Ziekenhuis, vanaf 01-06-2022
- Dr. A. (Annelies) Riezebos-Brilman, arts-microbioloog, werkzaam in het UMC Utrecht te Utrecht, NVMM, tot 25-04-2022
Met ondersteuning van:
- Dr. J. (Janneke) Hoogervorst – Schilp, adviseur, Kennisinstituut van de Federatie Medisch Specialisten
- Dr. M. (Mattias) Göthlin, adviseur, Kennisinstituut van de Federatie Medisch Specialisten
- Dr. T. (Tim) Christen, adviseur, Kennisinstituut van de Federatie Medisch Specialisten
- M. (Miriam) van der Maten, MSc, junior medisch informatiespecialist, Kennisinstituut van de Federatie Medisch Specialisten
Belangenverklaringen
De Code ter voorkoming van oneigenlijke beïnvloeding door belangenverstrengeling is gevolgd. Alle werkgroepleden hebben schriftelijk verklaard of zij in de laatste drie jaar directe financiële belangen (betrekking bij een commercieel bedrijf, persoonlijke financiële belangen, onderzoeksfinanciering) of indirecte belangen (persoonlijke relaties, reputatiemanagement) hebben gehad. Gedurende de ontwikkeling of herziening van een module worden wijzigingen in belangen aan de voorzitter doorgegeven. De belangenverklaring wordt opnieuw bevestigd tijdens de commentaarfase.
Een overzicht van de belangen van werkgroepleden en het oordeel over het omgaan met eventuele belangen vindt u in onderstaande tabel. De ondertekende belangenverklaringen zijn op te vragen bij het secretariaat van het Kennisinstituut van de Federatie Medisch Specialisten.
Tabel 1: Samenstelling van de werkgroep
|
Werkgroeplid |
Functie |
Nevenfuncties |
Gemelde belangen |
Ondernomen actie |
|
Werkgroep |
||||
|
* Voorzitter werkgroep Oostenbrink |
Kinderarts afd. algemene kindergeneeskunde Erasmusmc Rotterdam |
onbetaald: Member PEM-NL network |
Als wetenschapper betrokken bij de ontwikkeling en toepassing van de feverkidstool, predictie model voor kinderen met koorts, zonder financiele belangen.
|
Geen actie |
|
Buddingh |
Kinderarts infectioloog/ |
SWABID kinderen kerngroeplid (onbetaald) |
Principle investigator landelijke studie naar COVID-19 en MIS-C bij kinderen (COPP-studie, www.covidkids.nl)
|
Geen actie |
|
Israëls |
Kinderarts/pulmonoloog LUMC, Leiden |
APLS instructeur bij Stichting Spoedeisende hulp bij kinderen (onkostenvergoeding) |
Geen |
Geen actie |
|
Vonk |
Maasstad Ziekenhuis |
Columnist Magazine Kinderverpleegkunde (onbetaald). |
Geen |
Geen actie |
|
Alexandridis |
AIOS SEH te Franciscus Gasthuis & Vlietland |
APLS instructeur bij Stichting SHK (onkostenvergoeding) |
Geen |
Geen actie |
|
Westra |
Algemeen Kinderarts Flevoziekenhuis / De Kinderkliniek Almere |
Lid NVK expertisegroep acute kindergeneeskunde, onbetaald |
Geen |
Geen actie |
|
Ramakers |
Laboratoriumspecialist klinische chemie |
ISO 15189 vakdeskundige klinische chemie, Raad van Accreditatie, betaald. |
Geen |
Geen actie |
|
van Elzakker |
Tot mei 2021: Arts-microbioloog HagaZiekenhuis en Juliana Kinderziekenhuis Den Haag, aandachtsgebied infecties bij kinderen Mei 2021-heden: arts-microbioloog AUMC, aandachtsgebied bacteriologie, infecties bij kinderen. |
Tot mei 2021 Auditor Raad voor Accreditatie (vakdeskundige) (betaald). Docent cursus antibiotica bij kinderen (betaald).
|
Geen |
Geen actie |
|
de Bont |
Zelfstandig Huisarts 0.6 FTE |
Geen |
Geen |
Geen actie |
|
Welkers |
Arts-microbioloog, AmsterdamUMC 0,5 FTE) en GGD streeklaboratorium Amsterdam (0,5 FTE). 100% in dienst bij AmsterdamUMC en 0,5FTE gedetacheerd naar GGD streeklaboratorium. |
|
|
|
|
Klankbordgroep |
||||
|
Riezebos-Brilman |
Arts-microbioloog met aandachtsgebied virologie UMCU |
Voorzitter Richtlijn behandeling influenza (NVMM) |
Geen |
Geen actie |
|
Uitzinger |
Junior projectmanager en beleidsmedewerker |
geen |
Geen |
Geen actie |
|
Doganer |
Junior projectmanager en beleidsmedewerker |
geen |
Geen |
Geen actie |
Inbreng patiëntenperspectief
Er werd aandacht besteed aan het patiëntenperspectief door Stichting Kind en Ziekenhuis uit te nodigen voor de klankbordgroep en voor de knelpunteninventarisatie. Het verslag van de knelpunteninventarisatie is besproken in de werkgroep. De verkregen input is meegenomen bij het opstellen van de uitgangsvragen, de keuze voor de uitkomstmaten en bij het opstellen van de overwegingen. De conceptrichtlijn is tevens voor commentaar voorgelegd aan Stichting Kind en Ziekenhuis en de eventueel aangeleverde commentaren zijn bekeken en verwerkt.
Wkkgz & Kwalitatieve raming van mogelijke substantiële financiële gevolgen
Kwalitatieve raming van mogelijke financiële gevolgen in het kader van de Wkkgz
Bij de richtlijn is conform de Wet kwaliteit, klachten en geschillen zorg (Wkkgz) een kwalitatieve raming uitgevoerd of de aanbevelingen mogelijk leiden tot substantiële financiële gevolgen. Bij het uitvoeren van deze beoordeling zijn richtlijnmodules op verschillende domeinen getoetst (zie het stroomschema op de Richtlijnendatabase).
Uit de kwalitatieve raming blijkt dat er waarschijnlijk geen substantiële financiële gevolgen zijn, zie onderstaande tabel.
|
Module |
Uitkomst raming |
Toelichting |
|
Prognostische factoren ernstige bacteriële infectie |
Geen financiële gevolgen |
Hoewel uit de toetsing volgt dat de aanbeveling(en) breed toepasbaar zijn (>40.000 patiënten), volgt ook uit de toetsing dat het geen nieuwe manier van zorgverlening of andere organisatie van zorgverlening betreft, het geen toename in het aantal in te zetten voltijdsequivalenten aan zorgverleners betreft en het geen wijziging in het opleidingsniveau van zorgpersoneel betreft. Er worden daarom geen substantiële financiële gevolgen verwacht. |
Werkwijze
AGREE
Deze richtlijnmodule is opgesteld conform de eisen vermeld in het rapport Medisch Specialistische Richtlijnen 2.0 van de adviescommissie Richtlijnen van de Raad Kwaliteit. Dit rapport is gebaseerd op het AGREE II instrument (Appraisal of Guidelines for Research & Evaluation II; Brouwers, 2010).
Knelpuntenanalyse en uitgangsvragen
Tijdens de voorbereidende fase inventariseerde de werkgroep de knelpunten in de zorg voor kinderen met koorts op de Spoedeisende Hulp. Tevens was er mogelijkheid om knelpunten aan te dragen via een schriftelijke knelpunteninventarisatie. Een overzicht van de binnengekomen reacties is opgenomen in de bijlagen.
Op basis van de uitkomsten van de schriftelijke knelpunteninventarisatie zijn door de werkgroep concept-uitgangsvragen opgesteld en definitief vastgesteld.
Uitkomstmaten
Na het opstellen van de zoekvraag behorende bij de uitgangsvraag inventariseerde de werkgroep welke uitkomstmaten voor de patiënt relevant zijn, waarbij zowel naar gewenste als ongewenste effecten werd gekeken. Hierbij werd een maximum van acht uitkomstmaten gehanteerd. De werkgroep waardeerde deze uitkomstmaten volgens hun relatieve belang bij de besluitvorming rondom aanbevelingen, als cruciaal (kritiek voor de besluitvorming), belangrijk (maar niet cruciaal) en onbelangrijk. Tevens definieerde de werkgroep tenminste voor de cruciale uitkomstmaten welke verschillen zij klinisch (patiënt) relevant vonden.
Methode literatuursamenvatting
Een uitgebreide beschrijving van de strategie voor zoeken en selecteren van literatuur is te vinden onder ‘Zoeken en selecteren’ onder Onderbouwing. Indien mogelijk werd de data uit verschillende studies gepoold in een random-effects model. Review Manager 5.4 werd gebruikt voor de statistische analyses. De beoordeling van de kracht van het wetenschappelijke bewijs wordt hieronder toegelicht.
Beoordelen van de kracht van het wetenschappelijke bewijs
De kracht van het wetenschappelijke bewijs werd bepaald volgens de GRADE-methode. GRADE staat voor ‘Grading Recommendations Assessment, Development and Evaluation’ (zie http://www.gradeworkinggroup.org/). De basisprincipes van de GRADE-methodiek zijn: het benoemen en prioriteren van de klinisch (patiënt) relevante uitkomstmaten, een systematische review per uitkomstmaat, en een beoordeling van de bewijskracht per uitkomstmaat op basis van de acht GRADE-domeinen (domeinen voor downgraden: risk of bias, inconsistentie, indirectheid, imprecisie, en publicatiebias; domeinen voor upgraden: dosis-effect relatie, groot effect, en residuele plausibele confounding).
GRADE onderscheidt vier gradaties voor de kwaliteit van het wetenschappelijk bewijs: hoog, redelijk, laag en zeer laag. Deze gradaties verwijzen naar de mate van zekerheid die er bestaat over de literatuurconclusie, in het bijzonder de mate van zekerheid dat de literatuurconclusie de aanbeveling adequaat ondersteunt (Schünemann, 2013; Hultcrantz, 2017).
|
GRADE |
Definitie |
|
Hoog |
|
|
Redelijk |
|
|
Laag |
|
|
Zeer laag |
|
Bij het beoordelen (graderen) van de kracht van het wetenschappelijk bewijs in richtlijnen volgens de GRADE-methodiek spelen grenzen voor klinische besluitvorming een belangrijke rol (Hultcrantz, 2017). Dit zijn de grenzen die bij overschrijding aanleiding zouden geven tot een aanpassing van de aanbeveling. Om de grenzen voor klinische besluitvorming te bepalen moeten alle relevante uitkomstmaten en overwegingen worden meegewogen. De grenzen voor klinische besluitvorming zijn daarmee niet één op één vergelijkbaar met het minimaal klinisch relevant verschil (Minimal Clinically Important Difference, MCID). Met name in situaties waarin een interventie geen belangrijke nadelen heeft en de kosten relatief laag zijn, kan de grens voor klinische besluitvorming met betrekking tot de effectiviteit van de interventie bij een lagere waarde (dichter bij het nuleffect) liggen dan de MCID (Hultcrantz, 2017).
Prognostisch onderzoek: studiedesign en hiërarchie
Bij het beoordelen van literatuur is er een hiërarchie in de kwaliteit van individuele studies. Bij voorkeur wordt de effectiviteit van een klinisch beslismodel geëvalueerd in een klinische trial. Helaas zijn deze studies zeer zeldzaam. Indien niet beschikbaar, hebben studies waarin voorspellingsmodellen worden ontwikkeld en gevalideerd in andere samples van de doelpopulatie (externe validatie) de voorkeur aangezien er meer vertrouwen is in de resultaten van deze studies in vergelijking met studies die niet extern gevalideerd zijn. De meeste samples geven de karakteristieken van de totale populatie niet volledig weer, wat resulteert in afwijkende associaties, die mogelijk gevolgen hebben voor conclusies die getrokken worden. Studies die voorspellingsmodellen intern valideren (bijvoorbeeld door middel van bootstrapping of kruisvalidatie) kunnen ook worden gebruikt om de onderzoeksvraag te beantwoorden, maar het verlagen van het bewijsniveau ligt voor de hand vanwege het risico op bias en/of indirectheid, aangezien het niet duidelijk is of modellen voldoende presteren bij doelpopulaties. Het vertrouwen in de resultaten van niet-gevalideerde voorspellingsmodellen is erg laag. Over het algemeen leidt dit tot geen GRADE of Zeer lage GRADE. Dit geldt ook voor associatiemodellen. De risicofactoren die uit dergelijke modellen worden geïdentificeerd, kunnen worden gebruikt om patiënten of ouders te informeren over de inschatting van het risico op ernstige bacteriëmie, bacteriële meningitis of urineweginfectie, maar ze zijn minder geschikt om te gebruiken bij klinische besluitvorming.
Overwegingen (van bewijs naar aanbeveling)
Om te komen tot een aanbeveling zijn naast (de kwaliteit van) het wetenschappelijke bewijs ook andere aspecten belangrijk en worden meegewogen, zoals aanvullende argumenten uit bijvoorbeeld de biomechanica of fysiologie, waarden en voorkeuren van patiënten, kosten (middelenbeslag), aanvaardbaarheid, haalbaarheid en implementatie. Deze aspecten zijn systematisch vermeld en beoordeeld (gewogen) onder het kopje ‘Overwegingen’ en kunnen (mede) gebaseerd zijn op expert opinion. Hierbij is gebruik gemaakt van een gestructureerd format gebaseerd op het evidence-to-decision framework van de internationale GRADE Working Group (Alonso-Coello, 2016a; Alonso-Coello 2016b). Dit evidence-to-decision framework is een integraal onderdeel van de GRADE methodiek.
Formuleren van aanbevelingen
De aanbevelingen geven antwoord op de uitgangsvraag en zijn gebaseerd op het beschikbare wetenschappelijke bewijs en de belangrijkste overwegingen, en een weging van de gunstige en ongunstige effecten van de relevante interventies. De kracht van het wetenschappelijk bewijs en het gewicht dat door de werkgroep wordt toegekend aan de overwegingen, bepalen samen de sterkte van de aanbeveling. Conform de GRADE-methodiek sluit een lage bewijskracht van conclusies in de systematische literatuuranalyse een sterke aanbeveling niet a priori uit, en zijn bij een hoge bewijskracht ook zwakke aanbevelingen mogelijk (Agoritsas, 2017; Neumann, 2016). De sterkte van de aanbeveling wordt altijd bepaald door weging van alle relevante argumenten tezamen. De werkgroep heeft bij elke aanbeveling opgenomen hoe zij tot de richting en sterkte van de aanbeveling zijn gekomen.
In de GRADE-methodiek wordt onderscheid gemaakt tussen sterke en zwakke (of conditionele) aanbevelingen. De sterkte van een aanbeveling verwijst naar de mate van zekerheid dat de voordelen van de interventie opwegen tegen de nadelen (of vice versa), gezien over het hele spectrum van patiënten waarvoor de aanbeveling is bedoeld. De sterkte van een aanbeveling heeft duidelijke implicaties voor patiënten, behandelaars en beleidsmakers (zie onderstaande tabel). Een aanbeveling is geen dictaat, zelfs een sterke aanbeveling gebaseerd op bewijs van hoge kwaliteit (GRADE gradering HOOG) zal niet altijd van toepassing zijn, onder alle mogelijke omstandigheden en voor elke individuele patiënt.
|
Implicaties van sterke en zwakke aanbevelingen voor verschillende richtlijngebruikers |
||
|
|
||
|
|
Sterke aanbeveling |
Zwakke (conditionele) aanbeveling |
|
Voor patiënten |
De meeste patiënten zouden de aanbevolen interventie of aanpak kiezen en slechts een klein aantal niet. |
Een aanzienlijk deel van de patiënten zouden de aanbevolen interventie of aanpak kiezen, maar veel patiënten ook niet. |
|
Voor behandelaars |
De meeste patiënten zouden de aanbevolen interventie of aanpak moeten ontvangen. |
Er zijn meerdere geschikte interventies of aanpakken. De patiënt moet worden ondersteund bij de keuze voor de interventie of aanpak die het beste aansluit bij zijn of haar waarden en voorkeuren. |
|
Voor beleidsmakers |
De aanbevolen interventie of aanpak kan worden gezien als standaardbeleid. |
Beleidsbepaling vereist uitvoerige discussie met betrokkenheid van veel stakeholders. Er is een grotere kans op lokale beleidsverschillen. |
Organisatie van zorg
In de knelpuntenanalyse en bij de ontwikkeling van de richtlijnmodule is expliciet aandacht geweest voor de organisatie van zorg: alle aspecten die randvoorwaardelijk zijn voor het verlenen van zorg (zoals coördinatie, communicatie, (financiële) middelen, mankracht en infrastructuur). Randvoorwaarden die relevant zijn voor het beantwoorden van deze specifieke uitgangsvraag zijn genoemd bij de overwegingen. Meer algemene, overkoepelende, of bijkomende aspecten van de organisatie van zorg worden behandeld in de module Organisatie van zorg.
Commentaar- en autorisatiefase
De conceptrichtlijnmodule werd aan de betrokken (wetenschappelijke) verenigingen en (patiënt) organisaties voorgelegd ter commentaar. De commentaren werden verzameld en besproken met de werkgroep. Naar aanleiding van de commentaren werd de conceptrichtlijnmodule aangepast en definitief vastgesteld door de werkgroep. De definitieve richtlijnmodule werd aan de deelnemende (wetenschappelijke) verenigingen en (patiënt) organisaties voorgelegd voor autorisatie en door hen geautoriseerd dan wel geaccordeerd.
Literatuur
Agoritsas T, Merglen A, Heen AF, Kristiansen A, Neumann I, Brito JP, Brignardello-Petersen R, Alexander PE, Rind DM, Vandvik PO, Guyatt GH. UpToDate adherence to GRADE criteria for strong recommendations: an analytical survey. BMJ Open. 2017 Nov 16;7(11):e018593. doi: 10.1136/bmjopen-2017-018593. PubMed PMID: 29150475; PubMed Central PMCID: PMC5701989.
Alonso-Coello P, Schünemann HJ, Moberg J, Brignardello-Petersen R, Akl EA, Davoli M, Treweek S, Mustafa RA, Rada G, Rosenbaum S, Morelli A, Guyatt GH, Oxman AD; GRADE Working Group. GRADE Evidence to Decision (EtD) frameworks: a systematic and transparent approach to making well informed healthcare choices. 1: Introduction. BMJ. 2016 Jun 28;353:i2016. doi: 10.1136/bmj.i2016. PubMed PMID: 27353417.
Alonso-Coello P, Oxman AD, Moberg J, Brignardello-Petersen R, Akl EA, Davoli M, Treweek S, Mustafa RA, Vandvik PO, Meerpohl J, Guyatt GH, Schünemann HJ; GRADE Working Group. GRADE Evidence to Decision (EtD) frameworks: a systematic and transparent approach to making well informed healthcare choices. 2: Clinical practice guidelines. BMJ. 2016 Jun 30;353:i2089. doi: 10.1136/bmj.i2089. PubMed PMID: 27365494.
Brouwers MC, Kho ME, Browman GP, Burgers JS, Cluzeau F, Feder G, Fervers B, Graham ID, Grimshaw J, Hanna SE, Littlejohns P, Makarski J, Zitzelsberger L; AGREE Next Steps Consortium. AGREE II: advancing guideline development, reporting and evaluation in health care. CMAJ. 2010 Dec 14;182(18):E839-42. doi: 10.1503/cmaj.090449. Epub 2010 Jul 5. Review. PubMed PMID: 20603348; PubMed Central PMCID: PMC3001530.
Hultcrantz M, Rind D, Akl EA, Treweek S, Mustafa RA, Iorio A, Alper BS, Meerpohl JJ, Murad MH, Ansari MT, Katikireddi SV, Östlund P, Tranæus S, Christensen R, Gartlehner G, Brozek J, Izcovich A, Schünemann H, Guyatt G. The GRADE Working Group clarifies the construct of certainty of evidence. J Clin Epidemiol. 2017 Jul;87:4-13. doi: 10.1016/j.jclinepi.2017.05.006. Epub 2017 May 18. PubMed PMID: 28529184; PubMed Central PMCID: PMC6542664.
Medisch Specialistische Richtlijnen 2.0 (2012). Adviescommissie Richtlijnen van de Raad Kwalitieit. http://richtlijnendatabase.nl/over_deze_site/over_richtlijnontwikkeling.html
Neumann I, Santesso N, Akl EA, Rind DM, Vandvik PO, Alonso-Coello P, Agoritsas T, Mustafa RA, Alexander PE, Schünemann H, Guyatt GH. A guide for health professionals to interpret and use recommendations in guidelines developed with the GRADE approach. J Clin Epidemiol. 2016 Apr;72:45-55. doi: 10.1016/j.jclinepi.2015.11.017. Epub 2016 Jan 6. Review. PubMed PMID: 26772609.
Schünemann H, Brożek J, Guyatt G, et al. GRADE handbook for grading quality of evidence and strength of recommendations. Updated October 2013. The GRADE Working Group, 2013. Available from http://gdt.guidelinedevelopment.org/central_prod/_design/client/handbook/handbook.html.
Zoekverantwoording
Literature search strategy
Embase
|
No. |
Query |
Results |
|
#14 |
#11 OR #12 OR #13 |
521 |
|
#13 |
#7 AND #10 NOT (#11 OR #12) = observationeel |
277 |
|
#12 |
#7 AND #9 NOT #11 = RCT |
206 |
|
#11 |
#7 AND #8 = SR |
38 |
|
#10 |
'major clinical study'/de OR 'clinical study'/de OR 'case control study'/de OR 'family study'/de OR 'longitudinal study'/de OR 'retrospective study'/de OR 'prospective study'/de OR 'cohort analysis'/de OR cohort*:ab,ti OR (('case control' NEAR/1 (study OR studies)):ab,ti) OR (('follow up' NEAR/1 (study OR studies)):ab,ti) OR (observational NEAR/1 (study OR studies)) OR ((epidemiologic NEAR/1 (study OR studies)):ab,ti) OR (('cross sectional' NEAR/1 (study OR studies)):ab,ti) |
5768288 |
|
#9 |
'clinical trial'/exp OR 'randomization'/exp OR 'single blind procedure'/exp OR 'double blind procedure'/exp OR 'crossover procedure'/exp OR 'placebo'/exp OR 'prospective study'/exp OR rct:ab,ti OR random*:ab,ti OR 'single blind':ab,ti OR 'randomised controlled trial':ab,ti OR 'randomized controlled trial'/exp OR placebo*:ab,ti |
3169446 |
|
#8 |
'meta analysis'/exp OR 'meta analysis (topic)'/exp OR metaanaly*:ti,ab OR 'meta analy*':ti,ab OR metanaly*:ti,ab OR 'systematic review'/de OR 'cochrane database of systematic reviews'/jt OR prisma:ti,ab OR prospero:ti,ab OR (((systemati* OR scoping OR umbrella OR 'structured literature') NEAR/3 (review* OR overview*)):ti,ab) OR ((systemic* NEAR/1 review*):ti,ab) OR (((systemati* OR literature OR database* OR 'data base*') NEAR/10 search*):ti,ab) OR (((structured OR comprehensive* OR systemic*) NEAR/3 search*):ti,ab) OR (((literature NEAR/3 review*):ti,ab) AND (search*:ti,ab OR database*:ti,ab OR 'data base*':ti,ab)) OR (('data extraction':ti,ab OR 'data source*':ti,ab) AND 'study selection':ti,ab) OR ('search strategy':ti,ab AND 'selection criteria':ti,ab) OR ('data source*':ti,ab AND 'data synthesis':ti,ab) OR medline:ab OR pubmed:ab OR embase:ab OR cochrane:ab OR (((critical OR rapid) NEAR/2 (review* OR overview* OR synthes*)):ti) OR ((((critical* OR rapid*) NEAR/3 (review* OR overview* OR synthes*)):ab) AND (search*:ab OR database*:ab OR 'data base*':ab)) OR metasynthes*:ti,ab OR 'meta synthes*':ti,ab |
685636 |
|
#7 |
#1 AND #2 AND #3 AND (#4 OR (#5 AND #6)) AND ([english]/lim OR [dutch]/lim) AND [2000-2020]/py NOT ('conference abstract'/it OR 'editorial'/it OR 'letter'/it OR 'note'/it) |
1102 |
|
#6 |
'anamnesis'/exp OR anamnesis:ti,ab,kw OR 'history taking':ti,ab,kw OR 'medical interview*':ti,ab,kw OR 'clinical histor':ti,ab,kw OR 'medical hisotry':ti,ab,kw OR 'physical disease by body function'/exp OR 'symptom assessment'/exp OR ((clinical NEAR/4 (manifestation* OR feature* OR finding* OR aspect* OR marker* OR recogni* OR identif*)):ti,ab,kw) OR ((presenting NEAR/4 (feature* OR finding* OR factor* OR aspect* OR marker*)):ti,ab,kw) OR presentation*:ti,ab,kw OR ((physical NEAR/4 (manifestation* OR characteristic* OR feature* OR finding* OR aspect* OR marker*)):ti,ab,kw) OR sign*:ti,ab,kw OR symptom*:ti,ab,kw OR complain*:ti,ab,kw OR indicator*:ti,ab,kw OR predict*:ti,ab,kw |
18285209 |
|
#5 |
'physical examination'/exp OR ((physical* NEAR/3 examination):ti,ab,kw) |
293425 |
|
#4 |
'model'/exp OR 'predictive value'/exp OR 'prediction'/exp OR 'decision support system'/exp OR 'clinical decision making'/exp OR (((model* OR rule*) NEAR/3 prediction*):ti,ab,kw) OR ((decision NEAR/3 (making OR support)):ti,ab,kw) |
3794338 |
|
#3 |
'fever'/exp/mj OR fever*:ti,ab,kw OR febrile:ti,ab,kw OR 'bacterial infection'/exp/mj OR ((bacterial NEAR/3 infection*):ti,ab,kw) OR sepsis:ti,ab,kw OR septic:ti,ab,kw OR meningitis:ti,ab,kw OR pneumoni*:ti,ab,kw |
1396320 |
|
#2 |
'emergency ward'/exp OR 'emergency care'/exp OR 'emergency health service'/exp OR 'emergency medicine'/exp OR 'evidence based emergency medicine'/exp OR 'emergency treatment'/exp OR ((emergenc* NEAR/3 (ward* OR department* OR care OR medicine OR service* OR unit* OR room*)):ti,ab,kw) |
575118 |
|
#1 |
infan*:ti,ab OR newborn*:ti,ab OR 'new born*':ti,ab OR perinat*:ti,ab OR neonat*:ti,ab OR 'baby'/exp OR baby*:ti,ab OR babies:ti,ab OR toddler*:ti,ab OR 'minors'/exp/mj OR minors*:ti,ab OR 'boy'/exp OR boy*:ti,ab OR boys:ti,ab OR boyhood:ti,ab OR girl*:ti,ab OR kid:ti,ab OR kids:ti,ab OR 'child'/exp OR child*:ti,ab OR children*:ti,ab OR schoolchild*:ti,ab OR 'schoolchild'/exp OR adolescen*:ti,ab OR juvenil*:ti,ab OR youth*:ti,ab OR teen*:ti,ab OR pubescen*:ti,ab OR pediatric*:ti,ab OR paediatric*:ti,ab OR peadiatric*:ti,ab OR school:ti,ab OR school*:ti,ab OR prematur*:ti,ab OR preterm*:ti,ab OR 'pediatrics'/exp OR 'pediatric patient'/exp |
4454793 |
Ovid/Medline
|
# |
Searches |
Results |
|
15 |
12 or 13 or 14 |
579 |
|
14 |
(8 and 11) not (12 or 13) = observationeel |
435 |
|
13 |
(8 and 10) not 12 = RCT |
123 |
|
12 |
8 and 9 = SR |
21 |
|
11 |
Epidemiologic studies/ or case control studies/ or exp cohort studies/ or Controlled Before-After Studies/ or Case control.tw. or cohort*.tw. or Cohort analy$.tw. or (Follow up adj (study or studies)).tw. or (observational adj (study or studies)).tw. or Longitudinal.tw. or Retrospective*.tw. or prospective*.tw. or consecutive*.tw. or Cross sectional.tw. or Cross-sectional studies/ or historically controlled study/ or interrupted time series analysis/ |
3719038 |
|
10 |
exp clinical trial/ or randomized controlled trial/ or exp clinical trials as topic/ or randomized controlled trials as topic/ or Random Allocation/ or Double-Blind Method/ or Single-Blind Method/ or (clinical trial, phase i or clinical trial, phase ii or clinical trial, phase iii or clinical trial, phase iv or controlled clinical trial or randomized controlled trial or multicenter study or clinical trial).pt. or random*.ti,ab. or (clinic* adj trial*).tw. or ((singl* or doubl* or treb* or tripl*) adj (blind$3 or mask$3)).tw. or Placebos/ or placebo*.tw. |
2232660 |
|
9 |
meta-analysis/ or meta-analysis as topic/ or (metaanaly* or meta-analy* or metanaly*).ti,ab,kf. or systematic review/ or cochrane.jw. or (prisma or prospero).ti,ab,kf. or ((systemati* or scoping or umbrella or "structured literature") adj3 (review* or overview*)).ti,ab,kf. or (systemic* adj1 review*).ti,ab,kf. or ((systemati* or literature or database* or data-base*) adj10 search*).ti,ab,kf. or ((structured or comprehensive* or systemic*) adj3 search*).ti,ab,kf. or ((literature adj3 review*) and (search* or database* or data-base*)).ti,ab,kf. or (("data extraction" or "data source*") and "study selection").ti,ab,kf. or ("search strategy" and "selection criteria").ti,ab,kf. or ("data source*" and "data synthesis").ti,ab,kf. or (medline or pubmed or embase or cochrane).ab. or ((critical or rapid) adj2 (review* or overview* or synthes*)).ti. or (((critical* or rapid*) adj3 (review* or overview* or synthes*)) and (search* or database* or data-base*)).ab. or (metasynthes* or meta-synthes*).ti,ab,kf. |
488072 |
|
8 |
limit 7 to (english language and yr="2000 -Current") |
834 |
|
7 |
1 and 2 and 3 and (4 or (5 and 6)) |
1041 |
|
6 |
exp Medical History Taking/ or (anamnesis or examination or 'history taking' or 'medical interview*').ti,ab,kf. or 'clinical histor'.ti,ab,kf. or 'medical hisotry'.ti,ab,kf. or exp "signs and symptoms"/ or exp Symptom Assessment/ or (clinical adj4 (manifestation* or feature* or finding* or aspect* or marker* or recogni* or identif*)).ti,ab,kf. or (presenting adj4 (feature* or finding* or factor* or aspect* or marker*)).ti,ab,kf. or presentation*.ti,ab,kf. or (physical adj4 (manifestation* or characteristic* or feature* or finding* or aspect* or marker*)).ti,ab,kf. or sign*.ti,ab,kf. or symptom*.ti,ab,kf. or complain*.ti,ab,kf. or indicator*.ti,ab,kf. or predict*.ti,ab,kf. |
11201355 |
|
5 |
exp Physical Examination/ or (physical* adj3 examination).ti,ab,kf. |
1434056 |
|
4 |
exp Models, Theoretical/ or exp "Decision Support Systems, Clinical"/ or exp Clinical Decision-Making/ or ((model* or rule*) adj3 prediction*).ti,ab,kf. or (decision adj3 (making or support)).ti,ab,kf. |
1973660 |
|
3 |
exp Fever/ or fever*.ti,ab,kf. or febrile.ti,ab,kf. or exp Bacterial Infections/ or exp Meningitis/ or exp Sepsis/ or exp Pneumonia/ or (bacterial adj3 infection*).ti,ab,kf. or sepsis.ti,ab,kf. or septic.ti,ab,kf. or meningitis.ti,ab,kf. or pneumoni*.ti,ab,kf. |
1435920 |
|
2 |
Emergencies/ or Emergency Medicine/ or "Emergency Treatment"/ or exp Emergency Medical Services/ or exp Emergency Service, Hospital/ or (emergenc* adj3 (ward* or department* or care or medicine or service* or unit* or room*)).ti,ab,kf. |
276703 |
|
1 |
neonates/ or premature infants/ or preterm*.ti,ab. or prematur*.ti,ab. or perinat*.ti,ab. or neonat*.ti,ab. or newborn*.ti,ab. or new-born.ti,ab. or infant, newborn/ or picu.ti,ab. or nicu.ti,ab. or infant/ or infan*.ti,ab. or toddler*.ti,ab. or baby*.ti,ab. or babies.ti,ab. or pediatrics/ or paediat*.ti,ab. or pediat*.ti,ab. or child/ or child*.ti,ab. or kid.ti,ab. or kids.ti,ab. or puberty/ or puberty.ti,ab. or pubescen*.ti,ab. or prepubescen*.ti,ab. or prepuberty*.ti,ab. or teen*.ti,ab. or young*.ti,ab. or youth*.ti,ab. or under ag*.ti,ab. or underag*.ti,ab. or juvenile*.ti,ab. or preadolesc*.ti,ab. or adolescent/ or adolesc*.ti,ab. or young adult/ or girl*.ti,ab. or boy*.ti,ab. or child, preschool/ or preschool*.ti,ab. or schoolchild*.ti,ab. or juvenile*.ti,ab. |
5196864 |