Optimale termijn bevalling dichoriale tweelingen
Uitgangsvraag
Wat is de optimale termijn om de bevalling na te streven bij een ongecompliceerde dichoriale tweelingzwangerschap?
Aanbeveling
Bespreek bij een ongecompliceerde dichoriale tweelingzwangerschap het beleid na 37+0 weken zwangerschapsduur, waarbij de mogelijkheden van electieve bevalling tussen 37+0 en 38+0 weken dan wel expectatief beleid tot 39+0 weken aan de orde dienen te komen. Hierbij dient counseling plaats te vinden over de kans op neonatale (respiratoire) morbiditeit en (intra-uteriene) mortaliteit.
Overwegingen
Voor- en nadelen van de interventie en de kwaliteit van het bewijs
In de hierboven benoemde cohortstudies werd geen specifieke uitspraak gedaan over het inleiden van de bevalling bij zwangeren met dichoriale tweelingzwangerschappen. Er werd strikt genomen gekeken naar de zwangerschapsduur, hetgeen vervolgens werd gekoppeld aan de uitkomst. Het was onbekend hoeveel patiënten zijn ingeleid, en hoeveel spontaan in partu zijn gekomen. Op basis van deze informatie is het dus niet goed mogelijk om een uitspraak te doen over “inductie” van de baring, maar wel degelijk over “timing” van de baring en over het risico op overlijden per zwangerschapsduur, en dit afwegen tegen het risico op neonatale (en maternale) mortaliteit en morbiditeit. Op basis van die informatie is het mogelijk om tot een afgewogen advies te komen.
Het risico op intra-uterien overlijden overschrijdt rond 37 weken het risico op neonatale sterfte bij de ongecompliceerde dichoriale tweelingzwangerschap.
Het bewijs is van ‘zeer laag niveau’ aangezien het cohortstudies betreft, en gerandomiseerde studies ontbreken, net zoals bij de monochoriale diamniotische tweelingzwangerschappen.
Derhalve is een afweging van het prospectieve risico op foetale sterfte versus de risico’s voor de neonaat bij geboorte per zwangerschapsweek de hoogst haalbare evidence. Het intra-uteriene risico dient afgewogen te worden tegen het extra-uteriene risico in termen van zowel sterfte als neonatale morbiditeit. Individuele studies en verrichte meta-analyses laten hierin eenzelfde trend zien. Het electief nastreven van de bevalling van ongecompliceerde dichoriale tweelingzwangerschappen vanaf 37 weken zwangerschapsduur vermindert de kans op intra-uteriene sterfte (3,4 per 1000) en leidt waarschijnlijk niet tot toegenomen sterfte in de neonatale periode (2,2 per 1000) (zie tabel 1). Daarnaast is het risico op ernstige neonatale morbiditeit laag na 37 weken. Aangezien de kans op intra-uteriene sterfte bij 38 weken is opgelopen naar 10,6 per 1000, en bij 39 weken naar 9,3 per 1000 zwangerschappen, zou je kunnen overwegen om bij patiënten, zwanger van een ongecompliceerde dichoriale tweelingzwangerschap de bevalling na te streven vanaf 37 weken. Ouders dienen gecounseld te worden over de voor- en nadelen van een electieve inleiding of sectio versus een expectatief beleid.
Waarden en voorkeuren van patiënten
De meeste vrouwen zwanger van een dichoriale tweeling bevallen gemiddeld bij 37 weken. Maar een klein deel bevalt na 37 weken: vrouwen vragen zelf geregeld om een inleiding wegens mechanische klachten. Daarnaast zijn veel vrouwen al ingeleid vóór 37 weken wegens medische indicaties als groeivertraging of pre-eclampsie.
Kosten (middelenbeslag)
Er zijn geen studies beschikbaar waarbij het nastreven van de bevalling van een dichoriale zwangerschap wordt afgewogen tegen het afwachten. Het is aannemelijk dat de kans op neonatale morbiditeit na 37 weken vrij laag is, waardoor de kosten van opname wegens prematuriteit/ morbiditeit laag zullen zijn.
Het voorgestelde beleid is al geïmplementeerd in Nederland en zal geen toename van kosten en middelenbeslag geven.
Aanvaardbaarheid, haalbaarheid en implementatie
Implementatie van deze richtlijn zal zonder problemen verlopen, aangezien de meeste ziekenhuizen al een bevalling nastreven van dichoriale tweelingzwangerschappen bij 37 weken.
Rationale van de aanbeveling: weging van argumenten voor en tegen de interventies
Op basis van bovengenoemde cohortonderzoeken is de werkgroep van mening dat het actief nastreven van de bevalling vanaf 37 weken bij de dichoriale tweelingzwangerschap waarschijnlijk zal leiden tot minder intra-uteriene sterfte. Daarom is het van belang om de ouders te counselen over de voordelen en nadelen van het nastreven van de bevalling vanaf 37 weken.
Onderbouwing
Naar aanleiding van meer recente literatuur (onder andere Cheong-See, 2016) zijn er aanwijzingen om de baring van dichoriale (DC) tweelingen te vervroegen van 39 weken (zoals in de oude richtlijn stond) naar 37 weken. Dit leidt mogelijk tot een verdere reductie in intrauteriene mortaliteit. Er zijn echter ook aanwijzingen dat het vervroegen van de baring kan leiden tot een toename van neonatale morbiditeit. In de huidige module zullen we deze uitgangsvraag proberen te beantwoorden.
Neonatal outcomes
|
Very low GRADE |
The evidence is very uncertain whether timing of delivery before 39 weeks reduces the risk of intra-uterine mortality compared to the risk of neonatal mortality for uncomplicated dichorionic twin pregnancies.
Bronnen: (Cheong-See, 2016; Lee, 2016) |
|
Very low GRADE |
The evidence is very uncertain about the effect of timing of delivery before 39 weeks of gestation compared to expectant management on neonatal infection in uncomplicated dichorionic twin pregnancies.
Bronnen: (Cheong-See, 2016) |
|
Very low GRADE |
The evidence is very uncertain about the effect of timing of delivery before 39 weeks of gestation compared to expectant management on Apgar score of less than 7 at 5 minutes in uncomplicated dichorionic twin pregnancies.
Bronnen: (Lee, 2016) |
|
Very low GRADE |
The evidence is very uncertain about the effect of timing of delivery before 39 weeks of gestation compared to expectant management on NICU admission in uncomplicated dichorionic twin pregnancies.
Bronnen: (Cheong-See, 2016; Lee, 2016; Brincat, 2017) |
|
Very low GRADE |
The evidence is very uncertain about the effect of timing of delivery before 39 weeks of gestation compared to expectant management on Respiratory Distress Syndrome in uncomplicated dichorionic twin pregnancies.
Bronnen: (Cheong-See, 2016; Lee, 2016; Brincat, 2017) |
|
- GRADE |
The effects of timing of delivery before 39 weeks of gestation on birthweight in uncomplicated dichorionic twin pregnancies are unclear. Too few information was available to conclude for this outcome.
Bronnen: (Brincat, 2017) |
|
- GRADE |
The effects of timing of delivery before 39 weeks of gestation on neonatal disability in uncomplicated dichorionic twin pregnancies are unclear. None of the included studies reported these outcomes. |
Maternal outcomes
|
- GRADE |
The effects of timing of delivery before 39 weeks of gestation on mode of delivery, postpartum hemorrhage, analgesia, perineal trauma, breastfeeding at discharge, maternal satisfaction and psychological well-being/ anxiety in uncomplicated dichorionic twin pregnancies are unclear. None of the included studies reported these outcomes. |
Description of studies
Cheong-See (2016) performed a systematic review and meta-analysis to determine the risks of stillbirth and neonatal complications by gestational age in uncomplicated monochorionic and dichorionic twin pregnancies. Medline, Embase and Cochrane databases were searched from inception until December 2015 for observational cohort studies and cohorts nested in RCT’s reporting rates of stillbirth or neonatal outcomes in monochorionic and/or dichorionic twin pregnancies. Exclusion criteria were unclear chorionicity, monoamnionicity, inability to exclude twin to twin transfusion syndrome in fetuses, and outcomes not provided in weekly or two weekly gestational periods. Stillbirth was defined as a baby born without signs of life after the age of viability or any other definition. Neonatal mortality was defined as death up to 28 days after delivery. The risk of perinatal death at a given gestational week was defined as the difference between risk of stillbirth and risk of neonatal death for deliveries in that week. A total of 32 studies were included, reporting on 35171 women with twin gestation, from which 29685 dichorionic pregnancies in 25 studies.
Lee (2016) performed a retrospective cohort study with women with uncomplicated monochorionic and dichorionic pregnancies delivered at or beyond 35 weeks of gestation in a tertiary referral hospital in Seoul (Korea) from 1995 to 2013. The optimal gestational age for delivery was determined by comparing the neonatal composite morbidity rate between women who delivered and women who remained undelivered at each gestational week. A total of 697 twin pregnancies were included, from which 526 dichorionic twins. The mean age of the cohort was 32.8 (SD 4.7) years at 35 weeks of gestation.
Brincat (2017) performed a retrospective analysis of gestational age-specific neonatal morbidity and mortality data from the National Obstetric Information System (NOIS) in the Maltese islands from 2008 to 2014. A total of 254 uncomplicated dichorionic twin pregnancies were included, 492 (97%) twin neonates were born with a gestational age at birth between 34 and 38 weeks, and 14 (3%) with a gestational age at birth of 39 or 40 weeks. The mean maternal age was 30.6 (95% CI 30.2 to 30.99) years.
Results
1. Neonatal outcomes
1.1 Intrauterine versus neonatal mortality
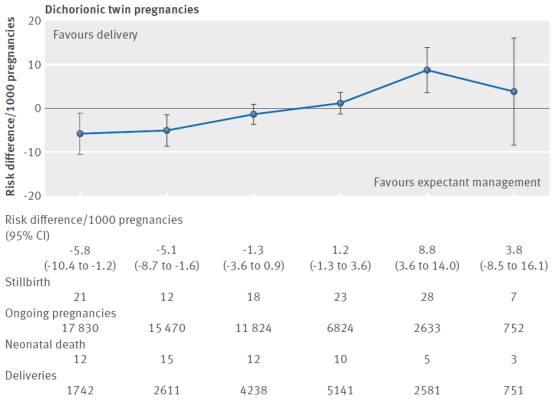
The outcome measure perinatal death was provided weekly after 34 weeks’ gestation in 15 of the included trials (Alboulghar, 2012; Awwad, 2014; Barrett, 2012; Bhattachary, 2015; Breatnach, 2011; Briery, 2009; Burgess, 2014, Combs, 2011; Hack, 2008; Liem, 2013; Lim, 2011; Morikawa, 2012; Norman, 2009; Rode, 2011; Serra, 2012; Wood, 2015). The prospective risk of perinatal death was calculated for each week from 34 weeks to 38 weeks of gestation. The prospective risk of stillbirth and neonatal death rates in dichorionic pregnancies were respectively 1.2 (95% CI 0.7 to 1.8) and 6.7 (95% CI 3.3 to 13.5) at 34 weeks, 0.8 (95% CI 0.4 to 1.4) and 4.6 (95% CI 2.4 to 8.7) at 35 weeks, 1.5 (95% CI 0.9 to 2.4) and 3.2 (95% CI 1.7 to 5.9) at 36 weeks, 3.4 (95% CI 2.1 to 5.1) and 2.2 (95% CI 1.1 to 4.3) at 37 weeks, 10.6 (95% CI 7.1 to 15.3) and 1.5 (95% CI 0.7 to 3.3) at 38 weeks and 9.3 (95% CI 3.8 to 19.1) and 1.1 (95% CI 0.4 to 2.6) at ≥ 39 weeks (Table 1). The pooled risk differences per 1000 pregnancies were shown in figure 1. From 37 weeks, a trend was observed where the risk of stillbirth (9.6/1000) was higher than the risk of neonatal death (3.6/1000) with a risk difference of 2.5/1000.
Table 1 Prospective risk of stillbirth and risk of neonatal death in weekly intervals in uncomplicated dichorionic twin pregnancies from 34 weeks’ gestation (from Cheong-See, 2016)
|
Gestational age (weeks) |
No of stillbirths/No of ongoing pregnancies |
Crude risk of stillbirth (per 1000 pregnancies) (95% CI) |
No of neonatal deaths/No of women delivered |
Risk of neonatal death1 (per 1000 pregnancies) (95% CI) |
Pooled risk difference2 (per 1000 pregnancies) (95% CI) |
|
Dichorionic twin pregnancies (15 studies) |
|||||
|
34+0-6 |
21/17830 |
1.2 (0.7 to 1.8) |
12/1742 |
6.7 (3.3 to 13.5) |
-5.8 (-10.4 to -1.2) |
|
35+0-6 |
12/15470 |
0.8 (0.4 to 1.4) |
15/2611 |
4.6 (2.4 to 8.7) |
-5.1 (-8.7 to -1.6) |
|
36+0-6 |
18/11824 |
1.5 (0.9 to 2.4) |
12/4238 |
3.2 (1.7 to 5.9) |
-1.3 (-3.6 to 0.9) |
|
37+0-6 |
23/6824 |
3.4 (2.1 to 5.1) |
10/5141 |
2.2 (1.1 to 4.3) |
1.2 (-1.3 to 3.6) |
|
38+0-6 |
28/2633 |
10.6 (7.1 to 15.3) |
5/2581 |
1.5 (0.7 to 3.3) |
8.8 (3.6 to 14.0) |
|
39+0-6 |
7/752 |
9.3 (3.8 to 19.1) |
3/751 |
1.1 (0.4 to 2.6) |
3.8 (-8.5 to 16.1) |
1 Risk of neonatal death computed by multilevel logistic regression model.
2 Individual studies risk differences pooled by fixed effect model meta-analysis.
Figure 1 Prospective risks of stillbirths from expectant management compared with risks of neonatal mortality from delivery at weekly intervals from 34 weeks’ gestation (34+0-6; 35+0-6; 36+0-6; 37+0-6; 38+0-6; 39+0-6) in dichorionic twin pregnancies (Cheong-See, 2016)
Lee (2016) reported no neonatal deaths at any week of gestation. There was 1 fetal death (stillbirth) at 35 weeks and 2 fetal deaths at 37 weeks. The RR was calculated comparing the group dichorionic twins born ≥ 39 weeks (N=11) and the group dichorionic twins born < 39 weeks (N=515). The RR was 6.14 (95% 0.36 to 112.48).
1.2 Neonatal infection
The outcome neonatal infection was reported as septicaemia in the systematic review of Cheong-See (2016). The outcome septicaemia was provided weekly after 34 weeks’ gestation in 13 of the included trials (Awwad, 2014; Barrett, 2012; Berezowsky, 2014; Breatnach, 2011; Briery, 2009; Burgess, 2014; Combs, 2011; Hack, 2008; Lewi, 2008; Lim, 2011; Norman, 2009; Rode, 2011; Serra, 2012). The prospective risk of septicaemia was calculated for each week from 34 weeks to 39 weeks of gestation. The risk of septicaemia per 1000 deliveries in dichorionic pregnancies was 9.5 (95% CI 2.4 to 36.1) at 34 weeks, 6.4 (95% CI 1.7 to 23.5) at 35 weeks, 4.3 (95% CI 1.2 to 15.7) at 36 weeks, 2.9 (95% CI 0.8 to 10.9) at 37 weeks, 2.0 (95% CI 0.5 to 7.8) at 38 weeks and 1.3 (95% CI 0.3 to 5.8) at ≥ 39 weeks. The relative risk (RR) was calculated, comparing the group delivered before 39 weeks and the group delivered ≥ 39 weeks. There was no statistically significant difference in septicaemia between the group delivered before 39 weeks and the group delivered ≥ 39 weeks (RR 2.14; 95% CI 0.30 to 15.54).
The study of Lee (2016) did not report the outcome neonatal infection.
1.3 Apgar score of less than 7 at 5 minutes
The systematic review of Cheong-See (2016) did not report the outcome Apgar score of less than 7 at 5 minutes.
Lee (2016) reported 2 neonates (out of 242) with an Apgar score of less than 7 at 5 minutes at 37 weeks of gestation, and no cases at the other weeks of gestation.
Brincat (2017) reported only mean Apgar score at 5 minutes at each gestational week, whereby these results could not be used for this outcome.
1.4 NICU/hospital admission
The outcome NICU admission was provided weekly after 34 weeks’ gestation in 11 of the included trials (Aboulghar, 2012; Awwad, 2014; Barrett, 2012; Berezowsky, 2014; Briery, 2009; Burgess, 2014, Lewi, 2008; Liem, 2013; Lim, 2011; Norman, 2009; Rode, 2011). The prospective risk of NICU admission was calculated for each week from 34 weeks to 38 weeks of gestation. The risk of NICU admission per 1000 deliveries in dichorionic pregnancies was 492.6 (95% CI 317.4 to 669.6) at 34 weeks, 315.4 (95% CI 182.3 to 478.8) at 35 weeks, 179.5 (95% CI 95.9 to 310.9) at 36 weeks, 94.1 (95% CI 47.7 to 177.2) at 37 weeks, 47.0 (95% CI 22.9 to 94.0) at 38 weeks and 22.9 (95% CI 10.8 to 47.9) at ≥ 39 weeks. The relative risk (RR) was calculated, comparing the group delivered before 39 weeks and the group delivered ≥ 39 weeks. There was no statistically significant difference in NICU admission between the group delivered before 39 weeks and the group delivered ≥ 39 weeks (RR 4.90; 95% CI 2.07 to 11.62).
Lee (2016) reported 64 out of 515 neonates with gestational age of delivery between 35 and 38 weeks admitted to NICU and 0 out of 11 with gestational age of delivery ≥ 39 weeks. The RR was calculated comparing the group dichorionic twins born < 39 weeks (N=515) and the group dichorionic twins born ≥ 39 weeks (N=11). The RR was 3.00 (95% 0.20 to 45.68).
Brincat (2017) reported the proportion of twin neonates admitted to NICU according to gestational age at birth, without confidence interval. The proportion from 35 to 40 weeks was 43.86% (24/56) at 35 weeks, 18.89% (17/90) at 36 weeks, 11.73% (2/180) at 37 weeks, 8.03% (11/136) at 38 weeks, 25% (3/12) at 39 weeks and 0% (0/2) at 40 weeks. The RR was calculated comparing the group dichorionic twins born < 39 weeks (N=492) and the group dichorionic twins born ≥ 39 weeks (N=14). The RR was 0.80 (95% 0.29 to 2.22).
1.5 Respiratory distress syndrome (RDS)
The outcome RDS was provided weekly after 34 weeks’ gestation in 13 of the included trials. The prospective risk of RDS was calculated for each week from 34 weeks to 38 weeks of gestation. The risk of RDS per 1000 deliveries in dichorionic pregnancies was 130.1 (95% CI 77.8 to 209.6) at 34 weeks, 69.3 (95% CI 40.9 to 114.9) at 35 weeks, 35.7 (95% CI 20.8 to 60.8) at 36 weeks, 18.1 (95% CI 10.2 to 31.8) at 37 weeks, 9.1 (95% CI 4.9 to 16.7) at 38 weeks and 4.5 (95% CI 2.3 to 8.8) at ≥ 39 weeks. The relative risk (RR) was calculated, comparing the group delivered before 39 weeks and the group delivered ≥ 39 weeks. There was a statistically significant difference in RDS between the group delivered before 39 weeks and the group delivered ≥39 weeks (RR 14.2; 95% CI 2.00 to 100.91).
Lee (2016) reported 5 out of 515 neonates with gestational age of delivery between 35 and 38 weeks with RDS and 0 out of 11 with gestational age of delivery ≥ 39 weeks. The RR was calculated comparing the group dichorionic twins born < 39 weeks (N=515) and the group dichorionic twins born ≥ 39 weeks (N=11). The RR was 0.26 (95% 0.02 to 4.37).
Brincat (2017) reported the proportion of twin neonates with RDS according to gestational age at birth, without confidence interval. The proportion from 34 to 40 weeks was 36.67% at 34 weeks (11/30), 17.54% (9/56) at 35 weeks, 8.88% (8/90) at 36 weeks, 7.6% (14/180) at 37 weeks, 1.46% (2/136) at 38 weeks, 0% (0/12) at 39 weeks and 0% (0/2) at 40 weeks. The RR was calculated comparing the group dichorionic twins born < 39 weeks (N=492) and the group dichorionic twins born ≥ 39 weeks (N=14). The RR was 2.71 (95% 0.17 to 41.92).
1.6 Birthweight
Brincat (2017) resported the mean birthweight for each gestational age at delivery, without confidence interval. The mean birthtweights from 34 to 40 weeks were respectively 2300.83 kg (34 weeks), 2325.16 kg (35 weeks), 2432.64 kg (36 weeks), 2631.8 kg (37 weeks), 2697.1 kg (38 weeks), 2717.92 kg (39 weeks) and 2470 kg (40 weeks). The mean difference between < 39 weeks and ≥39 weeks was not calculated.
The systematic review of Cheong-See (2016) and Lee (2016) did not report the outcome birthweight.
1.7 Disability (long term)
The systematic review of Cheong-See (2016)) and the studies of Lee (2016) and Brincat (2017) did not report the outcome disability.
2. Maternal outcomes
2.1 Mode of delivery
The mode of delivery was shown in a graph by Brincat (2017) for each gestational week, but no quantitative data was reported, whereby these results could not be used.
The systematic review of Cheong-See (2016) and the study of Lee (2016) did not report the outcome mode of delivery.
2.2 Postpartum hemorrhage
The systematic review of Cheong-See (2016) and the studies of Lee (2016) and Brincat (2017) did not report the outcome postpartum hemorrhage.
2.3 Analgesia
The systematic review of Cheong-See (2016) and the studies of Lee (2016) and Brincat (2017) did not report the outcome analgesia.
2.4 Perineal trauma
The systematic review of Cheong-See (2016) and the studies of Lee (2016) and Brincat (2017) did not report the outcome perineal trauma.
2.5 Breastfeeding at discharge
The systematic review of Cheong-See (2016) and the studies of Lee (2016) and Brincat (2017) did not report the outcome breastfeeding at discharge.
2.6 Maternal satisfaction
The systematic review of Cheong-See (2016) and the studies of Lee (2016) and Brincat (2017) did not report the outcome maternal satisfaction.
2.7 Psychological well-being/ anxiety
The systematic review of Cheong-See (2016) and the studies of Lee (2016) and Brincat (2017) did not report the outcome psychological well-being or anxiety.
Level of evidence of the literature
The level of evidence of all defined outcomes measures started low because the evidence was based on observational cohort studies.
The level of evidence regarding the outcome measure intra-uterine and neonatal mortality was downgraded by 1 level because of imprecision (wide confidence interval and smaller sample size near term) (-1) to ‘very low’.
The level of evidence regarding the outcome measure neonatal infection was downgraded by 1 level because of imprecision (wide confidence interval and smaller sample size near term) (-1) to ‘very low’.
The level of evidence regarding the outcome measure Apgar score of less than 7 at 5 minutes was downgraded by 1 level because of imprecision (wide confidence interval and smaller sample size near term) (-1) to ‘very low’.
The level of evidence regarding the outcome measures NICU/hospital admission and RDS was downgraded by 1 level because of imprecision (wide confidence interval and smaller sample size near term) (-1) to ‘very low’.
A systematic review of the literature was performed to answer the following question:
What are the effects of elective birth in uncomplicated dichorionic twin pregnancy on maternal and neonatal outcomes compared to expectant management?
P: pregnant women with an uncomplicated dichorionic diamniotic twin pregnancy;
I: elective timing of delivery before 39 weeks;
C: expectant management;
O: neonatal outcomes: intra-uterine and neonatal mortality, infections, Apgar score < 7 at 5 minutes, hospital-/ (lenth of) Neonatale Intensive Care Unit (NICU) admission, respiratory distress syndrome (RDS), birth weight, disability (longterm).
Maternal outcomes: Mode of delivery (spontaneous vaginal, instrumental or caesarean sectio, failure to progress, or fetal distress), maternal death, postpartum hemorrhage, analgesia, perineal trauma, breastfeeding at discharge, maternal satisfaction, psychological well-being/ anxiety.
Relevant outcome measures
The guideline development group considered intra-uterine and neonatal mortality as a critical outcome measure for decision making; and the other outcomes as important outcome measures for decision making.
A priori, the working group did not define the outcome measures listed above but used the definitions used in the studies.
A priori, the working group did not define minimal clinically (patient) important differences for the outcome measures, as small changes in intra-uterine or neonatal death can have a huge impact on quality of care.
Search and select (Methods)
A combined search was performed for the questions about monochorionic twins and dichorionic twins. The databases Medline (via OVID) and Embase (via Embase.com) were searched with relevant search terms until December 12th, 2019. The detailed search strategy is depicted under the tab Methods. The systematic literature search resulted in 543 hits. Studies were selected based on the following criteria:
- The study population had to meet the criteria as defined in the PICO.
- Intervention as defined in the PICO.
- Original research or systematic review.
To answer the question about dichorionic twins, 26 studies were initially selected based on title and abstract screening. After reading the full text, 23 were excluded (see the table with reasons for exclusion under the tab Methods) and three were included.
Results
One systematic review and two additional studies were included in the analysis of the literature. Important study characteristics and results are summarized in the evidence tables. The assessment of the risk of bias is summarized in the risk of bias tables.
- Brincat, M. R., Sant, M., & Calleja, N. (2017). Optimal gestational age for delivery in uncomplicated dichorionic twin pregnancies: a population-based study. Malta Medical Journal, 29(01).
- Cheong-See, F., Schuit, E., Arroyo-Manzano, D., Khalil, A., Barrett, J., Joseph, K. S.,... & Liem, S. (2016). Prospective risk of stillbirth and neonatal complications in twin pregnancies: systematic review and meta-analysis. bmj, 354, i4353.
- Lee, H. J., Kim, S. H., Chang, K. H. J., Sung, J. H., Choi, S. J., Oh, S. Y.,... & Kim, J. H. (2016). Gestational age at delivery and neonatal outcome in uncomplicated twin pregnancies: what is the optimal gestational age for delivery according to chorionicity?. Obstetrics & gynecology science, 59(1), 9-16.
Evidence table for systematic review of RCTs and observational studies (intervention studies)
|
Study reference |
Study characteristics |
Patient characteristics |
Intervention (I) |
Comparison / control (C) |
Follow-up |
Outcome measures and effect size |
Comments |
|
Cheong-See, 2016
|
SR and meta-analysis of observational cohort studies and cohorts nested in RCTs
Literature search up to December 2015
Studies included: 32 trials, from which 25 studies about dichorionic twins
A: Alboulghar, 2012 B: Awwad, 2014 C: Barrett, 2012 D: Bhattachary, 2015 E: Breatnach, 2011 F: Briery, 2009 G: Burgess, 2014 H: Combs, 2011 I: Dodd, 2012 J: Domingues, 2009 K: Hack, 2008 L: Lee, 2008 M: Liem, 2013 N: Lim, 2011 O: Mahony, 2011 P: McPherson, 2012 Q: Morikawa, 2012 R: Norman, 2009 S: Rode, 2011 T: Rouse, 2007 U: Russo, 2013 V: Serra, 2012 W: STORK, 2012 X: Suzuki, 2010 Y: Wood, 2015
Study design: Retrospective cohort: B, E, G, I, J, K, L, M, Q, R, S, W, X, Y Prospective cohort: D, F, N, Prospective RCT: A, C, H, O, P, T, U, V
Setting and Country: A: Egypt, single centre B: Lebanon, single centre C: 25 countries, 106 centres D: UK, single centre E: Ireland, multicentre F: USA, single centre G: USA, single centre H: USA, 18 centres I: Australia, New Zealand, 13 centres J: Portugal, single centre K: Netherlands, 2 centres L: USA, single centre M: Netherlands, 40 centres N: Netherlands, 55 centres O: Ireland, single centre P: USA, single centre Q: Japan, 120 centres R: UK, 9 centres S: Denmark and Austria, 17 centres T: USA, 14 centres U: Italy, single centre V: Spain, 5 centres W: UK, 9 centres X: Japan, single centre Y: Canada, 81 centres
Source of funding and conflicts of interest: Non-commercial funding, no conflicts of interests were reported.
|
Inclusion criteria SR: observational cohort studies and cohorts nested in randomised studies on rates of stillbirth or neonatal outcomes in monochorionic and/or dichorionic twin pregnancies
Exclusion criteria SR: Unclear chorionicity, monoamnionicity, inability to exclude twin to twin transfusion syndrome in fetuses, and outcomes not provided in weekly or two weekly gestational periods
Important patient characteristics at baseline: Number of patients; characteristics important to the research question
N, patients: A: N=88 B: N=39 C: N=660 D: N=422 E: N=185 F: N=25 G: N=167 H: N=236 I: N=40 J: N=111 K: N=119 L: N=130 M: N=173 N: N=109 O: N=194 P: N=471 Q: N=6467 R: N=89 S: N=99 T: N=92 U: N=207 V: N=283 W: N=527 X: N=274 Y: N=6722
Groups comparable at baseline? Not reported |
No intervention performed.
|
No control group.
|
End-point of follow-up:
A: 20 week to delivery B: 20 weeks until delivery and Discharge of babies from hospital C: 32 to >40 weeks D: 26 weeks until delivery E: 26 weeks until delivery F: 20 weeks until delivery or maternal discharge G: 34 to ≥39 weeks H: from enrolment to postdelivery I: 36+6 weeks to over 39+ weeks J: 24 to 35+6 weeks K: 26 to >40 weeks L: 24 to >38 weeks M: 26 to 39+6 weeks N: 15-19 weeks until 6 weeks after delivery O: 24 to >38 weeks P: 20 to >38 weeks Q: 26 to >40 weeks R: 20 weeks until delivery S: 18 to 24 weeks until delivery (infants until 18 months post EDD) T: 16 weeks til delivery U: 26 to >40 weeks V: 20 weeks until delivery W: 26 to >40 weeks X: 26 to >40 weeks Y: 23 to >40 weeks
For how many participants were no complete outcome data available? Not reported
|
Neonatal outcomes: 1. Perinatal death Defined as neonatal death: death up to 28 days after delivery
Effect measure: number of neonatal deaths/ number of women delivered 35+0-6: 15/2611 36+0-6: 12/4238 37+0-6: 10/5141 38+0-6: 5/2581 39+0-6: 3/751
Effect measure: risk of neonatal death per 1000 pregnancies (95% CI) 34+0-6: 6.7 (3.3 to 13.5) 35+0-6: 4.6 (2.4 to 7.8) 36+0-6: 3.2 (1.7 to 5.9) 37+0-6: 2.2 (1.1 to 4.3) 38+0-6: 1.5 (0.7 to 3.3) 39+0-6: 1.1 (0.4 to 2.6)
Defined as risk of stillbirth: baby born without signs of life after the age of viability
Effect measure: crude risk of stillbirth per 1000 pregnancies (95% CI) 34+0-6: 1.2 (0.7 to 1.8) 35+0-6: 0.8 (0.4 to 1.4) 36+0-6: 1.5 (0.9 to 2.4) 37+0-6: 3.4 (2.1 to 5.1) 38+0-6: 10.6 (7.1 to 15.3) 39+0-6: 9.3 (3.8 to 19.1)
Effect measure: pooled risk difference per 1000 pregnancies (95% CI) 34+0-6: −5.8 (−10.4 to -1.2) 35+0-6: −5.1 (−8.7 to -1.6) 36+0-6: −1.3 (−3.6 to 0.9) 37+0-6: 1.2 (−1.3 to 3.6) 38+0-6: 8.8 (3.6 to 14.0) 39+0-6: 3.8 (-8.5 to 16.1)
2. Neonatal infection Defined as septicaemia
Effect measure: n/N (in 11 studies) 34+0-6: 11/465 35+0-6: 6/659 36+0-6: 10/943 37+0-6: 8/1447 38+0-6: 7/1081 39+0-6: 1/235
Effect measure: risk/1000 deliveries (95% CI) 34+0-6: 9.5 (2.4 to 36.1) 35+0-6: 6.4 (1.7 to 23.5) 36+0-6: 4.3 (1.2 to 15.7) 37+0-6: 2.9 (0.8 to 10.9) 38+0-6: 2.0 (0.5 to 7.8) 39+0-6: 1.3 (0.3 to 5.8)
3. Apgar score of less than 7 at 5 minutes Not reported
4. NICU/hospital admission Defined as NICU admission
Effect measure: n/N (in 11 studies) 34+0-6: 181/401 35+0-6: 179/577 36+0-6: 152/853 37+0-6: 154/1296 38+0-6: 77/932 39+0-6: 5/134
Effect measure: risk/1000 deliveries (95% CI) 34+0-6: 492.6 (317.4 to 669.6) 35+0-6: 315.4 (182.3 to 478.8) 36+0-6: 179.5 (95.9 to 310.9) 37+0-6: 94.1 (47.7 to 177.2) 38+0-6: 47.0 (22.9 to 94.0) 39+0-6: 22.9 (10.8 to 47.9)
5. RDS Effect measure: n/N (in 13 studies) 34+0-6: 94/940 35+0-6: 63/695 36+0-6: 49/1013 37+0-6: 46/1563 38+0-6: 17/1120 39+0-6: 1/258
Effect measure: risk/1000 deliveries (95% CI) 34+0-6: 130.1 (77.8 to 209.6) 35+0-6: 69.3 (40.9 to 114.9) 36+0-6: 35.7 (20.8 to 60.8) 37+0-6: 18.1 (10.2 to 31.8) 38+0-6: 9.1 (4.9 to 16.7) 39+0-6: 4.5 (2.3 to 8.8)
6. Birthweight Not reported
7. Disability (long term) Not reported
Maternal outcomes: No maternal outcomes reported. |
Brief description of author’s conclusion: To minimise perinatal deaths, in uncomplicated dichorionic twin pregnancies delivery should be considered at 37 weeks’ gestation.
Level of evidence: The quality of the studies was adequately representative in 27/32 (84%) and inadequately or unclearly representative in 5/32 (16%). 20 studies (63%) had a low risk of misclassification bias for assessment of gestational age and 25/32 (78%) low risk for determination of chorionicity.
|
Evidence table for intervention studies (randomized controlled trials and non-randomized observational studies (cohort studies, case-control studies, case series))1
This table is also suitable for diagnostic studies (screening studies) that compare the effectiveness of two or more tests. This only applies if the test is included as part of a test-and-treat strategy - otherwise the evidence table for studies of diagnostic test accuracy should be used.
Notes:
- Prognostic balance between treatment groups is usually guaranteed in randomized studies, but non-randomized (observational) studies require matching of patients between treatment groups (case-control studies) or multivariate adjustment for prognostic factors (confounders) (cohort studies); the evidence table should contain sufficient details on these procedures.
- Provide data per treatment group on the most important prognostic factors ((potential) confounders).
- For case-control studies, provide sufficient detail on the procedure used to match cases and controls.
- For cohort studies, provide sufficient detail on the (multivariate) analyses used to adjust for (potential) confounders.
Table of quality assessment for systematic reviews of RCTs and observational studies
Based on AMSTAR checklist (Shea, 2007; BMC Methodol 7: 10; doi:10.1186/1471-2288-7-10) and PRISMA checklist (Moher, 2009; PLoS Med 6: e1000097; doi:10.1371/journal.pmed1000097)
|
Study
First author, year |
Appropriate and clearly focused question?1
Yes/no/unclear |
Comprehensive and systematic literature search?2
Yes/no/unclear |
Description of included and excluded studies?3
Yes/no/unclear |
Description of relevant characteristics of included studies?4
Yes/no/unclear |
Appropriate adjustment for potential confounders in observational studies?5
Yes/no/unclear/notapplicable |
Assessment of scientific quality of included studies?6
Yes/no/unclear |
Enough similarities between studies to make combining them reasonable?7
Yes/no/unclear |
Potential risk of publication bias taken into account?8
Yes/no/unclear |
Potential conflicts of interest reported?9
Yes/no/unclear |
|
Cheong-See, 2016 |
Yes |
Yes |
No, excluded studies not described |
Yes |
Yes |
Yes |
Yes |
Yes |
No, not for the included studies |
- Research question (PICO) and inclusion criteria should be appropriate and predefined.
- Search period and strategy should be described; at least Medline searched; for pharmacological questions at least Medline + EMBASE searched.
- Potentially relevant studies that are excluded at final selection (after reading the full text) should be referenced with reasons.
- Characteristics of individual studies relevant to research question (PICO), including potential confounders, should be reported.
- Results should be adequately controlled for potential confounders by multivariate analysis (not applicable for RCTs).
- Quality of individual studies should be assessed using a quality scoring tool or checklist (Jadad score, Newcastle-Ottawa scale, risk of bias table et cetera).
- Clinical and statistical heterogeneity should be assessed; clinical: enough similarities in patient characteristics, intervention and definition of outcome measure to allow pooling? For pooled data: assessment of statistical heterogeneity using appropriate statistical tests (for example Chi-square, I2)?
- An assessment of publication bias should include a combination of graphical aids (for example funnel plot, other available tests) and/or statistical tests (for example Egger regression test, Hedges-Olken). Note: If no test values or funnel plot included, score “no”. Score “yes” if mentions that publication bias could not be assessed because there were fewer than 10 included studies.
- Sources of support (including commercial co-authorship) should be reported in both the systematic review and the included studies. Note: To get a “yes,” source of funding or support must be indicated for the systematic review AND for each of the included studies.
Risk of bias table for intervention studies (observational: non-randomized clinical trials, cohort and case-control studies)
|
Study reference
(first author, year of publication) |
Bias due to a non-representative or ill-defined sample of patients?1
(unlikely/likely/unclear) |
Bias due to insufficiently long, or incomplete follow-up, or differences in follow-up between treatment groups?2
(unlikely/likely/unclear) |
Bias due to ill-defined or inadequately measured outcome?3
(unlikely/likely/unclear) |
Bias due to inadequate adjustment for all important prognostic factors?4
(unlikely/likely/unclear) |
|
Lee, 2016 |
Unlikely |
Unclear, follow-up time not reported |
Unlikely |
Unlikely |
|
Brincat, 2017 |
Unlikely |
Unlikely |
Unlikely |
Unlikely |
- Failure to develop and apply appropriate eligibility criteria: a) case-control study: under- or over-matching in case-control studies; b) cohort study: selection of exposed and unexposed from different populations.
- 2 Bias is likely if: the percentage of patients lost to follow-up is large; or differs between treatment groups; or the reasons for loss to follow-up differ between treatment groups; or length of follow-up differs between treatment groups or is too short. The risk of bias is unclear if: the number of patients lost to follow-up; or the reasons why, are not reported.
- Flawed measurement, or differences in measurement of outcome in treatment and control group; bias may also result from a lack of blinding of those assessing outcomes (detection or information bias). If a study has hard (objective) outcome measures, like death, blinding of outcome assessment is not necessary. If a study has “soft” (subjective) outcome measures, like the assessment of an X-ray, blinding of outcome assessment is necessary.
- Failure to adequately measure all known prognostic factors and/or failure to adequately adjust for these factors in multivariate statistical analysis.
Table of excluded studies
|
Author and year |
Reason for exclusion |
|
Sung 2016 |
Wrong comparison: <37 weeks vs ≥37 weeks |
|
Murray 2019 |
Wrong study design: Chorionicity as covariate in model. No comparison <37 weeks and >37 weeks. |
|
Ko 2018 |
No distinction between mono and dicho |
|
Saccone 2016 |
No distinction between mono and dicho |
|
Berezowsky 2016 |
Included in Cheong-See 2016. Observational study |
|
Page 2015 |
No distinction between monochorionic and dichorionic |
|
Vilchez 2015 |
wrong comparison: 37 weeks not included in analysis. Twin pregnancy compared to singleton pregnancy. No distinction between monochorionic and dichorionic |
|
Burgess 2014 |
Included in Cheong-See 2016. |
|
Dias 2014 |
Non systematic review: overview article |
|
Dodd 2014 |
No distinction between monochorionic and dichorionic. Only 2 RCT's included (Dodd 2012, Suzuki, 2000) |
|
Ganchimeg 2014 |
Before search date (dec 2015) Cheong-See, 2016 |
|
D'Antonio 2013 |
Before search date (dec 2015) Cheong-See, 2017 |
|
Vergani 2013 |
Before search date (dec 2015) Cheong-See, 2018 |
|
Dodd 2012 |
Included in Cheong-See 2016. |
|
Doss 2012 |
Before search date (dec 2015) Cheong-See, 2017 |
|
Sela 2012 |
Before search date (dec 2015) Cheong-See, 2017 |
|
Sullivan 2012 |
Before search date (dec 2015) Cheong-See, 2017 |
|
Jha 2011 |
Before search date (dec 2015) Cheong-See, 2017 |
|
Vayssiere 2011 |
Before search date (dec 2015) Cheong-See, 2017 |
|
Zipori 2011 |
Before search date (dec 2015) Cheong-See, 2017 |
|
Dodd 2010 |
Protocol for RCT about the optimal time of birth for women with an uncomplicated multiple pregnancy at and beyond 37 weeks gestation |
|
Lopriore 2008 |
Before search date (dec 2015) Cheong-See, 2017 |
|
Soong 2016 |
Wrong study design: retrospective study of characteristics >32 weeks gestation, no comparison <37 vs >37 weeks |
Beoordelingsdatum en geldigheid
Publicatiedatum : 25-07-2022
Beoordeeld op geldigheid : 25-07-2022
|
Module[1] |
Regiehouder(s)[2] |
Jaar van autorisatie |
Eerstvolgende beoordeling actualiteit richtlijn[3] |
Frequentie van beoordeling op actualiteit[4] |
Wie houdt er toezicht op actualiteit[5] |
Relevante factoren voor wijzigingen in aanbeveling[6] |
|
Optimale termijn bevalling dichoriale tweelingen |
NVOG |
2022 |
2027 |
5 jaar |
NVOG |
Nieuwe literatuur |
[1] Naam van de module
[2] Regiehouder van de module (deze kan verschillen per module en kan ook verdeeld zijn over meerdere regiehouders)
[3] Maximaal na vijf jaar
[4] (half)Jaarlijks, eens in twee jaar, eens in vijf jaar
[5] regievoerende vereniging, gedeelde regievoerende verenigingen, of (multidisciplinaire) werkgroep die in stand blijft
[6] Lopend onderzoek, wijzigingen in vergoeding/organisatie, beschikbaarheid nieuwe middelen
Algemene gegevens
De ontwikkeling van deze richtlijnmodules werd ondersteund door het Kennisinstituut van de Federatie Medisch Specialisten (www.demedischspecialist.nl/kennisinstituut) en werd gefinancierd uit de Stichting Kwaliteitsgelden Medisch Specialisten (SKMS). De financier heeft geen enkele invloed gehad op de inhoud van de richtlijnmodule.
De richtlijn is ontwikkeld in samenwerking met:
- Nederlandse Vereniging voor Kindergeneeskunde
- Koninklijke Nederlandse Organisatie van Verloskundigen
- Nederlandse Vereniging voor Anesthesiologie
- Patiëntenfederatie Nederland
- Nederlandse Vereniging voor Ouders van Meerlingen
Samenstelling werkgroep
Voor het ontwikkelen van de richtlijnmodule is in 2019 een werkgroep ingesteld, bestaande uit vertegenwoordigers van alle relevante specialismen die betrokken zijn bij de zorg voor vrouwen zwanger van een meerling.
Werkgroep
- Dr. C.J. (Caroline) Bax, gynaecoloog-perinatoloog, werkzaam in het Amsterdam UMC te Amsterdam, NVOG (voorzitter)
- Dr. K.E.A. (Karien) Hack, gynaecoloog, werkzaam in Gelre Ziekenhuizen, locatie Apeldoorn, NVOG
- Dr. J.M. (Annemieke) Middeldorp, gynaecoloog-perinatoloog, werkzaam in het Leids Universitair Medisch Centrum te Leiden, NVOG
- Dr. M. (Marieke) Sueters, gynaecoloog, werkzaam in het Leids Universitair Medisch Centrum te Leiden, NVOG
- Dr. P.L.J. (Philip) DeKoninck, gynaecoloog-perinatoloog, werkzaam in het ErasmusMC Sophia te Rotterdam, NVOG
- Dr. J.B. (Jan) Derks, gynaecoloog-perinatoloog, werkzaam in het UMC Utrecht te Utrecht, NVOG
- Prof. dr. E. (Enrico) Lopriore, kinderarts-neonatoloog, werkzaam in het Leids Universitair Medisch Centrum te Leiden, NVK
- Drs. M.L. (Mark) van Zuylen, anesthesioloog, werkzaam in het Amsterdam UMC te Amsterdam, NVA
- Drs. I.C.M. (Ingrid) Beenakkers, anesthesioloog, werkzaam in het UMC Utrecht te Utrecht, NVA
- H. (Hanna) den Hartog-van Veen, zelfstandig verloskundige te Alphen aan den Rijn, KNOV
- J. (Jolein) Vernooij, klinisch verloskundige, werkzaam in het OLVG te Amsterdam, KNOV
- J.C. (Anne) Mooij, MSc, adviseur, Patientenfederatie Nederland
- Dr. S.V. (Steven) Koenen, gynaecoloog, werkzaam in het ETZ, locatie Elisabeth Ziekenhuis, NVOG, lid stuurgroep
- Dr. J.J. (Hans) Duvekot, gynaecoloog, werkzaam in het Erasmus MC, NVOG, lid stuurgroep
Meelezers
- J. (José) van Bijsterveld, Nederlandse Vereniging voor Ouders van Meerlingen
- J.D.M. (Jacobien) Wagemaker, MSc, Care4Neo
- Leden van de Otterlo-werkgroep (2020)
Met ondersteuning van
- Dr. J. (Janneke) Hoogervorst-Schilp, adviseur, Kennisinstituut van de Federatie Medisch Specialisten
- Dr. L. (Laura) Viester, adviseur, Kennisinstituut van de Federatie Medisch Specialisten
- Dr. M.A.C. (Marleen) van Son, adviseur, Kennisinstituut van de Federatie Medisch Specialisten
- Dr. W.J. (Wouter) Harmsen, adviseur, Kennisinstituut van de Federatie Medisch Specialisten
Belangenverklaringen
De Code ter voorkoming van oneigenlijke beïnvloeding door belangenverstrengeling is gevolgd. Alle werkgroepleden hebben schriftelijk verklaard of zij in de laatste drie jaar directe financiële belangen (betrekking bij een commercieel bedrijf, persoonlijke financiële belangen, onderzoeksfinanciering) of indirecte belangen (persoonlijke relaties, reputatiemanagement) hebben gehad. Gedurende de ontwikkeling of herziening van een module worden wijzigingen in belangen aan de voorzitter doorgegeven. De belangenverklaring wordt opnieuw bevestigd tijdens de commentaarfase.
Een overzicht van de belangen van werkgroepleden en het oordeel over het omgaan met eventuele belangen vindt u in onderstaande tabel. De ondertekende belangenverklaringen zijn op te vragen bij het secretariaat van het Kennisinstituut van de Federatie Medisch Specialisten.
|
Werkgroeplid |
Functie |
Nevenwerkzaamheden |
Gemelde belangen |
Actie |
|
Bax* |
Gynaecoloog-perinatoloog Amsterdam UMC |
Gastvrouw Hospice Xenia Leiden (onbetaald) |
Geen |
Geen actie |
|
Beenakkers |
Anesthesioloog UMCU/WKZ |
Geen |
Geen |
Geen actie |
|
DeKoninck |
Gynaecoloog, Erasmus MC |
Geen |
Geen |
Geen actie |
|
Derks |
Gynaecoloog/ perinatoloog |
Geen |
Geen |
Geen actie |
|
Duvekot |
Gynaecoloog, Erasmus MC |
Directeur 'Medisch Advies en Expertise Bureau Duvekot', Ridderkerk, ZZP'er |
Geen |
Geen actie |
|
Hack |
Gynaecoloog, Gelre Ziekenhuizen Apeldoorn |
Bestuurslid Werkgroep Klinische Verloskunde (NVOG) - onbetaald |
|
Geen actie |
|
Koenen |
Gynaecoloog, ETZ Tilburg |
Incidenteel juridische expertise (betaald) |
Geen |
Geen actie |
|
Lopriore |
Hoofd afdeling neonatologie LUMC sinds 2013 hoogleraar neonatologie, in het bijzonder foetale geneeskunde sinds 2016 |
Geen |
Geen |
Geen actie |
|
Middeldorp |
Leids Universitair Medisch Centrum |
Geen |
LUMC is nationaal verwijscentrum voor foetale behandeling, dus ook voor de behandeling van gecompliceerde monochoriale zwangerschappen. |
Geen actie |
|
Mooij |
Adviseur Patientenbelang, Patientenfederatie Nederland |
Geen |
Geen |
Geen actie |
|
Sueters |
Gynaecoloog, LUMC |
Geen |
Geen |
Geen actie |
|
Van Zuylen |
Anesthesioloog i.o. Amsterdam UMC- locatie AMC |
Geen |
Geen |
Geen actie |
|
Van Veen |
1e lijns verloskundige, zzp'er, waarneemster voor Vivre praktijk voor verloskunde en echoscopie in Alphen a/d Rijn |
Sensiplanconsulente: cursussen geven, vrijwilligersvergoeding. Toetsgroepbegeleider: voor 1e lijns verloskundigen, onbetaald |
Geen |
Geen actie |
|
Vernooij |
Klinisch verloskundige (1fte) - Physician Assistant in opleiding - klinisch verloskundige Werkgever: OLVG locatie Oost, Amsterdam |
Geen |
Geen |
Geen actie |
*Voorzitter werkgroep
Inbreng patiëntenperspectief
Er werd aandacht besteed aan het patiëntenperspectief door vertegenwoordigers van de Patiëntenfederatie Nederland en de Nederlandse Vereniging voor Ouders van Meerlingen af te vaardigen in de clusterwerkgroep. De conceptrichtlijn werd tevens ter commentaar voorgelegd aan de betrokken patiëntenverenigingen.
Methode ontwikkeling
Evidence based
Werkwijze
AGREE
Deze richtlijnmodules zijn opgesteld conform de eisen vermeld in het rapport Medisch Specialistische Richtlijnen 2.0 van de adviescommissie Richtlijnen van de Raad Kwaliteit. Dit rapport is gebaseerd op het AGREE II instrument (Appraisal of Guidelines for Research & Evaluation II; Brouwers, 2010).
Knelpuntenanalyse
Tijdens de voorbereidende fase inventariseerden de voorzitter van de werkgroep en de adviseur de knelpunten. Tevens is er een knelpunteninventarisatie gedaan in november 2018 middels een Invitational conference met onder andere meerlingen als onderwerp.
Uitgangsvragen en uitkomstmaten
Op basis van de uitkomsten van de knelpuntenanalyse zijn door de voorzitter en de adviseur concept-uitgangsvragen opgesteld. Deze zijn met de werkgroep besproken waarna de werkgroep de definitieve uitgangsvragen heeft vastgesteld. Vervolgens inventariseerde de werkgroep per uitgangsvraag welke uitkomstmaten voor de patiënt relevant zijn, waarbij zowel naar gewenste als ongewenste effecten werd gekeken. De werkgroep waardeerde deze uitkomstmaten volgens hun relatieve belang bij de besluitvorming rondom aanbevelingen, als cruciaal (kritiek voor de besluitvorming), belangrijk (maar niet cruciaal) en onbelangrijk. Tevens definieerde de werkgroep tenminste voor de cruciale uitkomstmaten welke verschillen zij klinisch (patiënt) relevant vonden.
Methode literatuursamenvatting
Een uitgebreide beschrijving van de strategie voor zoeken en selecteren van literatuur en de beoordeling van de risk-of-bias van de individuele studies is te vinden onder ‘Zoeken en selecteren’ onder Onderbouwing. De beoordeling van de kracht van het wetenschappelijke bewijs wordt hieronder toegelicht.
Beoordelen van de kracht van het wetenschappelijke bewijs
De kracht van het wetenschappelijke bewijs werd bepaald volgens de GRADE-methode. GRADE staat voor ‘Grading Recommendations Assessment, Development and Evaluation’ (zie http://www.gradeworkinggroup.org/). De basisprincipes van de GRADE-methodiek zijn: het benoemen en prioriteren van de klinisch (patiënt) relevante uitkomstmaten, een systematische review per uitkomstmaat, en een beoordeling van de bewijskracht per uitkomstmaat op basis van de acht GRADE-domeinen (domeinen voor downgraden: risk of bias, inconsistentie, indirectheid, imprecisie, en publicatiebias; domeinen voor upgraden: dosis-effect relatie, groot effect, en residuele plausibele confounding).
GRADE onderscheidt vier gradaties voor de kwaliteit van het wetenschappelijk bewijs: hoog, redelijk, laag en zeer laag. Deze gradaties verwijzen naar de mate van zekerheid die er bestaat over de literatuurconclusie, in het bijzonder de mate van zekerheid dat de literatuurconclusie de aanbeveling adequaat ondersteunt (Schünemann, 2013; Hultcrantz, 2017).
|
GRADE |
Definitie |
|
Hoog |
|
|
Redelijk |
|
|
Laag |
|
|
Zeer laag |
|
Bij het beoordelen (graderen) van de kracht van het wetenschappelijk bewijs in richtlijnen volgens de GRADE-methodiek spelen grenzen voor klinische besluitvorming een belangrijke rol (Hultcrantz, 2017). Dit zijn de grenzen die bij overschrijding aanleiding zouden geven tot een aanpassing van de aanbeveling. Om de grenzen voor klinische besluitvorming te bepalen moeten alle relevante uitkomstmaten en overwegingen worden meegewogen. De grenzen voor klinische besluitvorming zijn daarmee niet één op één vergelijkbaar met het minimaal klinisch relevant verschil (Minimal Clinically Important Difference, MCID). Met name in situaties waarin een interventie geen belangrijke nadelen heeft en de kosten relatief laag zijn, kan de grens voor klinische besluitvorming met betrekking tot de effectiviteit van de interventie bij een lagere waarde (dichter bij het nuleffect) liggen dan de MCID (Hultcrantz, 2017).
Overwegingen (van bewijs naar aanbeveling)
Om te komen tot een aanbeveling zijn naast (de kwaliteit van) het wetenschappelijke bewijs ook andere aspecten belangrijk en worden meegewogen, zoals aanvullende argumenten uit bijvoorbeeld de biomechanica of fysiologie, waarden en voorkeuren van patiënten, kosten (middelenbeslag), aanvaardbaarheid, haalbaarheid en implementatie. Deze aspecten zijn systematisch vermeld en beoordeeld (gewogen) onder het kopje ‘Overwegingen’ en kunnen (mede) gebaseerd zijn op expert opinion. Hierbij is gebruik gemaakt van een gestructureerd format gebaseerd op het evidence-to-decision framework van de internationale GRADE Working Group (Alonso-Coello, 2016a; Alonso-Coello, 2016b). Dit evidence-to-decision framework is een integraal onderdeel van de GRADE-methodiek.
Formuleren van aanbevelingen
De aanbevelingen geven antwoord op de uitgangsvraag en zijn gebaseerd op het beschikbare wetenschappelijke bewijs en de belangrijkste overwegingen, en een weging van de gunstige en ongunstige effecten van de relevante interventies. De kracht van het wetenschappelijk bewijs en het gewicht dat door de werkgroep wordt toegekend aan de overwegingen, bepalen samen de sterkte van de aanbeveling. Conform de GRADE-methodiek sluit een lage bewijskracht van conclusies in de systematische literatuuranalyse een sterke aanbeveling niet a priori uit, en zijn bij een hoge bewijskracht ook zwakke aanbevelingen mogelijk (Agoritsas, 2017; Neumann, 2016). De sterkte van de aanbeveling wordt altijd bepaald door weging van alle relevante argumenten tezamen. De werkgroep heeft bij elke aanbeveling opgenomen hoe zij tot de richting en sterkte van de aanbeveling zijn gekomen.
In de GRADE-methodiek wordt onderscheid gemaakt tussen sterke en zwakke (of conditionele) aanbevelingen. De sterkte van een aanbeveling verwijst naar de mate van zekerheid dat de voordelen van de interventie opwegen tegen de nadelen (of vice versa), gezien over het hele spectrum van patiënten waarvoor de aanbeveling is bedoeld. De sterkte van een aanbeveling heeft duidelijke implicaties voor patiënten, behandelaars en beleidsmakers (zie onderstaande tabel). Een aanbeveling is geen dictaat, zelfs een sterke aanbeveling gebaseerd op bewijs van hoge kwaliteit (GRADE-gradering HOOG) zal niet altijd van toepassing zijn, onder alle mogelijke omstandigheden en voor elke individuele patiënt.
|
Implicaties van sterke en zwakke aanbevelingen voor verschillende richtlijngebruikers |
||
|
|
Sterke aanbeveling |
Zwakke (conditionele) aanbeveling |
|
Voor patiënten |
De meeste patiënten zouden de aanbevolen interventie of aanpak kiezen en slechts een klein aantal niet. |
Een aanzienlijk deel van de patiënten zouden de aanbevolen interventie of aanpak kiezen, maar veel patiënten ook niet. |
|
Voor behandelaars |
De meeste patiënten zouden de aanbevolen interventie of aanpak moeten ontvangen. |
Er zijn meerdere geschikte interventies of aanpakken. De patiënt moet worden ondersteund bij de keuze voor de interventie of aanpak die het beste aansluit bij zijn of haar waarden en voorkeuren. |
|
Voor beleidsmakers |
De aanbevolen interventie of aanpak kan worden gezien als standaardbeleid. |
Beleidsbepaling vereist uitvoerige discussie met betrokkenheid van veel stakeholders. Er is een grotere kans op lokale beleidsverschillen. |
Organisatie van zorg
In de knelpuntenanalyse en bij de ontwikkeling van de richtlijnmodule is expliciet aandacht geweest voor de organisatie van zorg: alle aspecten die randvoorwaardelijk zijn voor het verlenen van zorg (zoals coördinatie, communicatie, (financiële) middelen, mankracht en infrastructuur). Randvoorwaarden die relevant zijn voor het beantwoorden van deze specifieke uitgangsvraag zijn genoemd bij de overwegingen.
Commentaar- en autorisatiefase
De conceptrichtlijnmodules worden aan de betrokken (wetenschappelijke) verenigingen en (patiënt) organisaties voorgelegd ter commentaar. De commentaren worden verzameld en besproken met de werkgroep. Naar aanleiding van de commentaren worden de conceptrichtlijnmodules aangepast en definitief vastgesteld door de werkgroep. De definitieve richtlijnmodules worden aan de deelnemende (wetenschappelijke) verenigingen en (patiënt) organisaties voorgelegd voor autorisatie en door hen geautoriseerd dan wel geaccordeerd.
Literatuur
Agoritsas, T., Merglen, A., Heen, A. F., Kristiansen, A., Neumann, I., Brito, J. P.,... & Guyatt, G. H. (2017). UpToDate adherence to GRADE criteria for strong recommendations: an analytical survey. BMJ open, 7(11).
Alonso-Coello, P., Schünemann, H. J., Moberg, J., Brignardello-Petersen, R., Akl, E. A., Davoli, M.,... & Morelli, A. (2018). GRADE Evidence to Decision (EtD) frameworks: a systematic and transparent approach to making well informed healthcare choices. 1: Introduction. Gaceta sanitaria, 32(2), 166-e1.
Brouwers, M. C., Kho, M. E., Browman, G. P., Burgers, J. S., Cluzeau, F., Feder, G.,... & Littlejohns, P. (2010). AGREE II: advancing guideline development, reporting and evaluation in health care. Cmaj, 182(18), E839-E842.
Hultcrantz, M., Rind, D., Akl, E. A., Treweek, S., Mustafa, R. A., Iorio, A.,... & Katikireddi, S. V. (2017). The GRADE Working Group clarifies the construct of certainty of evidence. Journal of clinical epidemiology, 87, 4-13.
Richtlijnen, A., & Kwaliteit, R. (2012). Medisch specialistische richtlijnen 2.0. Utrecht: Orde van Medisch Specialisten.
https://richtlijnendatabase.nl/over_deze_site/richtlijnontwikkeling.html.
Neumann, I., Santesso, N., Akl, E. A., Rind, D. M., Vandvik, P. O., Alonso-Coello, P.,... & Guyatt, G. H. (2016). A guide for health professionals to interpret and use recommendations in guidelines developed with the GRADE approach. Journal of clinical epidemiology, 72, 45-55.
Schünemann, H., Brożek, J., Guyatt, G., & Oxman, A. (2013). GRADE handbook for grading quality of evidence and strength of recommendations. Updated October 2013. The GRADE Working Group, 2013. Available from guidelinedevelopment. org/handbook. Available from http://gdt.guidelinedevelopment.org/central_prod/_design/client/handbook/handbook.html.
Schünemann, H. J., Oxman, A. D., Brozek, J., Glasziou, P., Jaeschke, R., Vist, G. E.,... & Bossuyt, P. (2008). Grading quality of evidence and strength of recommendations for diagnostic tests and strategies. Bmj, 336(7653), 1106-1110.
Wessels, M., Hielkema, L., & van der Weijden, T. (2016). How to identify existing literature on patients' knowledge, views, and values: the development of a validated search filter. Journal of the Medical Library Association: JMLA, 104(4), 320.
Zoekverantwoording
|
Uitgangsvraag: Wat is de optimale timing voor electieve inductie bij een ongecompliceerde monochoriale (UV3)/dichoriale (UV4) biamniotische gemelli zwangerschap ten opzichte van afwachtend beleid? |
|
|
Database(s): Medline, Embase |
Datum: 17 december 2019 |
|
Periode: 2008 - current |
Talen: Engels |
|
Database |
Zoektermen |
Totaal |
|
Medline (OVID)
|
1 exp Pregnancy, Multiple/ or exp Multiple Birth Offspring/ or twin*.ti,ab,kf. or (multiple adj2 (pregnanc* or gestation*)).ti,ab,kf. (71517) 2 (exp Labor, Induced/ or labo*r.ti,ab,kf. or delivery.ti,ab,kf. or parturition.ti,ab,kf.) and (elective or planned or time or timing).ti,ab,kf. and (week*.ti,ab,kw. or term.ti,ab,kf.) (24764) 3 1 and 2 (1079) 4 limit 3 to (english language and yr="2008 -Current") (580) 5 (meta-analysis/ or meta-analysis as topic/ or (meta adj analy$).tw. or ((systematic* or literature) adj2 review$1).tw. or (systematic adj overview$1).tw. or exp "Review Literature as Topic"/ or cochrane.ab. or cochrane.jw. or embase.ab. or medline.ab. or (psychlit or psyclit).ab. or (cinahl or cinhal).ab. or cancerlit.ab. or ((selection criteria or data extraction).ab. and "review"/)) not (Comment/ or Editorial/ or Letter/ or (animals/ not humans/)) (424152) 6 (exp clinical trial/ or randomized controlled trial/ or exp clinical trials as topic/ or randomized controlled trials as topic/ or Random Allocation/ or Double-Blind Method/ or Single-Blind Method/ or (clinical trial, phase i or clinical trial, phase ii or clinical trial, phase iii or clinical trial, phase iv or controlled clinical trial or randomized controlled trial or multicenter study or clinical trial).pt. or random*.ti,ab. or (clinic* adj trial*).tw. or ((singl* or doubl* or treb* or tripl*) adj (blind$3 or mask$3)).tw. or Placebos/ or placebo*.tw.) not (animals/ not humans/) (1927809) 7 Epidemiologic studies/ or case control studies/ or exp cohort studies/ or Controlled Before-After Studies/ or Case control.tw. or (cohort adj (study or studies)).tw. or Cohort analy$.tw. or (Follow up adj (study or studies)).tw. or (observational adj (study or studies)).tw. or Longitudinal.tw. or Retrospective*.tw. or prospective*.tw. or consecutive*.tw. or Cross sectional.tw. or Cross-sectional studies/ or historically controlled study/ or interrupted time series analysis/ (Onder exp cohort studies vallen ook longitudinale, prospectieve en retrospectieve studies) (3323916) 8 4 and 5 (38) 9 (4 and 6) not 8 (91) 10 (4 and 7) not (8 or 9) (296) 11 8 or 9 or 10 (425)
38 SRs + 92 RCTs + 296 observationeel = 425 totaal (71 uniek) |
543 |
|
Embase
|
'multiple pregnancy'/exp OR 'multiple birth offspring'/exp OR 'dichorionic twin pregnancy'/exp OR 'monochorionic twin pregnancy'/exp OR twin*:ti,ab OR ((multiple NEAR/2 (pregnanc* OR gestation*)):ti,ab) AND ('labor induction'/exp OR labo*r:ti,ab OR delivery:ti,ab OR parturition:ti,ab) AND (elective:ti,ab OR planned:ti,ab OR time:ti,ab OR timing:ti,ab) AND (week*:ti,ab OR term:ti,ab) AND (english)/lim AND (2008-2019)/py NOT ('conference abstract'/it OR 'editorial'/it OR 'letter'/it OR 'note'/it) NOT (('animal experiment'/exp OR 'animal model'/exp OR 'nonhuman'/exp) NOT 'human'/exp)
Gebruikte filters: Systematic reviews: 'meta analysis'/de OR cochrane:ab OR embase:ab OR psycinfo:ab OR cinahl:ab OR medline:ab OR ((systematic NEAR/1 (review OR overview)):ab,ti) OR ((meta NEAR/1 analy*):ab,ti) OR metaanalys*:ab,ti OR 'data extraction':ab OR cochrane:jt OR 'systematic review'/de = 45
RCTs: 'clinical trial'/exp OR 'randomization'/exp OR 'single blind procedure'/exp OR 'double blind procedure'/exp OR 'crossover procedure'/exp OR 'placebo'/exp OR 'prospective study'/exp OR rct:ab,ti OR random*:ab,ti OR 'single blind':ab,ti OR 'randomised controlled trial':ab,ti OR 'randomized controlled trial'/exp OR placebo*:ab,ti = 131
Observationele studies: 'major clinical study'/de OR 'clinical study'/de OR 'case control study'/de OR 'family study'/de OR 'longitudinal study'/de OR 'retrospective study'/de OR 'prospective study'/de OR 'cohort analysis'/de OR ((cohort NEAR/1 (study OR studies)):ab,ti) OR (('case control' NEAR/1 (study OR studies)):ab,ti) OR (('follow up' NEAR/1 (study OR studies)):ab,ti) OR (observational NEAR/1 (study OR studies)) OR ((epidemiologic NEAR/1 (study OR studies)):ab,ti) OR (('cross sectional' NEAR/1 (study OR studies)):ab,ti) = 310
Totaal = 486 (472 uniek) |