Afkapwaarde EKR - pre-eclampsie
Uitgangsvraag
Wat is de waarde van het meten van proteïnurie met behulp van de eiwit-kreatinine ratio (EKR) bij zwangere vrouwen?
De uitgangsvraag bevatte de volgende deelvragen:
- Wat is de optimale afkapwaarde van de EKR?
- Wat is het risico van proteïnurie bij vrouwen met zwangerschapshypertensie zonder preexistente proteïnurie op het vóórkomen van ernstige neonatale en maternale morbiditeit?
Aanbeveling
Beschouw de eiwitexcretie bij zwangere vrouwen met hypertensie met een eiwit-kreatinine ratio (EKR) < 30 mg/mmol als niet afwijkend.
Bepaal bij zwangere vrouwen met hypertensie en een EKR van 30 tot 50 mg/mmol op basis van de klinische gegevens of een her-evaluatie met EKR dan wel 24 uurs urine nodig is voor het stellen van de diagnose proteïnurie.
Noem bij zwangere vrouwen met hypertensie en een EKR > 50 mg/mmol de proteïnurie afwijkend. Spaar geen 24 uurs urine bij vrouwen met een EKR >50 mg/mmol.
Overwegingen
Voor- en nadelen van de interventie en de kwaliteit van het bewijs
Deelvraag 1: Optimale afkapwaarde EKR
Op basis van de beschikbare literatuur lijkt de beste sensitiviteit en specificiteit (> 75%) mogelijk bereikt te worden bij een afkapwaarde van de EKR tussen 30 en 35 mg/mmol. Geen enkele afkapwaarde van de EKR gaf een gecombineerde sensitiviteit en specificiteit van > 80% op basis van de ROC curve van Morris (2012). De bewijskracht voor deze uitkomstmaten is gegradeerd als ‘laag’, vanwege de mogelijke risk of bias in de studies door de heterogeniteit tussen de geïncludeerde studie (prevalentie van pre-eclampsie verschilde tussen de studies, methode om EKR en 24-uurs urine te bepalen verschilde). Voor de belangrijke uitkomstmaten positief en negatief voorspellende waarde is het onduidelijk wat de optimale afkapwaarde van de EKR is. De literatuur kon niet worden beoordeeld door middel van GRADE voor deze uitkomstmaten omdat er geen analyse was uitgevoerd waarin de optimale afkapwaarde van de EKR werd onderzocht, de resultaten werden daarom beschrijvend gepresenteerd. Hierin werd beschreven dat de positief en negatief voorspellende waarde afhankelijk zijn van de prevalentie van pre-eclampsie in de populatie. De geïncludeerde studies lieten zien dat bij een prevalentie van 80% de positief en negatief voorspellende waarde van de EKR hoog lijkt te zijn (> 85%). Bij een prevalentie van 20% lijkt de positief voorspellende waarde hoog te blijven (> 85%) maar de negatief voorspellende waarde lager (40%). De overall bewijskracht is gelijk aan de laagst gevonden bewijskracht voor de cruciale uitkomstmaten sensitiviteit en specificiteit en is dus laag.
Onder de 30 mg/mmol lijkt de sensitiviteit voldoende hoog te zijn om proteïnurie uit te sluiten. Boven de 50 mg/mmol lijkt de specificiteit voldoende hoog te zijn om de diagnose proteïnurie te stellen, en is het verzamelen van 24 uurs urine niet nodig. Bij alle waarden tussen 30 tot 50 mg/mmol wordt geadviseerd om op basis van de klinische gegevens te bepalen of een her-evaluatie met EKR dan wel 24 uurs urine nodig is. Volgens de ISSHP kan de diagnose pre-eclampsie ook gesteld worden bij vrouwen bij wie geen proteïnurie wordt aangetoond (Tranquilli, 2014).
Deelvraag 2: risico van proteïnurie
Op basis van de literatuur is het onzeker wat het effect van proteïnurie (> 300 mg/24 uur) is voor de cruciale uitkomstmaat eclampsie (GRADE zeer laag wegens imprecisie). Voor de belangrijke uitkomstmaat pre-eclampsie laat de literatuur een verhoogd risico van proteïnurie zien op het voorkomen van ernstige pre-eclampsie (GRADE low). Waugh (2017) rapporteerde een klinisch relevant verschil, zowel op basis van NICE definitie (RR 8,11 (95%BI 5,69 tot 11,56)) als clinician diagnose (RR 3,17 (95%BI 2,21 tot 4,55)) van ernstige pre-eclampsie. Daarnaast laat de literatuur een mogelijk risico van proteïnurie (> 300 mg/24 uur) zien voor de uitkomstmaat vroeggeboorte < 37 weken, dit betreft een klinisch relevant verschil (RR 1,92 (95%BI 1,18 tot 3,12)) (GRADE ‘low’). Het is onzeker wat het effect van proteïnurie is voor de belangrijke uitkomstmaten pulmonair oedeem, leverbloeding, nierinsufficiëntie, abruptio placentae, perinatale sterfte, NICU opname, laag geboorte gewicht (< 10e percentiel). Deze uitkomstmaten waren beoordeeld met een GRADE zeer laag wegens imprecisie (laag aantal events en breed betrouwbaarheidsinterval bevat grenzen van klinische en statistische significantie) en/of inconsistentie. Er werden geen studies geïncludeerd waarin de uitkomstmaat cerebrale bloeding werd bestudeerd. De overall bewijskracht is gelijk aan de laagst gevonden bewijskracht voor de cruciale uitkomstmaat en dat is in dit geval zeer laag.
Waugh (2017) rapporteerde ook een gecombineerde perinatale uitkomstmaat, gedefinieerd als perinatale of infant mortaliteit, bronchopulmonaire dysplasie, necrotiserende enterocolitis of graad III of IV intraventriculaire bloeding. Op basis van de EKR in het urine monster dat bij start van de studie was verkregen werd de gecombineerde perinatale uitkomstmaat gerapporteerd bij 48 van de 597 (8%) vrouwen met proteïnurie versus 14 van de 362 (3,9%) vrouwen zonder proteïnurie (RR 2,08 (95%BI 1,16 tot 3,72)).
De systematische review van Thangaratinam (2009) heeft gekeken naar de waarde van het meten van proteïnurie op basis van de likelihoodratio (LR) van de test, dit geeft een indicatie in hoeverre een testuitslag de kans op het hebben van de ziekte verhoogt of verlaagt. In dit review zijn studies geïncludeerd waarin verschillende afkapwaarden proteïnurie werden gehanteerd, onder andere 5g/24 uur, 300 mg/24 uur et cetera. Individuele studies uit het review die voldeden aan de PICO zijn geïncludeerd in de literatuuranalyse. De conclusie van dit review suggereert dat het meten van proteïnurie een slechte voorspeller van maternale en foetale complicaties is bij vrouwen met pre-eclampsie. De likelihood ratio (LR) voor verschillende uitkomsten is beperkt en de studie rapporteert dezelfde methodologische beperkingen in deze observationele studies.
Von Dadelszen (2011) ontwikkelde en valideerde een predictiemodel voor het risico op maternale mortaliteit of andere ernstige complicaties bij pre-eclampsie, het fullPIERS model. Later werd ook de miniPIERS ontwikkeld (Payne, 2014). Het model werd ontwikkeld en intern gevalideerd in een prospectieve, multicenter studie in derdelijns obstetrische centra waar vrouwen waren opgenomen met pre-eclampsie dan wel pre-eclampsie ontwikkelden na opname (n=2023). Voorspellers van ernstige maternale uitkomsten waren zwangerschapsduur, pijn op de borst of dyspnoe, saturatie, platelet count, kreatinine and aspartaat transaminase concentraties. Proteïnurie was geen voorspeller van ernstige uitkomsten in de PIERS modellen (Von Dadelszen, 2011; Payne, 2014). Het fullPIERS model werd gevalideerd in Nederlandse data uit de PETRA studie (n=216 vrouwen met ernstige early-onset pre-eclampsie, eclampsie, HELLP syndroom of met hypertensie geassocieerde foetale groeirestrictie) (Ganzevoort, 2014). Ook uit de overige literatuur blijkt verder dat de mate van proteïnurie geen effect heeft op de ernst van de maternale en neonatale morbiditeit (onder andere Hall, 2002). Deze bevindingen ondersteunen dat het verzamelen van 24 uurs urine bij hoge mate proteïnurie niet zinvol lijkt.
Voor het omrekenen van de EKR naar de AKR (albumine-kreatinine ratio) adviseert de werkgroep een verhouding (EKR/AKR) van 3/2 aan te houden, waarbij dus EKR 50 mg/mmol overeen zou komen met AKR 30 g/l en EKR 30 mg/mmol overeen zou komen met AKR 20 g/l (Astor, 2011; van Zuilen, 2012). Belangrijke kanttekening bij dit voorstel is dat er weinig onderzoek naar het AKR afkappunt is gedaan in een populatie met pre-eclampsie.
Waarden en voorkeuren van patiënten (en eventueel hun verzorgers)
Voor zwangere vrouwen is het bepalen van proteïnurie door middel van de EKR minder intensief dan het verzamelen van 24 uurs urine en de uitslag is sneller bekend. De EKR zou daarom de voorkeur van de zwangere vrouw kunnen hebben.
Kosten (middelenbeslag)
Het afschaffen/minder vaak gebruik maken van het verzamelen van 24 uurs urine kan een mogelijke kostenbesparing kunnen opleveren. Het is onduidelijk wat deze kostenbesparing precies is, er zijn geen data hierover bekend.
Aanvaardbaarheid, haalbaarheid en implementatie
Er zijn geen bezwaren voor de aanvaardbaarheid, haalbaarheid of implementatie van deze interventie bekend.
Rationale van de aanbeveling: weging van argumenten voor en tegen de interventies
Onder de 30 mg/mmol lijkt de sensitiviteit voldoende hoog te zijn om proteïnurie uit te sluiten, her-evalueer alleen bij klachten. Boven de 50 mg/mmol lijkt de specificiteit voldoende hoog te zijn om een diagnose te stellen, en is het verzamelen van 24 uurs urine niet nodig. Bij waarden tussen 30 tot 50 mg/mmol wordt geadviseerd om op basis van de klinische gegevens te bepalen of een her-evaluatie met EKR dan wel 24 uurs urine nodig is.
Op basis van de literatuur is het onduidelijk wat het effect is van de mate van proteïnurie op de morbiditeit van moeder en kind, de bewijskracht van de literatuur was gegradeerd als zeer laag.
Onderbouwing
De gouden standaard voor de diagnose van pre-eclampsie is eiwitten in een 24-uurs urine sample. De eiwit-kreatinine ratio (EKR) en albumine-kreatinine ratio (AKR) zijn veel gebruikte screeningsinstrumenten om te bepalen bij welke vrouwen 24-uurs urine diagnostisch moet worden verzameld. Soms wordt de EKR in de praktijk ook gebruikt als een diagnostisch instrument bij zwangere vrouwen. Hetzelfde geldt voor de AKR, die voornamelijk wordt ingezet binnen de nefrologie. Omdat het belangrijkste klinische knelpunt over het gebruik van de EKR gaat, wordt de AKR buiten beschouwing gelaten in deze module.
Voor klinische, pragmatische redenen is het belangrijk om te weten welke cut-off waarde van de EKR een optimale indicatie geeft voor een afwijkende 24-uurs urine. Wanneer men de EKR zou willen gebruiken als screeningsinstrument moet bepaald worden bij welke cut-off waarde het meest onwaarschijnlijk is dat de test vals negatief is (hoge sensitiviteit) en bij welke cut-off waarde de test het meest onwaarschijnlijk vals positief is (hoge specificiteit). Voor uitslagen die tussen deze cut-off waarden liggen zou dan een 24-uurs urine moeten worden verzameld. Daarnaast is er ook praktijkvariatie in de perceptie van de relevantie (van de mate van) proteïnurie voor het risico op het ontwikkelen van negatieve zwangerschapsuitkomsten.
Subquestion 1 - optimal cut-off value
|
Low GRADE |
When the optimal cut-off value for the PCR was defined by optimal sensitivity and specificity, a PCR cut-off value between 30 to 35 mg/mmol might be best to detect significant proteinuria (> 300mg/24 hours) in pregnant women with hypertension. A PCR cut-off value between 30 to 35 mg/mmol might be related to sensitivity and specificity values above 75%. No threshold of the PCR gave a summary estimate above 80% for both sensitivity and specificity.
Sources: (Amin, 2014; Cheung, 2016; Kumari, 2013; Morris, 2012; Stout, 2013; Wilkinson, 2013) |
|
- GRADE |
The positive and negative predictive value of the PCR depend on the prevalence of pre-eclampsia in the population of pregnant women.
Sources: (Amin, 2014; Cheung, 2016; Kumari, 2013; Morris, 2012; Stout, 2013; Wilkinson, 2013) |
Subquestion 2 - risk of proteinuria
|
Low GRADE |
Proteinuria (> 300 mg/24 hours) in pregnant women with hypertension and no preexisting proteinuria might increase the risk of severe pre-eclampsia.
Sources: (Waugh, 2017) |
|
Very low GRADE |
It is uncertain what the effect of proteinuria (> 300 mg/24 hours) in pregnant women with hypertension and no preexisting proteinuria is on the risk of eclampsia.
Sources: (Gangaram, 2009; Li, 2018; Mateus, 2017; Thorton, 2010) |
|
Very low GRADE |
It is uncertain what the effect of proteinuria (> 300 mg/24 hours) in pregnant women with hypertension and no preexisting proteinuria is on the risk of pulmonary oedema.
Sources: (Li, 2018; Mateus, 2017; Thorton 2010) |
|
Very low GRADE |
It is uncertain what the effect of proteinuria (> 300 mg/24 hours) in pregnant women with hypertension and no preexisting proteinuria is on the risk of hepatic haemorrhage.
Sources: (Mateus, 2017) |
|
Very low GRADE |
It is uncertain what the effect of proteinuria (> 300 mg/24 hours) in pregnant women with hypertension and no preexisting proteinuria is on the risk of renal insufficiency.
Sources: (Homer, 2008; Li, 2018) |
|
- GRADE |
It is unclear what the effect of proteinuria (> 300 mg/24 hours) in pregnant women with hypertension and no preexisting proteinuria is on the risk of cerebral haemorrhage. This outcome measure was not studied in the included studies.
Sources: - |
|
Very low GRADE |
It is uncertain what the effect of proteinuria (> 300 mg/24 hours) in pregnant women with hypertension and no preexisting proteinuria is on the risk of placental abruption.
Sources: (Gangaram, 2009; Li, 2018, Mateus, 2017) |
|
Very low GRADE |
It is uncertain what the effect of proteinuria (> 300 mg/24 hours) in pregnant women with hypertension and no preexisting proteinuria is on the risk of perinatal death.
Sources: (Bramham, 2013; Brown, 1996; Gangaram, 2009; Homer, 2008; Lao, 1988; Thornton, 2010) |
|
Very low GRADE |
It is uncertain what the effect of proteinuria (> 300 mg/24 hours) in pregnant women with hypertension and no preexisting proteinuria is on the risk of intra-uterine death of the fetus.
Sources: (Dong, 2017; Gangaram, 2009; Mateus, 2017) |
|
Very low GRADE |
It is uncertain what the effect of proteinuria (> 300 mg/24 hours) in pregnant women with hypertension and no preexisting proteinuria is on the risk of neonatal death.
Sources: (Gangaram, 2009; Mateus, 2017) |
|
Very low GRADE |
It is uncertain what the effect of proteinuria (> 300 mg/24 hours) in pregnant women with hypertension and no preexisting proteinuria is on the risk of NICU admission of the neonate.
Sources: (Lao, 1988; Mateus, 2017) |
|
Very low GRADE |
It is uncertain what the effect of proteinuria (> 300 mg/24 hours) in pregnant women with hypertension and no preexisting proteinuria is on the risk of low birth weight for gestational age of the neonate.
Sources: (Bramham, 2013; Brown, 1996; Homer, 2008; Lao, 1988; Thornton, 2010) |
|
Low GRADE |
Proteinuria (> 300 mg/24 hours) in pregnant women with hypertension and no preexisting proteinuria might increase the risk of preterm birth < 37 weeks.
Sources: (Bramham, 2013; Homer, 2008; Mateus, 2017; Sheikh, 2015) |
Subquestion 1 - optimal cut-off value
Description of study
Morris (2012) performed a systematic review and multivariate meta-analysis with the objective of determining the diagnostic accuracy of the PCR and albumin-creatinine ratio (ACR) compared with 24 hour urine collection for the detection of significant proteinuria in pregnant women with suspected pre-eclampsia. Searches were performed in the databases Medline, Embase, CINAHL, the Cochrane Central Register of Systematic Reviews, the Cochrane Central Register of Controlled Trials, DARE, MEDION, SIGLE, Index of Scientific and Technical Proceedings, and Web of Science, with a time range from 1980 to the end of January 2011 (i.e, PCR and ACR were not in use before 1980).
Inclusion criteria of the systematic review were a study population comprising of women with suspected pre-eclampsia (hypertension with or without proteinuria), the index test was PCR or ACR, and the reference standard a 24 hours urine collection or adverse pregnancy outcome (as defined by the authors of the included studies). The included study designs were: diagnostic accuracy studies, observational studies, and randomised controlled trials. Excluded were studies that evaluated PCR or ACR in women with medical conditions other than hypertension, using a reference test other than 24 hour collection or adverse pregnancy outcome, and case series < 10 cases.
Twenty primary articles (n=2987 women) were included. Fifteen studies (n=2790) compared PCR with 24 hour urine collection, five studies ACR. For the purpose of this literature analysis, the ACR will not be described here. Twelve studies were cohort studies, one was a case-control study, one was a diagnostic accuracy study and one study was of unknown design. Eleven of 15 studies examined multiple threshold values of the PCR compared to 24-hour urine (> 300 mg/24h), four studies examined one threshold.
The prevalence of proteinuria varied across studies from 14% to 87% owing to the variability in severity of the included population. There was significant heterogeneity in method of protein measurement (i.e, trichloroacetic acid method; Biuret Reaction; pyrogallol red reaction; the Bradford assay; the turbidimetric method; benzamethonium chloride). Majority of creatinine measurements were performed using the Jaffe methods, one using the two point rate methods, and one using the iminohydrolase reaction. Thirteen studies reported adequate data on the threshold of the reference standard for inclusion in the multivariate analysis. A multivariate random effects meta-analysis was performed to synthesize all estimates, accounting for within and between study correlation. With these summary estimates per threshold value, a regression model was fitted to plot a receiver operating characteristics curve (ROC curve). The ROC curve was used to analyze the optimum summary estimate. Morris (2012) reported the results in mg/mg, as confirmed by the author via e-mail the data can be converted to mg/mmol by multiplying with 100. For the purpose of this analysis we will report the results in mg/mmol.
Amin (2014) conducted a observational cohort study to examine proteinuria in hypertensive disorders of pregnancy in a tertiary care center in India. It was unclear whether the study was a retrospective study, or otherwise. A total of 102 women with hypertensive disorders of pregnancy were selected (mean age 27.4 (SD 4.3) years). The majority of women were in the third trimester of pregnancy (92%), mean gestational weeks at delivery 35.3 (SD 3.3). The prevalence of proteinuria based on 24 hour urine test ≥300 mg/day was 76.5%. The value of the PCR (mg/100 mL) compared to 24 hour urine test (≥300 mg/day) was compared for five cut-off values of the PCR: 0.30, 0.45, 0.60, 0.75, 0.90. Cut-off values were not defined on forehand.
Cheung (2016) conducted a retrospective cohort study to examine proteinuria in women with pre-eclampsia in a Hong Kong hospital. Of the 175 women with urine PRC analyzed eligible for inclusion, 55 women were excluded (31.4%) (n=24 non-Chinese patients, n=24 cases with pre-existing hypertension or pre-existing renal disease, n=1 urinary tract infection, n=1 missing information, n=1 not delivered at author’s hospital). Of the remaining 120 cases, 98 pairs (82%; pair = urine PCR and 24 hour urine) were collected, of which n=12 were inadequate, n=20 collected more than one day apart. In total, 66 pairs of urine PCR and 24 hour urine tests collected within 24-hours were included in the study (mean age 34 years (rang 18 to 46); mean gestational age at delivery 36 weeks (range 24 tot 41)). The prevalence of proteinuria based on 24 hour urine test ≥ 300 mg/day was not reported. The value of the PCR (mg/mmol) compared to 24 hour urine test (≥ 300 mg/day) was compared for four cut-off values of the PCR: 20, 30, 33, 52. Cut-off values were not defined at forehand.
Kumari (2013) conducted a prospective cohort study to examine proteinuria in women ≥ 32 weeks of gestations admitted with signs and symptoms suggestive of pre-eclampsia. In total, 400 women were included (mean age 24.3 years (SD 2.6); mean gestation in weeks 36.5 (SD 2.7)). The prevalence of proteinuria based on 24 hour urine test ≥ 300 mg/day was 77.5%. The value of the PCR (mg/dL) compared to 24 hour urine test (≥ 300 mg/day) was compared for five cut-off values of the PCR: 0.2, 0.25, 0.3, 0.35, 0.4, 0.45. Cut-off values were not defined at forehand.
Stout (2013) conducted a retrospective cohort study to examine proteinuria in women > 20 weeks of gestation with suspected pre-eclampsia. In total, 356 women were included (mean age for women with proteinuria was 27.5 years (SD 6.7); no proteinuria: 26.8 years (SD 6.5)). The prevalence of proteinuria based on 24 hour urine test ≥ 300 mg/day was 40.5%. The value of the PCR (mg/dL) compared to 24 hour urine test (≥ 300 mg/day) was compared for six cut-off values of the PCR: 0.08, 0.12, 0.19, 0.40, 0.45, 1.19. Cut-off values were not defined at forehand.
Wilkinson (2013) conducted a prospective diagnostic accuracy study to examine proteinuria in women ≥ 20 weeks of gestation with suspected pre-eclampsia. In total, 89 women with 132 24-hour urine collections were included (mean age not reported). The prevalence of proteinuria based on 24 hour urine test ≥ 300 mg/day was 44%. The value of the PCR (mg/mmol) compared to 24 hour urine test (≥ 300 mg/day) was compared for five cut-off values of the PCR: 10, 15, 20, 25, 30. Cut-off values were not defined on forehand, results for cut-off value 10 were not reported.
Results
All results for subquestion 1 were reported in mg/mmol where possible. It was not possible to convert data reported in mg/dl to mg/mmol and are therefore presented in mg/dl.
1. Sensitivity and specificity
One systematic review and meta-analysis (Morris, 2012) and five studies published thereafter report the outcomes sensitivity and specificity of different cut-off values of the PCR, compared to 24-hour urine test (Amin, 2014; Cheung, 2016; Kumari, 2013; Stout, 2013; Wilkinson, 2013). Reported threshold values for the PCR ranged between 13 to 50 mg/mmol (Table 1). Three studies reported PCR cut-off value in mg/dl (range 0.08 to 1.19 mg/dl) and are therefore described separately (Table 2).
Table 1 shows the summary sensitivity and specificity per threshold of the PCR in mg/dl. The between study standard deviation suggested considerable heterogeneity for threshold values between two or more studies, with standard deviations estimated between 0.41 to 1.58. Most studies published after Morris (2012) report similar estimates within or close to the summary estimates as calculated per PCR threshold by Morris (2012).
Figure 1 shows the summary receiver operating characteristics curve for the constrained estimates as reported by Morris (2012). The optimum threshold for PCR to detect significant proteinuria (> 300mg/24 hours), that optimizes sensitivity and specificity combined, was between 0.30 to 0.35 (relating to sensitivity and specificity values above 75%). No threshold gave a summary estimate above 80% for both sensitivity and specificity, and considerable heterogeneity existed in diagnostic accuracy across studies at most thresholds.
Table 1 Summary sensitivity and summary specificity per threshold value of the PCR in mg/dl as reported by Morris (2012), supplemented by data published thereafter
|
Data extracted from author (year)* |
PCR threshold mg/mmol |
N studies |
Sensitivity (summary sensitivity (95%CI), if reported) |
Between study standard deviation (τ)** |
Specificity (summary specificity (95%CI), if reported) |
Between study standard deviation (τ)** |
|
Morris, 2012 |
13 |
1 |
0.89 (0.86 to 0.93) |
0.001 |
0.63 (0.58 to 0.68) |
0 |
|
>> Wilkinson, 2013 |
|
1 |
0.982 |
- |
0.658 |
- |
|
Morris, 2012 |
14 |
2 |
0.89 (0.85 to 0.92) |
1.23 |
0.64 (0.58 to 0.68) |
0.79 |
|
Morris, 2012 |
15 |
6 |
0.88 (0.85 to 0.92) |
1.13 |
0.64 (0.59 to 0.69) |
1.26 |
|
Morris, 2012 |
16 |
3 |
0.88 (0.85 to 0.91) |
1.35 |
0.65 (0.60 to 0.70) |
1.5 |
|
Morris, 2012 |
17 |
3 |
0.88 (0.84 to 0.91) |
1.02 |
0.66 (0.61 to 0.70) |
1.25 |
|
>> Cheung, 2016 |
|
1 |
1.00 (0.91-1.00) |
- |
0.67 (0.38-0.87) |
- |
|
>> Wilkinson, 2013 |
|
1 |
0.964 |
- |
0.842 |
- |
|
Morris, 2012 |
18 |
3 |
0.88 (0.84 to 0.91) |
0.84 |
0.67 (0.62 to 0.71) |
1.75 |
|
Morris, 2012 |
19 |
4 |
0.87 (0.83 to 0.90) |
1.18 |
0.68 (0.63 to 0.72) |
0.55 |
|
Morris, 2012 |
20 |
7 |
0.87 (0.83 to 0.90) |
0.87 |
0.68 (0.64 to 0.73) |
1.68 |
|
Morris, 2012 |
21 |
3 |
0.86 (0.82 to 0.89) |
1.53 |
0.69 (0.65 to 0.73) |
0.67 |
|
Morris, 2012 |
22 |
1 |
0.86 (0.82 to 0.89) |
0.005 |
0.70 (0.65 to 0.74) |
0.001 |
|
>> Wilkinson, 2013 |
|
1 |
0.862 |
- |
0.919 |
- |
|
Morris, 2012 |
23 |
1 |
0.85 (0.81 to 0.88) |
0.004 |
0.71 (0.66 to 0.75) |
0.002 |
|
Morris, 2012 |
24 |
2 |
0.85 (0.81 to 0.88) |
1.2 |
0.71 (0.67 to 0.75) |
0.74 |
|
Morris, 2012 |
25 |
3 |
0.84 (0.80 to 0.87) |
0.98 |
0.72 (0.68 to 0.76) |
0.93 |
|
>> Cheung, 2016 |
|
1 |
0.96 (0.85-0.99) |
- |
0.87 (0.58-0.97) |
- |
|
>> Wilkinson, 2013 |
|
1 |
0.839 |
- |
0.974 |
- |
|
Morris, 2012 |
28 |
2 |
0.82 (0.78 to 0.86) |
1.21 |
0.74 (0.70 to 0.78) |
0.82 |
|
>> Cheung, 2016 |
|
1 |
0.96 (0.85-0.99) |
- |
0.93 (0.66-0.99) |
- |
|
Morris, 2012 |
30 |
5 |
0.81 (0.77 to 0.85) |
1.58 |
0.76 (0.71 to 0.80) |
2.13 |
|
Morris, 2012 |
31 |
1 |
0.81 (0.76 to 0.84) |
0.003 |
0.76 (0.72 to 0.80) |
0.003 |
|
Morris, 2012 |
32 |
1 |
0.80 (0.76 to 0.84) |
0.003 |
0.77 (0.73 to 0.81) |
0.003 |
|
Morris, 2012 |
35 |
1 |
0.78 (0.73 to 0.82) |
0.002 |
0.79 (0.75 to 0.83) |
0.003 |
|
Morris, 2012 |
39 |
2 |
0.75 (0.70 to 0.79 |
0.85 |
0.81 (0.77 to 0.85) |
1.18 |
|
Morris, 2012 |
40 |
2 |
0.74 (0.69 to 0.78) |
0.42 |
0.82 (0.78 to 0.86) |
1.27 |
|
Morris, 2012 |
45 |
1 |
0.70 (0.64 to 0.75) |
0.001 |
0.84 (0.80 to 0.88) |
0.004 |
|
>> Cheung, 2016 |
|
1 |
0.84 (0.70-0.92) |
- |
1.00 (0.74-1.00) |
- |
|
Morris, 2012 |
49 |
1 |
0.66 (0.60 to 0.72) |
0.01 |
0.86 (0.82 to 0.90) |
0.001 |
|
Morris, 2012 |
50 |
2 |
0.65 (0.59 to 0.72) |
0.65 |
0.87 (0.82 to 0.90) |
0.76 |
*data from studies published after Morris (2012) reporting on the same cut-off value of the PCR are indicated in italic (cursive).
** between study variation was only calculated by Morris (2012).
Table 2 Sensitivity and specificity per threshold value of the PCR in mg/dl, as reported by studies that were published since Morris (2012)
|
Data extracted from author (year)* |
PCR threshold mg/dl ** |
N studies |
Sensitivity (summary sensitivity (95%CI), if reported) |
Between study standard deviation (τ)*** |
Specificity (summary specificity (95%CI), if reported) |
Between study standard deviation (τ)*** |
|
Stout, 2013 |
0.08** |
1 |
0.97 |
- |
0.15 |
- |
|
Stout, 2013 |
0.12** |
1 |
0.90 |
- |
0.39 |
- |
|
Stout, 2013 |
0.19** |
1 |
0.78 |
|
0.70 |
|
|
Kumari, 2013 |
0.20** |
1 |
0.96 |
- |
0.76 |
- |
|
Kumari, 2013 |
0.25** |
1 |
0.93 |
- |
0.80 |
- |
|
Amin, 2014 Kumari, 2013 |
0.30** |
2 |
0.897 0.90 |
- |
0.542 0.84 |
- |
|
Kumari, 2013 |
0.35** |
1 |
0.85 |
- |
0.88 |
- |
|
Kumari, 2013 Stout, 2013 |
0.40** |
2 |
0.81 0.50 |
- |
0.92 0.92 |
- |
|
Amin, 2014, Kumari, 2013 Stout, 2013 |
0.45** |
3 |
0.821 0.77 0.47 |
- |
0.875 0.96 0.96 |
- |
|
Amin, 2014 |
0.60** |
1 |
0.756 |
- |
0.875 |
- |
|
Amin, 2014 |
0.75** |
1 |
0.679 |
- |
1 |
- |
|
Amin, 2014 |
0.90** |
1 |
0.615 |
- |
1 |
- |
|
Stout, 2013 |
1.19** |
1 |
0.31 |
- |
>0.99 |
- |
Figure 1 (derived from Morris, 2012). Summary receiver operating characteristics curve for constrained estimates of sensitivity and specificity for protein to creatinine ratio
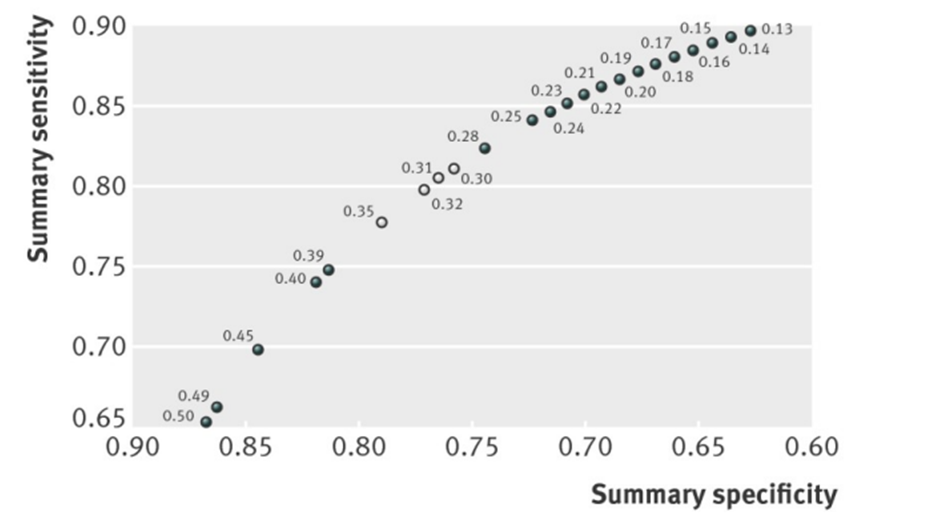
Note: Open circles indicate most promising thresholds for use, as they optimise both sensitivity and specificity (and thus give largest rectangular area below paired point to right)
2. Positive and negative predictive value
One systematic review and meta-analysis (Morris, 2012) and four studies published thereafter reported the outcome measures positive and negative predictive value of the PCR (Amin, 2014; Cheung, 2016 Kumari, 2013, Stout, 2013). Morris (2012) calculated the positive and negative predictive value of the PCR compared to 24-hour urine for three different prevalences (20%, 50% and 80%). Morris (2012) reported the positive and negative predictive value for all cut-off values as reported previously, based on the summary sensitivity and specificity estimate (see Table 1). None of the included studies performed an analysis to examine the optimal positive and negative predictive value, the results were therefore only descriptively reported.
Appendix 1 presents the data by Morris (2012) reporting the positive and negative predictive value for 23 different cut-off values of the PCR, stratified for three different prevalences of proteinuria in the population. The descriptive presentation shows that the positive and negative predicted values depended on the cut-off value chosen and the prevalence assumed. In general, an increasing cut-off value of the PCR seemed to slightly increase the positive predictive value and slightly decrease the negative predictive value. In populations with a high prevalence of proteinuria (e.g. 80%) high positive and negative predictive values above 0.85 were achieved. However, when the prevalence was low (e.g. 20%), the negative predictive value remained above 0.85, but positive predictive value lowered to 0.4. Descriptive presentation of results in Table 3 and 4 show similar results, with an increasing cut-off value of the PCR the positive predictive value improves and the negative predictive value seems to decrease.
Table 3 Positive and negative predictive value per threshold value of the PCR in mg/dl, as reported by studies that were published since Morris (2012)
|
Author, year of publication |
Prevalence of proteinuria (%) |
PCR cut-off value mg/dl |
Positive predictive value |
Negative predictive value |
|
Stout, 2013 |
40.5% |
0.08 mg/dl |
44 |
86 |
|
Stout, 2013 |
40.5% |
0.12 mg/dl |
50 |
86 |
|
Stout, 2013 |
40.5% |
0.19 mg/dl |
64 |
82 |
|
Kumari, 2013 |
77.5% |
0.2 mg/dl |
93 |
83 |
|
Kumari, 2013 |
77.5% |
0.25 mg/dl |
94 |
77 |
|
Amin, 2014 |
76.5% |
0.30 mg/dl |
86.4 |
61.9 |
|
Kumari, 2013 |
77.5% |
0.3 mg/dl |
95 |
72 |
|
Kumari, 2013 |
77.5% |
0.35 mg/dl |
96 |
63 |
|
Kumari, 2013 |
77.5% |
0.4 mg/dl |
97 |
58 |
|
Stout, 2013 |
40.5% |
0.40 mg/dl |
81 |
74 |
|
Kumari, 2013 |
77.5% |
0.45 mg/dl |
98 |
54 |
|
Stout, 2013 |
40.5% |
0.45 mg/dl |
88 |
73 |
|
Amin, 2014 |
76.5% |
0.45 mg/dl |
95.5 |
60 |
|
Amin, 2014 |
76.5% |
0.60 mg/dl |
95.2 |
52.5 |
|
Amin, 2014 |
76.5% |
0.75 mg/dl |
100 |
49.0 |
|
Amin, 2014 |
76.5% |
0.90 mg/dl |
100 |
44.4 |
|
Stout, 2013 |
40.5% |
1.19 mg/dl |
96 |
67 |
Table 4 Positive and negative predictive value per threshold value of the PCR in mg/mmol, as reported by studies that were published since Morris (2012)
|
Author, year of publication |
Prevalence of proteinuria (%) |
PCR cut-off value mg/dl |
Positive predictive value (95%CI) |
Negative predictive value (95%CI) |
|
Cheung, 2016 |
Not reported |
20 mg/mmol* |
91 (79-96) |
100 (65-100) |
|
Cheung, 2016 |
Not reported |
30 mg/mmol* |
96 (85-99) |
87 (58-97) |
|
Cheung, 2016 |
Not reported |
33 mg/mmol |
98 (87-99) |
88 (60-97) |
|
Cheung, 2016 |
Not reported |
52 mg/mmol |
100 (89-100) |
65 (42-82) |
Level of evidence of the literature
Diagnostic accuracy studies start at a GRADE high.
The level of evidence regarding the outcome measures “sensitivity and specificity” in pregnant women with hypertension and proteinuria is downgraded with 2 levels to a low GRADE due to risk of bias (large heterogeneity between included populations, with regard to the prevalence of pre-eclampsia, testing of index and reference test.
The level of evidence regarding the outcome measures “positive and negative predictive value” could not be assessed as the included studies did not compare cut-off values of the PCR. A descriptive conclusion was drawn.
Subquestion 2 - risk of proteinuria
Description of study
Bramham (2013) performed a secondary analysis of the Vitamins in Pre-eclampsia (VIP) trial that was carried out in 25 UK hospitals in ten geographical areas. Pregnant women with a gestational age of 14+0 to 21+6 weeks and one or more pre-existing risk factors for pre-eclampsia were included (for example pre-eclampsia in previous pregnancy requiring delivery < 37 gestational weeks; pre-existing diabetes requiring insulin or oral therapy) (n=948). Women were allocated into one of four groups: (1) pre-eclampsia with maximal quantified proteinuria of 300-499 mg/24h (PE300, n=60); (2) pre-eclampsia with proteinuria of at least 500 mg/24h (PE500, n=161); (3) non-proteinuric chronic hypertension without pre-eclampsia (CHT, n=615); and (4) non-proteinuric gestational hypertension (GH, n=110). Black ethnicity was more common in both PE300 (24.6%) and PE500 (21.5%) than the CH (11.7%) or GH groups (4.5%) (P<0.0001). The PE300 group was the reference group in this study. The results of the CHT group have been left out in the further description of the results below.
Brown (1996) performed a prospective study in two primary referral hospitals located in Australia. Included were 825 women with pre-eclampsia (development of hypertension after 20 weeks gestation) of whom 502 had mild pre-eclampsia (defined as hypertension only) and 323 had severe pre-eclampsia (defined as hypertension and evidence of maternal organ dysfunction). In the study of Brown (1996), hypertension was further defined as a sitting systolic blood pressure ≥ 140 mmHg and/or diastolic blood pressure ≥ 90 mmHg, or a rise in systolic blood pressure of ≥ 25 mmHg and/or diastolic blood pressure ≥ 15 mmHg from first-trimester blood pressure. Of the 825 included women, 160 women had proteinuric hypertension versus 665 women non-proteinuric hypertension. Proteinuria was established by ≥ 300 mg/day (24-hour urine collection) or persistently (≥ 2 days) ≥ 2+ protein (1 g/L) on urinalysis (dipstick testing).
The retrospective Chinese study of Dong (2017) included 239 women with pre-eclampsia. Pre-eclampsia was in this study defined as maternal systolic blood pressure ≥ 140 mmHg and/or diastolic blood pressure ≥90 mmHg measured on two occasions separated by at least 6h, and proteinuria > 300 mg in a 24h period, or impaired liver function and lower platelet count, after 20 weeks of gestation. All women with risk factors for developing pre-eclampsia were excluded from this study. Based on the amount of proteinuria in a 24h urine collection, participants were divided into four groups: (1) proteinuria in a 24h urine collection was < 300 mg/L (n=35); (2) proteinuria in a 24h urine collection was between 300 mg/L and 3000 mg/L (n=121); (3) proteinuria in a 24h urine collection was between 3000 mg/L and 5000 mg/L (n=46); (4) proteinuria in a 24h urine collection was ≥ 5000 mg/L (n=37).
Gangaram (2009) conducted a prospective study at hospitals serving the Durban Metropolitan region of South Africa. Women with hypertension after 20 weeks of gestation were included to compare the pregnancy outcomes of women with gestational hypertension (without significant proteinuria < 300 mg/24 hours) (n=65) versus pre-eclampsia (hypertension with significant proteinuria ≥ 300 mg/24 hours) (n=90). The results of the secondary analysis of Gangaram (2009) concerning the diagnostic accuracy of the UACR dipstick versus the 24h urinary protein test have been left out in the further description of the results below.
Homer (2008) included women that were referred to the obstetric medicine renal team in three Australian hospitals. Indications for referral were for example the presence of proteinuria, recurrent admissions for hypertension or repeated high blood pressure measures in a day-only unit. Comparisons were made between women with proteinuric pre-eclampsia (n=958) versus nonproteinuric pre-eclampsia (n=357) and women with gestational hypertension (n=1192) versus nonproteinuric pre-eclampsia (n=357). Gestational hypertension was defined as an average SBP ≥ 140mmHg and/or DBP ≥ 90mmHg developing after 20 weeks gestation, without any evidence of multi-system dysfunction. In the nonproteinuric pre-eclampsia group there was additional evidence of other organ involvement. Proteinuria was diagnosed by a spot urine protein/creatinine ratio (≥ 30mg protein per mmol creatinine) or ≥ 300mg per day or consistently ≥ ‘2+’ (1g/L) dipstick proteinuria. Homer (2008) reported that dipstick urine was rarely relied upon in this study to make the diagnosis of proteinuria. Women in the nonproteinuric pre-eclampsia group were significantly older (30.0±4.7) than in the gestational hypertension group (29.2±5.3) (p=0.01). The proportion of primigravida (66.7% versus 59.9%, p=0.03) and multiple pregnancy (9.9% versus 3.9%, p<0.001) was higher in the non-proteinuric pre-eclampsia group compared to the gestational hypertension group.
Lao (1988) performed a prospective study in a hospital in Hong Kong, including nulliparous women who developed pre-eclampsia before the onset of labour. Both systolic and diastolic pressures had to reach or exceed 140 mmHg and 90 mmHg for this diagnosis. Women were divided into a proteinuric (Group A, n=46) and non-proteinuric group (Group B, n=41). Significant proteinuria was diagnosed when a reading of one-plus or more was found with a dipstick on two or more occasions in samples of clean-catch mid-stream urine. The two groups were comparable on maternal age, other baseline characteristics were not reported.
Li (2018) included 1738 women from 11 hospitals in China with a pregnancy complicated by a hypertensive disorder of pregnancy and from whom records of 24h proteinuria were available. These women were allocated into four groups: (1) non-proteinuria (patients with maximal quantified proteinuria < 300 mg/24h (n=328); (2) mild proteinuria (patients with maximal quantified proteinuria ≥ 300 mg/24h and < 2000 mg/24h (n=638); (3) severe proteinuria patients with maximal quantified proteinuria ≥ 2000 mg/24h and < 5000 mg/24h (n=353); and (4) patients with maximal quantified proteinuria ≥ 5000 mg/24h (Group 4, n=419). Significant differences were found for maternal age, maternal weight before pregnancy, and BMI before pregnancy among the four groups. Li (2018) reported only on maternal outcomes.
Mateus (2017) performed a secondary analysis of the multicenter Pre-Eclampsia Triage by Rapid Assay (PETRA) prospective cohort study (24 centers in the US and Canada). Women between 200/7 to 400/7 weeks of gestation presenting with signs or symptoms of pre-eclampsia were eligible. Comparisons were made between three groups: (1) non-proteinuria pre-eclampsia (proteinuria < 165 mg in 12 hours or < 300 mg in 24 hours) (n=102); (2) mild-proteinuria pre-eclampsia (proteinuria between 165 mg and 2700 mg in 12 hours or from 300 mg to 4900 mg in 24 hours) (n=268); (3) massive-proteinuria pre-eclampsia (proteinuria > 2700 mg in 12 hours or >5000 mg in 24 hours) (n=36). Mateus (2017) reported that they used 12 hours proteinuria cut-off values that have been reported to correlate well with 24 hours urine proteinuria values in previous studies. Nulliparity was significantly more prevalent in women with massive-proteinuria pre-eclampsia (80.6% versus non-proteinuria pre-eclampsia 52% and mild proteinuria pre-eclampsia 62.7%, p=0.003).
Sheikh (2015) performed a prospective cohort study in Pakistan including primigravidas of ≥ 20 weeks of gestation with a blood pressure > 140/90 mm Hg. Women with gestational hypertension without proteinuria (n=56) were compared with women who had gestational hypertension with proteinuria (n=56). The latter was defined as hypertension in pregnancy with proteinuria of one 24-hour collection with total protein excretion > 300mg/24 hours or two clean catch midstream or catheter specimen of urine collected > 4 hours apart with > 2+ on reagent strip. The two groups were not statistically compared on baseline characteristics. Sheikh (2015) reported only on the fetal outcome measure preterm delivery (< 37 weeks).
Thornton (2010) undertook a retrospective individual patient medical note review (n=670) at a tertiary referral centre in Sydney. Women with pre-eclampsia were included, defined according to the ASSHP consensus statement as hypertension and one of the following clinical features: proteinuria, renal insufficiency, liver disease, neurological problems, haematological disturbance and⁄or fetal growth restriction. These women where then divided into two groups: the non-proteinuric (n=417) and proteinuric cohorts (n=253). Proteinuria was diagnosed by 24h protein excretion of >300 mg, a spot protein⁄creatinine ratio of 30 mg⁄mmol or by 2+ on standard dipstick urinalysis. Of the proteinuric cohort, only 31% of women with 2+ protein on dipstick were tested further for protein excretion via the spot protein:creatinine ratio or a 24h urine collection. Women with proteinuric pre-eclampsia were significantly younger (32±6) than non-proteinuric women (34±6) (P<0.001).
Waugh (2017) conducted a prospective diagnostics accuracy study (n=959) in 36 obstetric units in England. Pregnant women aged ≥ 16 years who were at > 20 weeks’ gestation with confirmed gestational hypertension (systolic BP of ≥140mmHg and/or diastolic BP of ≥ 90mmHg) and trace or greater of proteinuria on an automated dipstick urinalysis were included. Waugh (2017) reported proteinuria analyses for both benzethonium chloride assays and pyrogallol red assays. Benzethonium chloride was chosen as default by Waugh (2017), results for pyrogallol red will not be discussed here as this reflects the Dutch situation. Based on 24-hour urine test with n=475 women had proteinuria (≥ 300 mg/24h), n=484 did not have proteinuria (< 300 mg/24h). Based on the protein/creatinine ratio in the recruitment urine sample n=597 women had proteinuria (≥ 30 mg/mmol), n=362 women did not have proteinuria (< 30 mg/mmol). Based on the protein/creatinine ratio in the 24 hour urine sample n=589 women had proteinuria (≥30 mg/mmol), n=370 women did not have proteinuria (< 30 mg/mmol). Notably, outcome measures were only reported between women with/without proteinuria based on the protein/creatinine ratio.
Results
For subquestion 2, meta-analyses were performed where possible, stratified for the comparison group (either a comparison between proteinuric women compared to non-proteinuric women with gestational hypertension, or compared to non-proteinuric women with pre-eclampsia).
1. Pre-eclampsia
One study reported the outcome measure severe pre-eclampsia (Waugh, 2017).
Waugh (2017) reported the outcome measure severe pre-eclampsia for the following comparisons: 1) proteinuria (≥ 30 mg/mmol) based on protein/creatinine ratio in recruitment urine sample compared to NICE diagnosis of severe pre-eclampsia; 2) proteinuria based on protein/creatinine ratio in recruitment urine sample compared to clinician diagnosis of severe pre-eclampsia; 3) proteinuria based on protein/creatinine ratio in 24 hour urine sample stratified for clinician diagnosis of severe pre-eclampsia.
A NICE diagnosis of severe pre-eclampsia was defined as pre-eclampsia with severe hypertension, symptoms, biochemical and/or haematological impairment. A clinician diagnosis of severe pre-eclampsia was defined as treatment with magnesium sulphate or when women were put on severe PE protocol (not further defined) (Waugh, 2017).
NICE diagnosis of severe pre-eclampsia
When proteinuria was based on the protein/creatinine ratio from the urine sample at recruitment, Waugh (2017) reported that severe pre-eclampsia was found in 388 of 597 (65%) women with proteinuric hypertensive disorder of pregnancy compared to 29 of 362 (8%) women with non-proteinuric hypertensive disorder of pregnancy (RR 8.11 (95%CI 5.69 to 11.56)).
Clinician diagnosis of severe pre-eclampsia
When proteinuria was based on the protein/creatinine ratio from the urine sample at recruitment, Waugh (2017) reported that severe pre-eclampsia was found in 162 of 597 (27.1%) women with proteinuric hypertensive disorder of pregnancy compared to 31 of 362 (8.6%) women with non-proteinuric hypertensive disorder of pregnancy (RR 3.17 (95%CI 2.21 to 4.55)).
When proteinuria was based on protein/creatinine ratio from the 24 hour urine sample, Waugh (2017) reported that severe pre-eclampsia was found in 161 of 589 (27.3%) women with proteinuric hypertensive disorder of pregnancy compared to 32 of 370 (8.6%) women with non-proteinuric hypertensive disorder of pregnancy (RR 3.16 (95%CI 2.21 to 4.51)).
2. Eclampsia
Four studies reported on the outcome measure eclampsia (Gangaram, 2009; Li, 2018; Mateus, 2017; Thornton, 2010). Outcome was not defined by the included studies. Gangaram (2009) made comparisons with women with non-proteinuric gestational hypertension. Li (2018), Mateus (2017), and Thornton (2010) compared to women with non-proteinuric pre-eclampsia.
Eclampsia was found in 12 of 2057 (0.6%) women with a proteinuric hypertensive disorder of pregnancy compared to 4 of 912 (0.4%) women with a nonproteinuric hypertensive disorder of pregnancy (RR 1.19 (95% CI 0.26 to 5.38)) (Figure 2).
Figure 2 Eclampsia, comparison hypertensive disorder of pregnancy with proteinuria versus hypertensive disorder of pregnancy without proteinuria
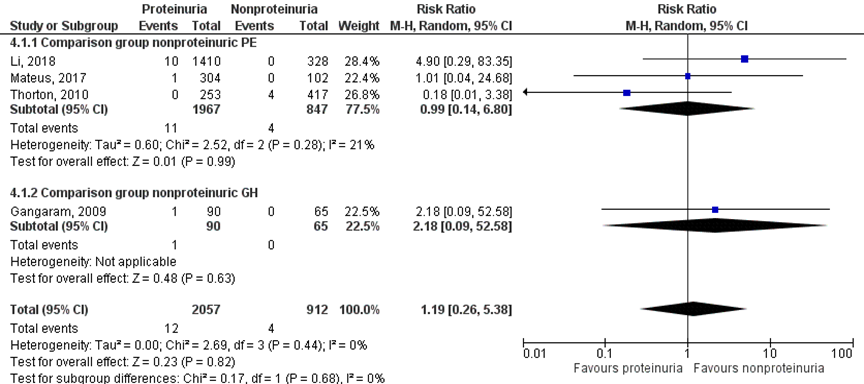
Z: p-waarde van het gepoolde effect; df: degrees of freedom (vrijheidsgraden); I2: statistische heterogeniteit; CI: betrouwbaarheidsinterval
3. Pulmonary oedema
Three studies studies reported on the outcome measure pulmonary oedema (Li, 2018; Mateus, 2017; Thornton 2010). Mateus (2017) used a composite outcome measure that comprised of pulmonary oedema and acute respiratory distress syndrome (ARDS). None of the other studies gave definitions of pulmonary oedema. All studies compared to women with non-proteinuric pre-eclampsia.
Pulmonary oedema was reported in 13 of 1967 (0.7%) women with proteinuria compared to 4 of 847 (0.5%) women without proteinuria (RR 0.97 (95% CI 0.32 to 2.92)) (Figure 3).
Figure 3 Pulmonary oedema, comparison proteinuric pre-eclampsia versus non-proteinuric pre-eclampsia
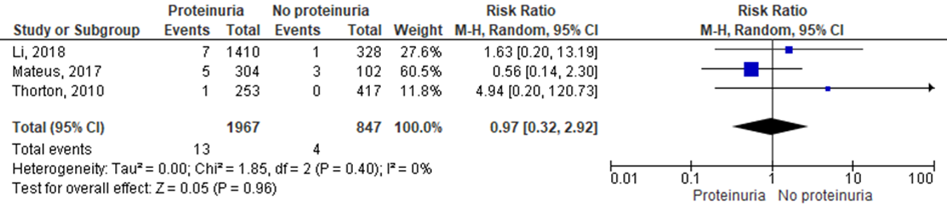
Z: p-waarde van het gepoolde effect; df: degrees of freedom (vrijheidsgraden); I2: statistische heterogeniteit; CI: betrouwbaarheidsinterval
One study reported the outcome measure hepatic haemorrhage (Mateus, 2017). Mateus (2017) examined the incidence of liver hematoma/rupture (not further defined), but found 0 cases (non-proteinuria pre-eclampsia 0 of 102, 0%; mild proteinuria pre-eclampsia 0 of 268, 0%; and massive pre-eclampsia 0 of 36, 0%).
5. Renal insufficiency
Five studies reported on the outcome measure renal insufficiency (Brown, 1996; Homer, 2008; Li, 2018; Mateus, 2017; Thornton, 2010) comparing women with proteinuric pre-eclampsia versus women with non-proteinuric pre-eclampsia. Mateus (2017) and Thornton (2010) reported this as ‘acute renal failure’, not further defined. Brown (1996) reported this as ‘renal impairment’, not further defined. Li (2018) defined renal insufficiency as serum creatinine (Scr) > 97.25 μmol/L (1.2 mg/dL), but no definitions of this outcome measure were given by Homer (2008).
Renal insufficiency was reported in 160 of 3445 (4.6%) women with proteinuric pre-eclampsia compared to 94 of 1322 (7.1%) non-proteinuric pre-eclamptic women (RR 0.84 (95% CI 0.15 to 4.74)) (Figure 4).
Figure 4 Renal insufficiency, comparison proteinuric pre-eclampsia versus non-proteinuric pre-eclampsia
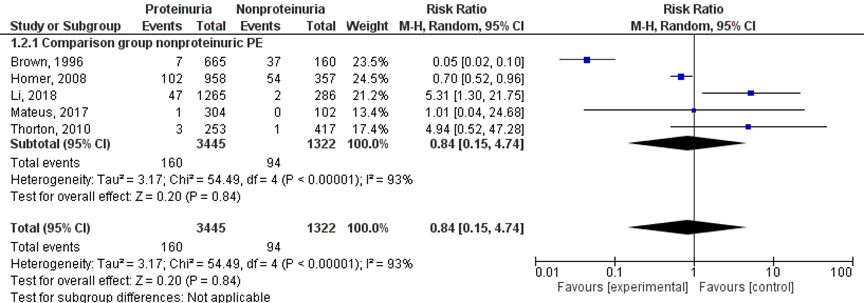
Z: p-waarde van het gepoolde effect; df: degrees of freedom (vrijheidsgraden); I2: statistische heterogeniteit; CI: betrouwbaarheidsinterval
6. Cerebral hemorrhage
No studies reported on the outcome measure cerebral haemorrhage.
7. Placental abruption
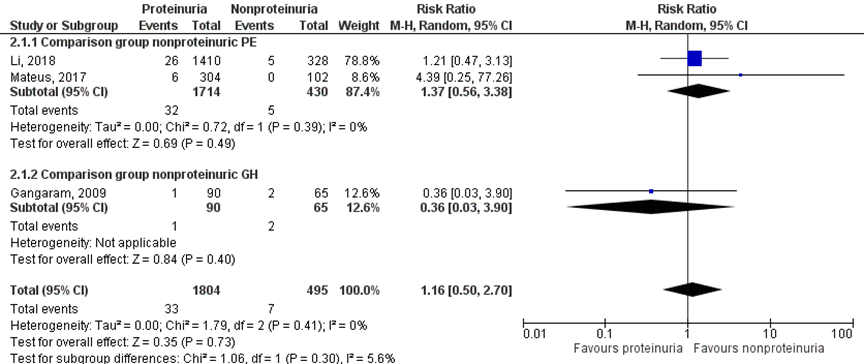
Three studies reported results regarding the outcome measure placental abruption (Gangaram, 2009; Li, 2018, Mateus, 2017), with no definitions of this outcome measure given. Li (2018) and Mateus (2017) compared to women with non-proteinuric pre-eclampsia. However, Gangaram (2009) used as a comparison group women with gestational hypertension (without proteinuria). Therefore, a meta-analysis with two subgroups was performed according to the comparison group (non-proteinuric pre-eclampsia versus non-proteinuric gestational hypertension) (Figure 5).
Placental abruption was reported in 33 of 1804 (1.8%) women with a proteinuric hypertensive disorder of pregnancy versus 7 of 495 (1.4%) women with nonproteinuric hypertensive disorder of pregnancy (RR 1.16 (95% CI 0.50 to 2.70)) (Figure 5).
Figure 5 Placental abruption, comparison hypertensive disorder of pregnancy with proteinuria versus hypertensive disorder of pregnancy without proteinuria
Z: p-waarde van het gepoolde effect; df: degrees of freedom (vrijheidsgraden); I2: statistische heterogeniteit; CI: betrouwbaarheidsinterval
8. Perinatal death (intra-uterine death and neonatal death)
The outcome measure perinatal death was reported by three definitions: perinatal death, intra-uterine death and neonatal death, reported respectively in paragraphs 8.1, 8.2 and 8.3. Most studies did not define the outcomes specifically.
8.1. Perinatal death
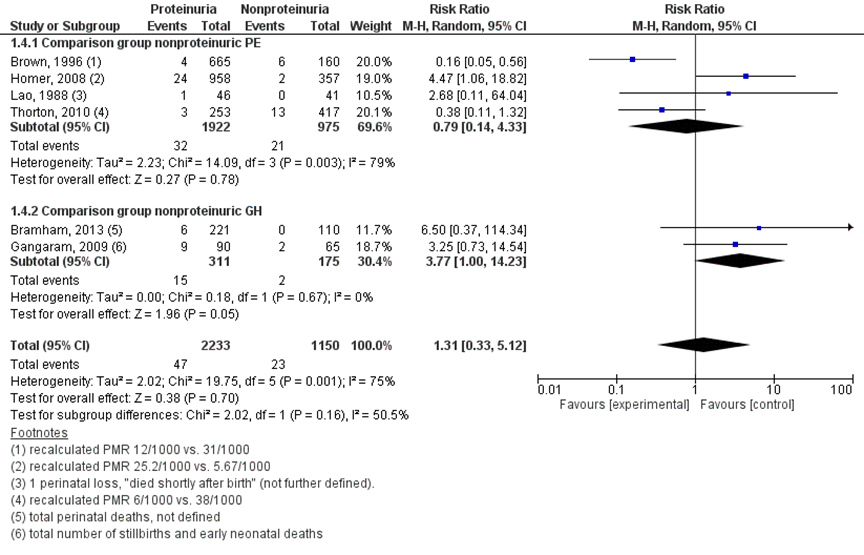
Perinatal death was reported by seven studies (Bramham, 2013; Brown, 1996; Gangaram, 2009; Homer, 2008; Lao, 1988; Thornton, 2010). Bramham (2013) reported this as ‘total perinatal deaths’, not further defined. Lao (1988) reported perinatal death descriptively as ‘one baby died shortly after birth’, not further defined. Gangaram (2009) reported perinatal deaths as total number of stillbirths and early neonatal deaths. Three studies reported perinatal death as perinatal mortality per 1000 live births (Thornton, 2010), perinatal mortality per 1000 hypertensive pregnancies (Brown, 1996) and perinatal mortality per 1000 (unit of measurement not specified, presumably births) (Homer, 2008). Perinatal mortality rates were recalculated with original data to original number of perinatal deaths.
Perinatal death was reported in 47 of 2233 (2.1%) women with proteinuric hypertensive disorders of pregnancy compared to 23 of 1150 (2%) women with non-proteinuric hypertensive disorders of pregnancy (RR 1.31 (95%CI 0.33 to 5.12)).
Figure 6 Perinatal death, comparison hypertensive disorder of pregnancy with proteinuria versus hypertensive disorder of pregnancy without proteinuria
Z: p-waarde van het gepoolde effect; df: degrees of freedom (vrijheidsgraden); I2: statistische heterogeniteit; CI: betrouwbaarheidsinterval
8.2 Intra-uterine death
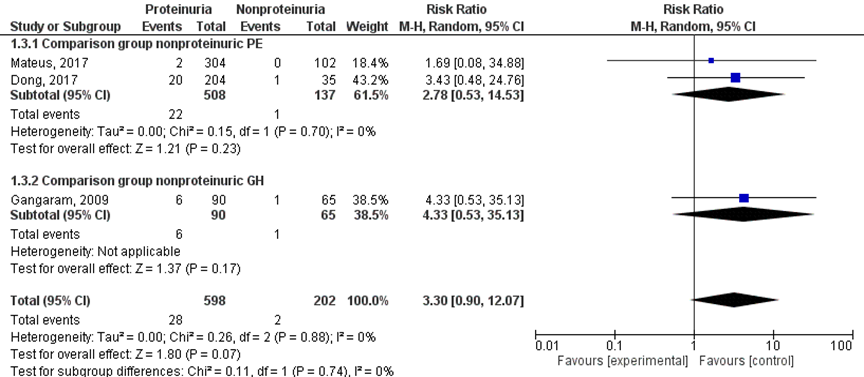
Three studies reported results regarding the outcome measure intra-uterine death (Dong, 2017; Gangaram, 2009; Mateus, 2017), all studies reported this as ‘stillbirth’, which was not further defined in text. Dong (2017) and Mateus (2017) compared to women with non-proteinuric pre-eclampsia. However, Gangaram (2009) used women with gestational hypertension (without proteinuria) as a comparison group. Therefore, a meta-analysis with two subgroups was performed according to the comparison group (non-proteinuric pre-eclampsia versus non-proteinuric gestational hypertension) (Figure 7).
Intra-uterine death, defined as stillbirth, was reported in 28 of 598 (4.7%) women with a proteinuric hypertensive disorder of pregnancy versus two of 202 (1.0%) women with nonproteinuric hypertensive disorder of pregnancy (RR 3.30 (95% CI 0.90 to 12.07)) (Figure 7).
Figure 7 Intra-uterine death, comparison hypertensive disorder of pregnancy with proteinuria versus hypertensive disorder of pregnancy without proteinuria
Z: p-waarde van het gepoolde effect; df: degrees of freedom (vrijheidsgraden); I2: statistische heterogeniteit; CI: betrouwbaarheidsinterval
8.3. Neonatal death
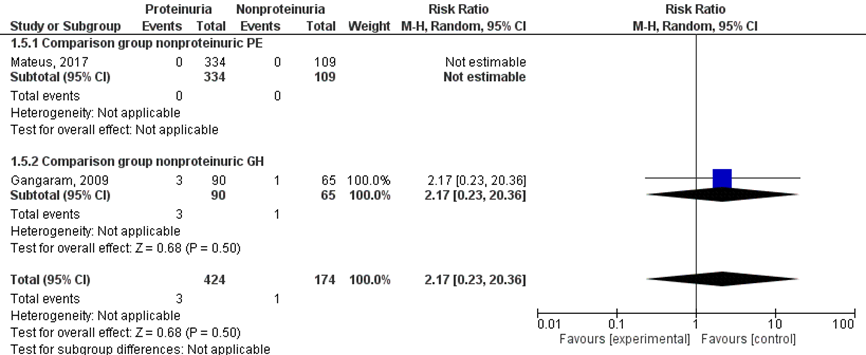
Two studies reported results regarding the outcome measure neonatal death (Gangaram, 2009; Mateus, 2017). Gangaram (2009) reported this as ‘early neonatal death’, not further defined. Mateus (2017) did not define the outcome. A meta-analysis with two subgroups was performed according to the comparison group (non-proteinuric pre-eclampsia versus non-proteinuric gestational hypertension) (Figure 8).
Neonatal death was reported in three of 424 (0.7%) neonates of women with a proteinuric hypertensive disorder of pregnancy versus one of 174 (0.6%) neonates of women with a non-proteinuric hypertensive disorder of pregnancy (RR 2.17 (95%CI 0.23 to 20.36)) (Figure 8).
Figure 8 Neonatal death, comparison hypertensive disorder of pregnancy with proteinuria versus hypertensive disorder of pregnancy without proteinuria
Z: p-waarde van het gepoolde effect; df: degrees of freedom (vrijheidsgraden); I2: statistische heterogeniteit; CI: betrouwbaarheidsinterval
9. NICU admission
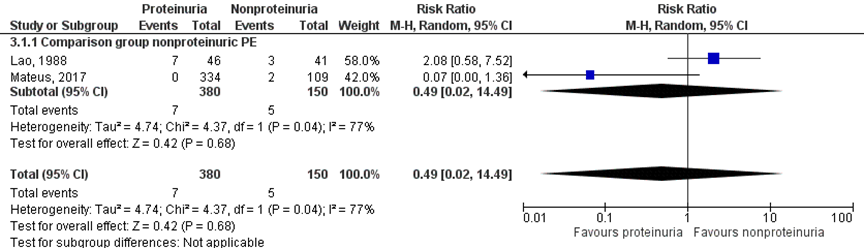
The outcome measure NICU admission was reported by two studies (Lao, 1988; Mateus, 2017). Mateus (2017) reported specifically on NICU admission more than 48 hours for a full-term infant, and Lao (1988) used the outcome measure admission to neonatal unit. The studies compared to women with nonproteinuric pre-eclampsia (Figure 9).
NICU admission was reported for 7 of 380 infants (1.8%) of mothers with a proteinuric hypertensive disorder of pregnancy, compared to 5 of 150 infants (3.3%) of mothers with a nonproteinuric hypertensive disorder of pregnancy (RR 0.49 (95% CI 0.02 to 14.49)) (Figure 9).
Figure 9 NICU admission, comparison hypertensive disorder of pregnancy with proteinuria versus hypertensive disorder of pregnancy without proteinuria
Z: p-waarde van het gepoolde effect; df: degrees of freedom (vrijheidsgraden); I2: statistische heterogeniteit; CI: betrouwbaarheidsinterval
10. Low birth weight for gestational age
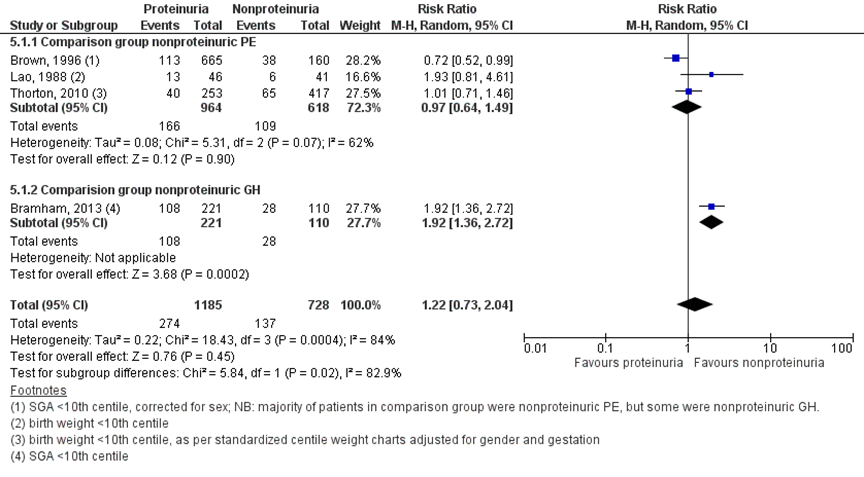
Five studies (Bramham, 2013; Brown, 1996; Homer, 2008; Lao, 1988; Thornton, 2010) reported the outcome measure low birth weight for gestational age. Four studies reported this as small for gestational age (SGA) < 10th centile (Bramham, 2013; Brown, 1996; Homer, 2008, Lao, 1988). As Homer (2008) only reported the outcome measure for women with nonproteinuric pre-eclampsia compared to nonproteinuric gestational hypertension, this study was excluded from this analysis. Brown (1996) reported that SGA was corrected for sex. Thornton (2010) reported low birth weight for gestational age as birth weights below the 10th or 3rd centile, as per standardized centile weight charts adjusted for gender and gestation. Bramham (2013) also reported SGA < 5th centile. For the analysis of the outcome measure low birth weight for gestational age only outcome measures with definitions of low birth weight < 10th centile were included (Bramham, 2013; Brown, 1996; Lao, 1988; Thornton, 2010).
Bramham (2013) compared to women with nonproteinuric gestational hypertension, Brown (1996), Lao (1988) and Thornton (2010) made comparisons to women with nonproteinuric pre-eclampsia.
Low birth weight for gestational age (< 10th centile) was reported for 274 of 1184 (23.1%) infants of women with a proteinuric hypertensive disorder of pregnancy comparted to 137 of 728 (18.8%) infants of women with non-proteinuric hypertensive disorder of pregnancy (RR 1.22 (95% CI 0.73 to 2.04)) (Figure 10).
Figure 10 Low birth weight for gestational age (<10th centile), comparison hypertensive disorder of pregnancy with proteinuria versus hypertensive disorder of pregnancy without proteinuria
Z: p-waarde van het gepoolde effect; df: degrees of freedom (vrijheidsgraden); I2: statistische heterogeniteit; CI: betrouwbaarheidsinterval
11. Preterm birth < 37 weeks
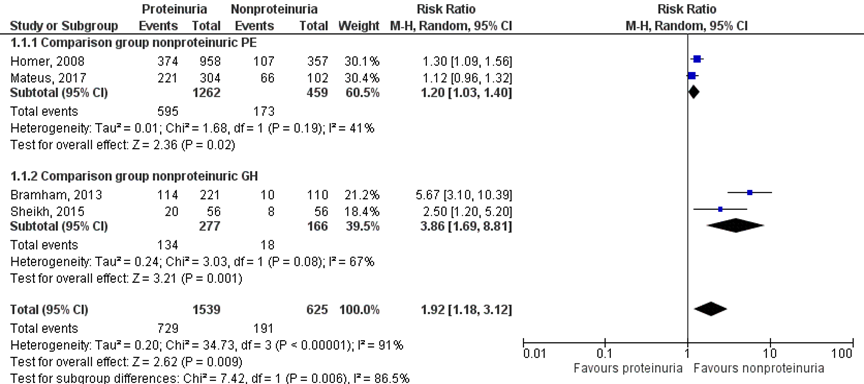
Four studies reported results regarding the outcome measure preterm delivery < 37 weeks (Bramham, 2013; Homer, 2008; Mateus, 2017; Sheikh, 2015). Homer (2008) and Mateus (2017) compared to women with non-proteinuric pre-eclampsia, while Bramham (2013) and Sheikh (2015) made comparisons with women with gestational hypertension (without proteinuria). Therefore, a meta-analysis with two subgroups was performed according to the comparison group (non-proteinuric pre-eclampsia versus non-proteinuric gestational hypertension) (Figure 11).
Preterm delivery < 37 weeks was reported for 729 of 1539 (47.4%) pregnancies of women with proteinuric hypertensive disorder of pregnancy compared to 191 of 625 (30.6%) pregnancies of women with non-proteinuric hypertensive disorder of pregnancy (RR 1.92 (1.18 to 3.12)) (Figure 11).
Figure 11 Preterm delivery < 37 weeks, comparison hypertensive disorder of pregnancy with proteinuria versus hypertensive disorder of pregnancy without proteinuria
Z: p-waarde van het gepoolde effect; df: degrees of freedom (vrijheidsgraden); I2: statistische heterogeniteit; CI: betrouwbaarheidsinterval
Level of evidence of the literature
Observational studies start at a GRADE low.
The outcome measure pre-eclampsia was reported as severe pre-eclampsia by one study (Waugh, 2017). The level of evidence regarding the outcome measure severe pre-eclampsia in pregnant women with hypertension without pre-existing proteinuria was not downgraded. Even though Waugh (2017) only reported the results for proteinuria based on protein/creatinine ratio instead of 24-hour urine, it is not suspected that this will lead to a different result for the outcome measure severe pre-eclampsia.
The level of evidence regarding the outcome measure eclampsia in pregnant women with hypertension without pre-existing proteinuria is downgraded with one level to a very low GRADE due to imprecision (small number of events, wide 95% confidence interval).
The level of evidence regarding the outcome measure pulmonary oedema in pregnant women with hypertension without pre-existing proteinuria is downgraded with one level to a very low GRADE due to imprecision (small number of events, wide 95% confidence interval).
The level of evidence regarding the outcome measure hepatic haemorrhage in pregnant women with hypertension without pre-existing proteinuria is downgraded with one level to a very low GRADE due to imprecision (no events).
The level of evidence regarding the outcome measures renal insufficiency in pregnant women with hypertension without pre-existing proteinuria is downgraded with one level to a very low GRADE due to imprecision (confidence interval of pooled effect includes no significant effect (RR=1) and no clinically relevant effect (RR≤0.8) and inconsistency (heterogeneity in the direction of effect between studies).
The level of evidence regarding the outcome measure cerebral haemorrhage could not be assessed with GRADE. This outcome measure was not studied in the included studies.
The level of evidence regarding the outcome measure hepatic haemorrhage in pregnant women with hypertension without pre-existing proteinuria is downgraded with one level to a very low GRADE due to imprecision (no events).
The level of evidence regarding the outcome measure placental abruption in pregnant women with hypertension without pre-existing proteinuria is downgraded with one level to a very low GRADE due to imprecision (confidence interval of pooled effect includes no significant effect (RR=1) and no clinically relevant effect (RR≤0.8) and inconsistency (heterogeneity in the direction of effect between studies).
The level of evidence regarding the outcome measure perinatal death of the fetus in pregnant women with hypertension without pre-existing proteinuria is downgraded with one level to a very low GRADE due to imprecision (confidence interval of pooled effect includes no significant effect (RR=1) and no clinically relevant effect (RR≤0.8) and inconsistency (Brown, 1996 and Thornton, 2010 reported an opposite effect compared to the other included studies).
The level of evidence regarding the outcome measure intra-uterine death of the fetus in pregnant women with hypertension without pre-existing proteinuria is downgraded with one level to a very low GRADE due to imprecision (confidence interval of pooled effect includes no significant effect (RR=1) and no clinically relevant effect (RR≤0.8).
The level of evidence regarding the outcome measure neonatal death of the neonate in pregnant women with hypertension without pre-existing proteinuria is downgraded with one level to a very low GRADE due to imprecision (confidence interval of pooled effect includes no significant effect (RR=1) and no clinically relevant effect (RR≤0.8).
The level of evidence regarding the outcome measure NICU admission of neonates from pregnant women with hypertension without pre-existing proteinuria is downgraded with one level to a very low GRADE due to imprecision (confidence interval of pooled effect includes no significant effect (RR=1) and no clinically relevant effect (RR≤0.8) and inconsistency (heterogeneity in the direction of effect between studies).
The level of evidence regarding the outcome measure low birth weight for gestational age of neonates from pregnant women with hypertension without pre-existing proteinuria is downgraded with one level to a very low GRADE due to imprecision (confidence interval of pooled effect includes no significant effect (RR=1) and no clinically relevant effect (RR≤0.8) and inconsistency (heterogeneity in the direction of effect between studies).
The level of evidence regarding the outcome measure preterm birth < 37 weeks in pregnant women with hypertension without pre-existing proteinuria is not downgraded with GRADE (confidence interval of pooled effect includes a clinically and statistically significant effect).
Subquestion 1 - optimal cut-off value
A systematic review of the literature was performed to answer the following subquestion:
What is the optimal cut-off value for the protein-creatinine ratio (PCR) test in women with hypertension during pregnancy?
P: patients pregnant women with hypertension;
I: intervention PCR: cut-off A (varying cut-offs);
C: control PCR: cut-off B;
R: reference test 24 hour urine (> 300 milligram);
O: outcome measure sensitivity, specificity, positive predictive value, negative predictive value.
Relevant outcome measures
The guideline development group considered sensitivity and specificity as a critical outcome measure for decision making; and positive and negative predictive value as an important outcome measure for decision making.
The task force adhered to the ISSHP (The International Society for the Study of Hypertension in Pregnancy) definition for pre-eclampsia, as maternal presentation and is characterized by development of maternal hypertension and proteinuria/other maternal organ disturbance or fetal growth restriction during the second half of pregnancy (> 20 weeks of gestation) (Tranquilli, 2014). For other outcome measures the task force did not define the outcome at forehand, but used the definitions used in the studies.
For this diagnostic question, a threshold for a clinically relevant difference was not determined at forehand.
Search and select (Methods)
Two systematic searches were performed for the subquestions (see below). The working group first selected relevant articles for both subquestions from the search for subquestion 1. Thereafter, the working group selected articles from the second search for subquestion 2. The search for subquestion 2 was deduplicated for articles included in the search for the subquestion 1.
The databases Medline (via OVID) and Embase (via Embase.com) were searched with relevant search terms from 1980 to October 2019. The detailed search strategy is depicted under the tab Methods. The systematic literature search resulted in 329 hits. Studies for subquestion 1 were selected based on the following criteria: 1) the study compared cut-off A of the PCR to cut-off B of the PCR in pregnant women with hypertension and proteinuria; 2) the diagnostic accuracy was reported (i.e. sensitivity, specificity and/or positive predictive value, negative predictive value). Seventy-eight studies were initially selected based on title and abstract screening. After reading the full text, six studies were included and 71 studies were excluded (see the table with reasons for exclusion under the tab Methods). The majority of the excluded studies compared 1 cut-off value of the PCR to 24 hours urine.
Results
One systematic review and meta-analysis (Morris, 2012) was identified and supplemented with five cohort studies published thereafter (Amin, 2014; Cheung, 2016; Kumari, 2013; Stout, 2013; Wilkinson, 2013). It is important to note at forehand that 11 out of 15 studies included by Morris (2012) examined multiple threshold values of the PCR compared to 24-hour urine; four included studies compared only one threshold value of the PCR with 24-hour urine. Nevertheless, it was decided to include the entire review because analyses by Morris (2012) could not be replicated without these four studies and otherwise valuable information would be lost. In addition, it was not possible to replicate the analysis by Morris (2012) with data from the five additionally identified studies. The results from these studies are reported descriptively.
Subquestion 2 - risk of proteinuria
A systematic review of the literature was performed to answer the following subquestion:
What is the added risk of proteinuria in women with gestational hypertension without preexistent proteinuria regarding severe neonatal and maternal morbidity?
P: patients pregnant women with gestational hypertension without preexisting proteinuria;
I: intervention proteinuria > 300 milligram/ 24 hours;
C: control no proteinuria;
O: outcome measure pre-eclampsia, eclampsia, pulmonary edema, hepatic hemorrhage, renal insufficiency, cerebral hemorrhage, placental abruption, perinatal death (intra-uterine death and neonatal death), NICU admission, low birth weight for gestational age, preterm birth < 37weeks.
Relevant outcome measures
The guideline development group considered eclampsia as a critical outcome measure for decision making; and pre-eclampsia, pulmonary edema, hepatic hemorrhage, renal insufficiency, cerebral hemorrhage, placental abruption, perinatal death (intra-uterine death and neonatal death), NICU admission, low birth weight for gestational age and preterm birth < 37 weeks as important outcome measures for decision making.
For the outcome measures eclampsia, pulmonary oedema, hepatic haemorrhage, renal insufficiency, cerebral haemorrhage, placental abruption, pre-term birth < 37 weeks and intra-uterine death, any statistically significant difference was considered as a clinically important difference between groups. For all other outcome measures, the GRADE default - a difference of 25% in the relative risk for dichotomous outcomes (Schünemann, 2013) and 0.5 standard deviation for continuous outcomes - was taken as a minimal clinically important difference.
Search and select (Methods)
Two systematic searches were performed for the subquestions (see above). The working group first selected relevant articles for both subquestions from the search for subquestion 1. Then, the working group selected articles from the second search for subquestion 2. The search for subquestion 2 was deduplicated for articles included in the search for the subquestion 1.
The databases Medline (via OVID) and Embase (via Embase.com) were searched with relevant search terms from 1999 until October 2019. The detailed search strategy is depicted under the tab Literature search strategy. The systematic literature search resulted in 843 hits (these hits were deduplicated for the search for subquestion 1). Studies for subquestion 2 were selected based on the following criteria: 1) the study compared pregnant women with proteinuria versus pregnant women without proteinuria; 2) at least one of the predefined outcome measures was reported.
Fifty-five studies were initially selected based on title and abstract screening: four were retrieved from the search from subquestion 1; 51 were retrieved in the search from subquestion 2. After reading the full text, two additional studies were retrieved by scanning the reference lists of full text articles. Of the 57 studies in total, 47 studies were excluded (see the table with reasons for exclusion under the tab Methods). In total 10 studies were included.
Results
Ten studies were included in the analysis of the literature. Important study characteristics and results are summarized in the evidence tables. The assessment of the risk of bias is summarized in the risk of bias tables.
- Amin SV, Illipilla S, Hebbar S, Rai L, Kumar P, Pai MV. Quantifying proteinuria in hypertensive disorders of pregnancy. Int J Hypertens. 2014;2014:941408.
- Astor BC, Matsushita K, Gansevoort RT, van der Velde M, Woodward M, Levey AS, Jong PE, Coresh J; Chronic Kidney Disease Prognosis Consortium, Astor BC, Matsushita K, Gansevoort RT, van der Velde M, Woodward M, Levey AS, de Jong PE, Coresh J, El-Nahas M, Eckardt KU, Kasiske BL, Wright J, Appel L, Greene T, Levin A, Djurdjev O, Wheeler DC, Landray MJ, Townend JN, Emberson J, Clark LE, Macleod A, Marks A, Ali T, Fluck N, Prescott G, Smith DH, Weinstein JR, Johnson ES, Thorp ML, Wetzels JF, Blankestijn PJ, van Zuilen AD, Menon V, Sarnak M, Beck G, Kronenberg F, Kollerits B, Froissart M, Stengel B, Metzger M, Remuzzi G, Ruggenenti P, Perna A, Heerspink HJ, Brenner B, de Zeeuw D, Rossing P, Parving HH, Auguste P, Veldhuis K, Wang Y, Camarata L, Thomas B, Manley T. Lower estimated glomerular filtration rate and higher albuminuria are associated with mortality and end-stage renal disease. A collaborative meta-analysis of kidney disease population cohorts. Kidney Int. 2011 Jun;79(12):1331-40.
- Bramham K, Poli-de-Figueiredo CE, Seed PT, Briley AL, Poston L, Shennan AH, Chappell LC. Association of proteinuria threshold in pre-eclampsia with maternal and perinatal outcomes: a nested case control cohort of high risk women. PLoS One. 2013 Oct 10;8(10):e76083.
- Brown MA, Buddle ML. Hypertension in pregnancy: maternal and fetal outcomes according to laboratory and clinical features. Med J Aust. 1996 Oct 7;165(7):360-5. PubMed PMID: 8890841.
- Cheung HC, Leung KY, Choi CH. Diagnostic accuracy of spot urine protein-to-creatinine ratio for proteinuria and its association with adverse pregnancy outcomes in Chinese pregnant patients with pre-eclampsia. Hong Kong Med J. 2016 Jun;22(3):249-55.
- Dong X, Gou W, Li C, Wu M, Han Z, Li X, Chen Q. Proteinuria in preeclampsia: Not essential to diagnosis but related to disease severity and fetal outcomes. Pregnancy Hypertens. 2017 Apr;8:60-64. doi: 10.1016/j.preghy.2017.03.005. Epub 2017 Mar 20. PubMed PMID: 28501282.
- Gangaram R, Naicker M, Moodley J. Comparison of pregnancy outcomes in women with hypertensive disorders of pregnancy using 24-hour urinary protein and urinary microalbumin to creatinine ratio. Int J Gynaecol Obstet. 2009 Oct;107(1):19-22. doi: 10.1016/j.ijgo.2009.05.023. Epub 2009 Aug 9. PubMed PMID: 19666171.
- Hall DR, Odendaal HJ, Steyn DW, Grové D. Urinary protein excretion and expectant management of early onset, severe pre-eclampsia. Int J Gynaecol Obstet. 2002 Apr;77(1):1-6.
- Homer CS, Brown MA, Mangos G, Davis GK. Non-proteinuric pre-eclampsia: a novel risk indicator in women with gestational hypertension. J Hypertens. 2008 Feb;26(2):295-302. doi: 10.1097/HJH.0b013e3282f1a953. PubMed PMID: 18192844.
- Kumari A, Singh A, Singh R. Evaluation of rapid diagnostic methods of urinary protein estimation in patients of preeclampsia of advanced gestational age. J Obstet Gynaecol India. 2013;63(5):306‐310. doi:10.1007/s13224-012-0343-5.
- Lao TT, Chin RK, Lam YM. The significance of proteinuria in pre-eclampsia; proteinuria associated with low birth weight only in pre-eclampsia. Eur J Obstet Gynecol Reprod Biol. 1988 Oct;29(2):121-7. PubMed PMID: 3192032.
- Li B, Lin L, Yang H, Zhu Y, Wei Y, Li X, Chen D, Zhao X, Cui S, Ding H, Ding G, Meng H, Wei H, Sun X, Xin H. The value of the 24-h proteinuria in evaluating the severity of preeclampsia and predicting its adverse maternal outcomes. Hypertens Pregnancy. 2018 Aug;37(3):118-125. doi: 10.1080/10641955.2018.1487564. Epub 2018 Jul 24. PubMed PMID: 30040505.
- Mateus J, Newman R, Sibai BM, Li Q, Barton JR, Combs CA, Guzman E, Boggess KA, Gyamfi C, von Dadelszen P, Woelkers D. Massive Urinary Protein Excretion Associated with Greater Neonatal Risk in Preeclampsia. AJP Rep. 2017 Jan;7(1):e49-e58. doi: 10.1055/s-0037-1601866. PubMed PMID: 28348923; PubMed Central PMCID: PMC5365400.
- Morris RK, Riley RD, Doug M, Deeks JJ, Kilby MD. Diagnostic accuracy of spot urinary protein and albumin to creatinine ratios for detection of significant proteinuria or adverse pregnancy outcome in patients with suspected pre-eclampsia: systematic review and meta-analysis. BMJ. 2012 Jul 9;345:e4342. doi: 10.1136/bmj.e4342. Review. PubMed PMID: 22777026; PubMed Central PMCID: PMC3392077.
- Payne BA, Hutcheon JA, Ansermino JM, Hall DR, Bhutta ZA, Bhutta SZ, Biryabarema C, Grobman WA, Groen H, Haniff F, Li J, Magee LA, Merialdi M, Nakimuli A, Qu Z, Sikandar R, Sass N, Sawchuck D, Steyn DW, Widmer M, Zhou J, von Dadelszen P; miniPIERS Study Working Group. A risk prediction model for the assessment and triage of women with hypertensive disorders of pregnancy in low-resourced settings: the miniPIERS (Pre-eclampsia Integrated Estimate of RiSk) multi-country prospective cohort study. PLoS Med. 2014 Jan;11(1):e1001589.
- Schünemann H, Brożek J, Guyatt G, et al. GRADE handbook for grading quality of evidence and strength of recommendations. Updated October 2013. The GRADE Working Group, 2013. Available from http://gdt.guidelinedevelopment.org/central_prod/_design/client/handbook/handbook.html.
- Sheikh S, Haq G, Kazi S. Frequency of preterm delivery in proteinuric verses non proteinuric pregnancy induced hypertension. J Pak Med Assoc. 2015 Nov;65(11):1178-81. PubMed PMID: 26564288.
- Stout MJ, Scifres CM, Stamilio DM. Diagnostic utility of urine protein-to-creatinine ratio for identifying proteinuria in pregnancy. J Matern Fetal Neonatal Med. 2013;26(1):66‐70. doi:10.3109/14767058.2012.727048.
- Thangaratinam S, Coomarasamy A, O'Mahony F, Sharp S, Zamora J, Khan KS, Ismail KM. Estimation of proteinuria as a predictor of complications of pre-eclampsia: a systematic review. BMC Med. 2009 Mar 24;7:10.
- Thangaratinam S, Allotey J, Marlin N, et al. Development and validation of Prediction models for Risks of complications in Early-onset Pre-eclampsia (PREP): a prospective cohort study. Southampton (UK): NIHR Journals Library; 2017 Apr. (Health Technology Assessment, No. 21.18.) Chapter 6, External validation of the prediction models for complications in women with early-onset pre-eclampsia. Available from: https://www.ncbi.nlm.nih.gov/books/NBK425678/.
- Thornton CE, Makris A, Ogle RF, Tooher JM, Hennessy A. Role of proteinuria in defining pre-eclampsia: clinical outcomes for women and babies. Clin Exp Pharmacol Physiol. 2010 Apr;37(4):466-70. doi: 10.1111/j.1440-1681.2009.05334.x. Epub 2009 Nov 23. PubMed PMID: 19930427.
- Tranquilli AL, Dekker G, Magee L, Roberts J, Sibai BM, Steyn W, Zeeman GG, Brown MA. The classification, diagnosis and management of the hypertensive disorders of pregnancy: A revised statement from the ISSHP. Pregnancy Hypertens. 2014 Apr;4(2):97-104.
- Waugh J, Hooper R, Lamb E, Robson S, Shennan A, Milne F, Price C, Thangaratinam S, Berdunov V, Bingham J. Spot protein-creatinine ratio and spot albumin-creatinine ratio in the assessment of pre-eclampsia: a diagnostic accuracy study with decision-analytic model-based economic evaluation and acceptability analysis. Health Technol Assess. 2017 Oct;21(61):1-90.
- Wilkinson C, Lappin D, Vellinga A, Heneghan HM, O'Hara R, Monaghan J. Spot urinary protein analysis for excluding significant proteinuria in pregnancy. J Obstet Gynaecol. 2013 Jan;33(1):24-7.
- van Zuilen AD, Bots ML, Dulger A, van der Tweel I, van Buren M, Ten Dam MA, Kaasjager KA, Ligtenberg G, Sijpkens YW, Sluiter HE, van de Ven PJ, Vervoort G, Vleming LJ, Blankestijn PJ, Wetzels JF. Multifactorial intervention with nurse practitioners does not change cardiovascular outcomes in patients with chronic kidney disease. Kidney Int. 2012 Sep;82(6):710-7.
- von Dadelszen P, Payne B, Li J, Ansermino JM, Broughton Pipkin F, Côté AM, Douglas MJ, Gruslin A, Hutcheon JA, Joseph KS, Kyle PM, Lee T, Loughna P, Menzies JM, Merialdi M, Millman AL, Moore MP, Moutquin JM, Ouellet AB, Smith GN, Walker JJ, Walley KR, Walters BN, Widmer M, Lee SK, Russell JA, Magee LA; PIERS Study Group. Prediction of adverse maternal outcomes in pre-eclampsia: development and validation of the fullPIERS model. Lancet. 2011 Jan 15;377(9761):219-27.
Subquestion 1 - optimal cut-off value
Evidence table for systematic reviews of diagnostic test accuracy studies
Research question: What is the optimal cut-off value for the protein-creatine ratio?
|
Study reference |
Study characteristics |
Patient characteristics
|
Index test (test of interest) |
Reference test
|
Follow-up |
Outcome measures and effect size |
Comments |
|
Morris, 2012
PS., study characteristics and results are extracted from the SR (unless stated otherwise) |
SR and meta-analysis
Literature search up to January, 2011
A: Al, 2004 B: Aggarwal, 2008 C: Durnwald, 2003 D: Dwyer, 2008 E: Leanos, 2007 F: Ramos, 1999 G: Robert, 1997 H: Rodriquez-Thompson, 2001 I: Saudan, 1997 J: Schubert, 2006 K: Shahbazian, 2008 L: Skweres, 2006 M: Taherian, 2006 N: Wheeler, 2007 O: Yamasmit, 2004
Study design: cohort, case-control (prospective / retrospective) A: cohort (retrospective) B: diagnostic accuracy study (prospective) C: cohort (prospective) D: cohort (prospective) E: cohort (cross-sectional) F: cohort (cross-sectional) G: cohort (unclear) H: case-control study I: cohort (prospective) J: not reported K: cohort (prospective) L: cohort (unclear) M: cohort (prospective/cross-sectional) N: cohort (unclear) O: cohort (prospective)
Setting and Country: A: secondary care, Turkey B: secondary care, India C: tertiary care, USA D: tertiary care, USA E: secondary care, Mexico F: secondary care, Brazil G: tertiary care, cohort H: secondary care, USA I: secondary care, Australia J: secondary care, USA K: tertiary care, Iran L: secondary care, Poland. M: secondary care, Iran N: secondary care, USA O: tertiary care, Thailand.
Source of funding and conflicts of interest: (commercial / non-commercial funding/ industrial co-authorship / potential conflicts of interest )
Not reported per study.
Funding: RKM is funded by a National Institute for Health Research clinical lectureship. RR and JD are supported by funding from the Medical Research Council Hub for Trials Methodology Research at the University of Birmingham (MRC grant ID G0800808).
Competing interests: All authors have completed the Unified Competing Interest form at www.icmje.org/coi_disclosure.pdf (available on request from the corresponding author) and declare: no support from any organisation for the submitted work; no financial relationships with any organisations that might have an interest in the submitted work in the previous three years; no other relationships or activities that could appear to have influenced the submitted work. |
Inclusion criteria SR: population—pregnant women with suspected pre-eclampsia (hypertension with or without proteinuria); index test—urinary protein to creatinine ratio or albumin to creatinine ratio; reference standard—urinary protein excretion over 24 hours or adverse pregnancy outcome (as defined by authors of included studies); study design—diagnostic accuracy studies, observational studies, and randomised controlled trials
Exclusion criteria SR: ase series with fewer than 10 cases. We also excluded studies that evaluated the protein to creatinine ratio or albumin to creatinine ratio in women with medical conditions other than hypertension and those that used a reference test other than 24 hour collection or adverse pregnancy outcome.
15 studies included. Five studies on ACR were included by Morris (2012) as well, but are left out of this analysis.
Important patient characteristics: Number of patients; characteristics important to the research question; for example, age, sex, bmi,...
N total (N analyzed), mean age, mean gestational age at test, % nulliparous: A: 221 (185), median 30 (17-44), median 32 (22-40), 54% B: 155 (120), mean 29 (SD not reported), mean 32 (SD not reported), 66% C: 220 (220), mean 26.1 (SD not reported), mean 36.5 (SD not reported), % not reported D: 155 (116), not reported, mean 30.8 (SD 6.2), 41% E: 1198 (927), 28.6 (SD 6.2), 33 (SD not reported, 75%. F: 47 (47), 29.3 (SD 6.7), ≥20, 52% G: 71 (71), 29 (15-39), 34 (22-41), % not reported. H: 138 (138), 30 (16-49), not reported, 52%. I: 100 (100), not reported, not reported, % not reported. J: 15 (15), not reported, >20 weeks, % not reported. K: 117 (81), 26.5+/-3.6 (17- 36), 34.4+/-4.7 (21-41), % not reported. L: 44 (44), 30.05 (20-42), 35+3 (21-41), % not reported. M: 100 (100), 27.3, 33.26, % not reported. N: 154 (126), 26.6+/-5.8, 34.0+/-3.3, % not reported O: 55 (42), 30.6+/-5.83, 35.0+/-3.63, 47.6%
Sex: 100%F
|
Describe index and comparator tests* and cut-off point(s):
All index tests: PCR
A: 0.13-0.49 B: 0.66-1.35 C: 0.15-0.3 (significant) 1.9-5.0 (severe) D: 0.15-0.39 (significant) 2-13.53 (severe) E: 0.3 F: 0.5 G: 0.3 H: 0.14-0.21 I: 0.2-0.45 J: 0.15-0.16 K: 0.2 L: 0.15-0.3 M: 0.14-0.20 N: 0.21-0.30 O: 0.19-0.32
|
Describe reference test and cut-off point(s):
All reference tests: 24-hour urine (≥300mg/24 hrs)
Prevalence (%) (based on refence test at specified cut-off point) A: 21% B: 87% C: 76% (significant), 8% severe D: 48% (significant) 3% (severe) E: 30% F: 55% (significant) 52% (severe) G: 41% H: 50% I: 14% J: 60% K: 47% L: 45% M: 73% N: 54% (significant) 0% (severe) O: 69%
For how many participants were no complete outcome data available?
This was unclear, but Morris (2012) did report the number of women included (n women analysed), discrepancies can be observed here. A: 221 (185) B: 155 (120) C: 220 (220) D: 155 (116) E: 1198 (927) F: 47 (47) G: 71 (71) H: 138 (138) I: 100 (100) J: 15 (15) K: 117 (81) L: 44 (44) M: 100 (100) N: 154 (126) O: 55 (42)
Reasons for incomplete outcome data described?
Not described by Morris (2012), unclear. |
Endpoint of follow-up: Not reported |
Outcome measures and effect size (include 95%CI and p-value if available):
Outcome measure-1/2: sensitivity / specificity
A multivariate random effects meta-analysis was performed to synthesize all estimates, accounting for within and between study correlation. With these summary estimates per threshold value, a regression model was fitted to plot a receiver operating characteristics curve (ROC curve). The ROC curve was used to analyze the optimum summary estimate.
See Table 1 in text for complete overview of summary estimate per threshold value of the PCR.
Figure 1 shows the summary receiver operating characteristics curve for the constrained estimates. The optimum threshold for PCR to detect significant proteinuria (>300mg/24 hours), that optimizes sensitivity and specificity combined, was between 0.30 to 0.35 (relating to sensitivity and specificity values above 75%). No threshold gave a summary estimate above 80% for both sensitivity and specificity, and considerable heterogeneity existed in diagnostic accuracy across studies at most thresholds.
Outcome measure-3/4: positive and negative predictive value.
Morris (2012) calculated the positive and negative predictive value of the PCR compared to 24-hour urine for three different prevalences: 0.2, 0.5 and 0.8. The predicted values depended on the cut-off value chosen and the prevalence assumed. Complete overview of results is presented in appendix C-D-E of the paper by Morris (2012), which can be shown by request but due to its size it is not incorporated here in text.
Results show that, For example, with a high prevalence (0.8) high positive and negative predictive values above 0.85 were achieved. However, when the prevalence was low (for example, 0.2), the negative predictive value remained above 0.85, but positive predictive value is then around 0.4.
PS. pooling of test accuracy data should be based on bivariate analysis of sensitivity and specificy; always mention the cut-off points used
|
Study quality (ROB): Morris (2012) used QUADAS to assess the quality of the papers and used the STARD checklist to assess elements of study design that were likely to have a direct relation to bias in a study of test accuracy.
“We found good compliance with appropriate population spectrum, selection criteria adequately described, appropriate reference standard, and adequate description of index and reference standard. Blinding of the assessors of the outcome measure to the results of the albumin to creatinine ratio or protein to creatinine ratio was poorly reported (3/20 studies). No studies reported on the use of any treatment in between the albumin to creatinine ratio or protein to creatinine ratio and delivery or whether the results of the tests were used in determining patients’ management. Verification bias was minimised, as the number of eligible women progressing to the reference standard in included studies was more than 90% in 18/20. Five out of the 20 included studies used less than 80% of included women in the final analysis; reasons for this included exclusion after trial entry, lack of verification with reference standard, and loss to follow-up. In 379 (13%) cases this was due to incomplete 24 hour urine collection.”
Place of the index test in the clinical pathway: replacement (24-hour is golden standard, PCR could replace 24-hour standard).
Choice of cut-off point: all cut-off points for the PCR were studied, included studies examined cut-off values between 0.13-0.50.
Facultative:
Brief description of author’s conclusion “The optimum threshold for the spot protein to creatinine ratio to detect proteinuria >0.3 g/day is between 0.30 and 0.35, giving summary sensitivity and specificity values above 0.75 Insufficient evidence exists for determination of how protein to creatinine ratio should be used in clinical practice, owing to large heterogeneity in diagnostic accuracy and prevalence across studies.”
Personal remarks on study quality, conclusions, and other issues (potentially) relevant to the research question
Sensitivity analyses (excluding small studies; excluding low quality studies; excluding case-control type of studies; relevant subgroup-analyses); mention only analyses which are of potential importance to the research question
Heterogeneity: clinical and statistical heterogeneity; clinical: enough similarities in patient characteristics, diagnostic tests (strategy) to allow pooling? For pooled data: assessment of statistical heterogeneity and, more importantly, assessment of the reasons for heterogeneity (if present)? Note: sensitivity and specificity depend on the situation in which the test is being used and the thresholds that have been set, and sensitivity and specificity are correlated; therefore, the use of heterogeneity statistics (p-values; I2) is problematic, and rather than testing whether heterogeneity is present, the reasons for heterogeneity should be examined. |
Abbreviations: ACR = albumin creatine ratio; PCR = protein creatine ratio, SD = standard deviation.
*comparator test equals the C of the PICO; two or more index/ comparator tests may be compared; note that a comparator test is not the same as a reference test (golden standard)
Evidence table for diagnostic test accuracy studies
Research question: What is the optimal cut-off value for the protein-creatine ratio (PCR) test in women with hypertension and proteinuria during pregnancy?
|
Study reference |
Study characteristics |
Patient characteristics
|
Index test (test of interest) |
Reference test
|
Follow-up |
Outcome measures and effect size |
Comments |
||||||||||||||||||||||||||||||||||||||||||
|
Amin, 2014 |
Type of study: retrospective? Observational cohort study
Setting and country: Tertiary care centre, India
Funding and conflicts of interest: Funding not reported. The authors declare that there is no conflict of interests regarding the publication of this paper |
Inclusion criteria: hypertensive disorders of the pregnancy were recruited after 20 weeks of gestation and these patients had detailed medical and obstetrical history ,general physical & systemic examinations, and other investigations required for the management.
Exclusion criteria: all cases of chronic renal disease, secondary hypertension due to immunological diseases such as lupus erythematosus, and overt diabetes mellitus. Patients who were delivered due to urgent indications for termination of pregnancy and hence could not complete 24 hour collection were also excluded.
N=102
Prevalence: 76.5%
Mean age ± SD: 27.4 (4.3)
Sex: 100% F
Other important characteristics: Type of hypertension n(%): Chronic hypertension 4(3.9%) Gestational hypertension 17(16.7%) Mild preeclampsia 22(21.6%) Severe preeclampsia 43(42.2%) Imminent eclampsia 13(12.7%) Eclampsia 3(2.9%) |
Describe index test: PCR
PCR = protein creatine concentrations in mg per 100 mL
Urinary total protein was analysed using Turbidimetric method with benzethonium chloride precipitation
Yrine creatine measurement was based upon Jaffe’s reaction.
Cut-off point(s): 0.30, 0.45, 0.60, 0.75, 0.90
Comparator test[1]: idem, different cut-off points
Cut-off point(s): see above
|
Describe reference test: 24 hour urine test
Expressed as mg/dL, estimated by formula
Total 24 hour urine protein excretion = urine protein concentration (mg/dL) x 24 hour urine volume in mL/100
Cut-off point(s): ≥300 mg/day
|
Time between the index test and reference test: random urine sample for PCR was collected prior to admission, 24 hour urine protein estimation was carried out after admission, exact timing unclear.
For how many participants were no complete outcome data available? 0 N (%) 0
Reasons for incomplete outcome data described? No, presumably sample with complete data selected. |
Outcome measures and effect size (include 95%CI and p-value if available):
95%CI and p values not available.
Sens Spec 0.30 89.7 54.2 0.45 82.1 87.5 0.60 75.6 87.5 0.75 67.9 100 0.90 61.5 100
PPV NPV 0.30 86.4 61.9 0.45 95.5 60 0.60 95.2 52.5 0.75 100 49.0 0.90 100 44.4 |
See full text for elaborate description of tests.
|
||||||||||||||||||||||||||||||||||||||||||
|
Cheung, 2016 |
Type of study: retrospective observational study
Setting and country: single centre, Hong Kong
Funding and conflicts of interest: All authors have disclosed no conflicts of interest. Funding not reported. |
Inclusion criteria: All Chinese pregnant women with a diagnosis of pre-eclampsia (new-onset proteinuric hypertension after 20 weeks of gestation) and who delivered at Queen Elizabeth Hospital in Hong Kong from January 2011 to December 2013 (36 months) were eligible for initial inclusion in this retrospective study
Exclusion criteria: Women were excluded from the study if they had pre-existing renal disease, chronic hypertension, or co-existing urinary tract infection (defined by a positive mid-stream urine culture).
N= 120
Prevalence:
Mean age ± SD: 34 (18-46)
Sex: 100%F
Other important characteristics:
|
Describe index test: uPCR
uPCR expressed as mg/mmol
Collected at any time of day.
Urine protein was measured with turbidimetric method based on benzthonium chloride reaction.
Urine creatine was measured using a kinetic colorimetric assay based on the Jaffé method.
The imprecision (coefficient of variation) of the urine protein assay was 3.7% at 0.18 g/L and 1.9% at 0.54 g/L. The imprecision of the urine creatinine assay was 6.9% at 7.0 mmol/L and 2.2% at 20.8 mmol/L.
Cut-off point(s): 20, 30, 33, 52
Comparator test: idem, see above, different cut-off values
Cut-off point(s): see above
|
Describe reference test: 24 hour urine
Collected within 24 hours.
Cut-off point(s): ≥300 mg/day
|
Time between the index test and reference test: exact timing unclear, but tests collected >1 day apart were excluded.
For how many participants were no complete outcome data available? N (%) 22 (18%) were not collected. 98 samples were collected, but 12 (12/98= 12%) were inadequate, 20 (20/98=20%) were collected more than 1 day apart. N=66 (66/120 (55%) with uPCR and 24 hour urine available.
Reasons for incomplete outcome data described? |
Outcome measures and effect size (include 95%CI and p-value if available):
p-values not reported
|
Of 432 cases of pre-eclampsia identified during the 36month study period, 175 (40.5%) had uPCR analysed after excluding cases without collection of uPCR before delivery or ordering because of individual clinician’s preference or because immediate delivery was expected. Of these 175 cases, 55 (31.4%) were excluded after review of medical records, including 28 non-Chinese patients, 24 cases with pre-existing hypertension or pre-existing renal disease, one woman with active urinary tract infection, one with missing information, and one who did not deliver at our hospital.
NB: Cheung 2016 reports adverse maternal and perinatal outcomes based on uPCR (not 24 hour urine). Given the diagnostic accuracy of the uPCR, the outcomes were not reported, because not all women are accurately classified. In addition, for this analysis 95 women (95/120) were selected, which includes women with incomplete samples. The data were therefore unreliable for inclusion. |
||||||||||||||||||||||||||||||||||||||||||
|
Kumari, 20 13 |
Type of study[2]: prospective, cross-sectional study
Setting and country: single centre, India.
Funding and conflicts of interest: not reported. |
Inclusion criteria: gestational age ≥32 weeks who were admitted in the maternity ward with signs and symptoms suggestive of preeclampsia were enrolled.
Exclusion criteria: chronic hypertension, diabetes mellitus, pre-existing renal disease, UTI, intrauterine fetal death, multiple gestations, preterm rupture of membrane, post term pregnancy.
N= 400
Prevalence: 77.5%
Mean age ± SD: 24.3 (2.6)
Sex: 100%F
Other important characteristics:
|
Describe index test: PCR
PCR = protein creatine concentrations in mg per dl
Urine protein concentration was estimated on Synchron CX-9 automated analyzer from Beckman, using the kits obtained from Randox. It was based on the principle that the coomassie reagent reacts with protein in an acidic milieu to form a colored complex and that the color intensity is proportional to the protein concentration.
Urine creatinine concentration was measured by modified Jaffe’s reaction which is based on the principle that creatinine in alkaline solution reacts with picric acid to form a colored complex. The intensity of the color formed is directly proportional to the creatinine concentration.
The UPCR was calculated by dividing the quantum of urine protein measured in mg/dl by urine creatinine in mg/dl.
Cut-off point(s): 0.2, 0.25, 0.3, 0.35, 0.4, 0.45
Comparator test[3]: idem, different cut-off points
Cut-off point(s): see above
|
Describe reference test[4]: 24 hour urine test.
Cut-off point(s): ≥300 mg/day
|
Time between the index test and reference test: within 1 day
For how many participants were no complete outcome data available? N (%) 0
Reasons for incomplete outcome data described? Presumably only complete cases selected. |
Outcome measures and effect size (include 95%CI and p-value if available)4:
|
|
||||||||||||||||||||||||||||||||||||||||||
|
Stout, 2013 |
Type of study[5]: retrospective cohort study
Setting and country: single centre, USA
Funding and conflicts of interest: Funding: not reported. The authors report no declarations of interest |
Inclusion criteria: all patients with signs or symptoms concerning for the diagnosis of preeclampsia who were seen in the obstetrical triage unit and underwent blood pressure monitoring and laboratory evaluation, which included UPC ratio assessment prior to initiation of a 24-h urine collection for total protein. Patients were identified for inclusion in the cohort by searching a hospital database using the CPT code for 24-h urine collection (84156). Only pregnant women after 20 weeks gestation who underwent evaluation for suspected preeclampsia were included in the final cohort
Exclusion criteria: Patients with proteinuria ≥300 mg in 24 h before 20 weeks of gestation were excluded
N= 356
Prevalence: 40.5%
Mean age ± SD: Protenuria: 27.5 (SD 6.7) No proteinuria: 26.8 (SD 6.5)
Sex: 100%F
Other important characteristics: |
Describe index test: PCR
PCR = protein creatine concentrations in mg/dL (presumed, not confirmed in text)
The first preeclampsia evaluation was used for each patient.
Random urine protein was assessed with end-point assay colorimetric (benzenethonium chloride) technique
Random urine creatine was assessed with enzymatic creatinase
Cut-off point(s): 0.08, 0.12, 0.19, 0.40, 0.45, 1.19
Comparator test[6]: idem, different cut-off points
Cut-off point(s): see above
|
Describe reference test[7]: 24 hour urine collection
Urine protein was assessed with end-point assay colorimetric (benzenethonium chloride) technique
Cut-off point(s): ≥300 mg/24 hours
|
Time between the index test and reference test: “Laboratory methodology during the study time frame remained constant”, 93.7% had a 24-h collection performed as an in-patient
For how many participants were no complete outcome data available? N (%) 0
Reasons for incomplete outcome data described? |
Outcome measures and effect size (include 95%CI and p-value if available)4:
|
We defined preeclampsia based on the American College of Obstetricians and Gynecologists (ACOG) diagnostic criteria including hypertension (systolic blood pressure ≥140 mm Hg, diastolic blood pressure ≥90 mm Hg) persisting for at least 6 h and significant proteinuria defined as greater than or equal to 300 mg in a 24-h urine collection |
||||||||||||||||||||||||||||||||||||||||||
|
Wilkinson, 2013 |
Type of study[8]: prospective diagnostic accuracy study
Setting and country: single centre, Ireland.
Funding and conflicts of interest: Funding not reported. The authors report no conflicts of interest. Th e authors alone are responsible for the content and writing of the paper. |
Inclusion criteria: all women with a gestation of 20 weeks or longer who were admitted for suspected pre-eclampsia. Consecutive recruitment.
Exclusion criteria: none.
N= 89 women (with 132 24-hour urine collections).
Prevalence: 44%
Mean age ± SD: not reported.
Sex: 100%F
Other important characteristics:
|
Describe index test: PCR
PCR = protein creatine concentrations in mg/mmol
Protein analysis was performed using the turbidimetric method.
The Roche Cobas 6000 (Roche Diagnostics GmbH, D68298, Mannheim) performed the protein, albumin and creatinine assays
Cut-off point(s): 30, 25, 20, 15, 10
Comparator test[9]: idem, different cut-off points
Cut-off point(s): see above |
Describe reference test[10]: 24-hour urine test
The 24UP were commenced at random daytimes to quantify urinary protein and creatinine excretion over a 24-hour period
Cut-off point(s): ≥300 mg/24 hr
|
Time between the index test en reference test: First void sample of 24-hour urine was used for PCR. 24-hour urine commenced at random daytimes.
For how many participants were no complete outcome data available? N (%) 0
Reasons for incomplete outcome data described? |
Outcome measures and effect size (include 95%CI and p-value if available)4:
Not reported. |
|
Table of quality assessment for systematic reviews of diagnostic studies
Based on AMSTAR checklist (Shea; 2007; BMC Methodol 7: 10; doi:10.1186/1471-2288-7-10) and PRISMA checklis (Moher, 2009; PLoS Med 6: e1000097; doi:10.1371/journal.pmed1000097)
Research question: What is the optimal cut-off value for the protein-creatine ratio?
|
Study
First author, year |
Appropriate and clearly focused question?1
Yes/no/unclear |
Comprehensive and systematic literature search?2
Yes/no/unclear |
Description of included and excluded studies?3
Yes/no/unclear |
Description of relevant characteristics of included studies?4
Yes/no/unclear |
Assessment of scientific quality of included studies?5
Yes/no/unclear |
Enough similarities between studies to make combining them reasonable?6
Yes/no/unclear |
Potential risk of publication bias taken into account?7
Yes/no/unclear |
Potential conflicts of interest reported?8
Yes/no/unclear |
|
Morris, 2012 |
Yes |
Yes |
Yes |
Yes |
Yes |
Unclear, high heterongenity among studies in methods of testing index and reference test, difference in prevalence of disease (18-87%) etc. |
Unclear |
No, not reported per included study. |
- Research question (PICO) and inclusion criteria should be appropriate (in relation to the research question to be answered in the clinical guideline) and predefined.
- Search period and strategy should be described; at least Medline searched.
- Potentially relevant studies that are excluded at final selection (after reading the full text) should be referenced with reasons.
- Characteristics of individual studies relevant to the research question (PICO) should be reported.
- Quality of individual studies should be assessed using a quality scoring tool or checklist (preferably QUADAS-2; COSMIN checklist for measuring instruments) and taken into account in the evidence synthesis.
- Clinical and statistical heterogeneity should be assessed; clinical: enough similarities in patient characteristics, diagnostic tests (strategy) to allow pooling? For pooled data: at least 5 studies available for pooling; assessment of statistical heterogeneity and, more importantly (see Note), assessment of the reasons for heterogeneity (if present)? Note: sensitivity and specificity depend on the situation in which the test is being used and the thresholds that have been set, and sensitivity and specificity are correlated; therefore, the use of heterogeneity statistics (p-values; I2) is problematic, and rather than testing whether heterogeneity is present, heterogeneity should be assessed by eye-balling (degree of overlap of confidence intervals in Forest plot), and the reasons for heterogeneity should be examined.
- There is no clear evidence for publication bias in diagnostic studies, and an ongoing discussion on which statistical method should be used. Tests to identify publication bias are likely to give false-positive results, among available tests, Deeks’ test is most valid. Irrespective of the use of statistical methods, you may score “Yes” if the authors discuss the potential risk of publication bias.
- Sources of support (including commercial co-authorship) should be reported in both the systematic review and the included studies. Note: To get a “yes,” source of funding or support must be indicated for the systematic review AND for each of the included studies.
Risk of bias assessment diagnostic accuracy studies (QUADAS II, 2011)
Research question: What is the optimal cut-off value for the protein-creatine ratio (PCR) test in women with hypertension and proteinuria during pregnancy?
|
Study reference |
Patient selection
|
Index test |
Reference standard |
Flow and timing |
Comments with respect to applicability |
|
Amin, 2014 |
Was a consecutive or random sample of patients enrolled? Unclear
Was a case-control design avoided? Yes
Did the study avoid inappropriate exclusions? Yes
|
Were the index test results interpreted without knowledge of the results of the reference standard? Unclear
If a threshold was used, was it pre-specified? No
|
Is the reference standard likely to correctly classify the target condition? Yes
Were the reference standard results interpreted without knowledge of the results of the index test? Unclear
|
Was there an appropriate interval between index test(s) and reference standard? Unclear
Did all patients receive a reference standard? Yes
Did patients receive the same reference standard? Yes
Were all patients included in the analysis? Yes (*see patient selection) |
Are there concerns that the included patients do not match the review question? No
Are there concerns that the index test, its conduct, or interpretation differ from the review question? No
Are there concerns that the target condition as defined by the reference standard does not match the review question? Nos
|
|
CONCLUSION: Could the selection of patients have introduced bias?
RISK: UNCLEAR |
CONCLUSION: Could the conduct or interpretation of the index test have introduced bias?
RISK: HIGH |
CONCLUSION: Could the reference standard, its conduct, or its interpretation have introduced bias?
RISK: LOW |
CONCLUSION Could the patient flow have introduced bias?
RISK: LOW |
|
|
|
Cheung, 2016 |
Was a consecutive or random sample of patients enrolled? Yes
Was a case-control design avoided? Yes
Did the study avoid inappropriate exclusions? Unclear, non-Chinese women were excluded, which was not explained.
|
Were the index test results interpreted without knowledge of the results of the reference standard? Unclear
If a threshold was used, was it pre-specified? No
|
Is the reference standard likely to correctly classify the target condition? Yes
Were the reference standard results interpreted without knowledge of the results of the index test? Unclear
|
Was there an appropriate interval between index test(s) and reference standard? Yes, 24 hour urine and urine PCR must have been collected within 1 day.
Did all patients receive a reference standard? Yes
Did patients receive the same reference standard? Yes
Were all patients included in the analysis? No, patients with inadequate collected samples were excluded. Eventually only 66/120 patients could be studied. |
Are there concerns that the included patients do not match the review question? Unclear
Are there concerns that the index test, its conduct, or interpretation differ from the review question? No
Are there concerns that the target condition as defined by the reference standard does not match the review question? No |
|
|
CONCLUSION: Could the selection of patients have introduced bias?
RISK: HIGH |
CONCLUSION: Could the conduct or interpretation of the index test have introduced bias?
RISK: HIGH |
CONCLUSION: Could the reference standard, its conduct, or its interpretation have introduced bias?
RISK: LOW |
CONCLUSION Could the patient flow have introduced bias?
RISK: HIGH |
|
|
Kumari 2013 |
Was a consecutive or random sample of patients enrolled? Yes, consecutive
Was a case-control design avoided? Yes
Did the study avoid inappropriate exclusions? Unclear
|
Were the index test results interpreted without knowledge of the results of the reference standard? Unclear
If a threshold was used, was it pre-specified? No
|
Is the reference standard likely to correctly classify the target condition? Yes
Were the reference standard results interpreted without knowledge of the results of the index test? Unclear
|
Was there an appropriate interval between index test(s) and reference standard? Yes
Did all patients receive a reference standard? Yes
Did patients receive the same reference standard? Yes
Were all patients included in the analysis? Yes |
Are there concerns that the included patients do not match the review question? No
Are there concerns that the index test, its conduct, or interpretation differ from the review question? No
Are there concerns that the target condition as defined by the reference standard does not match the review question? No
|
|
|
CONCLUSION: Could the selection of patients have introduced bias?
RISK: Unclear, presumably a sample with complete data was selected. |
CONCLUSION: Could the conduct or interpretation of the index test have introduced bias?
RISK: HIGH |
CONCLUSION: Could the reference standard, its conduct, or its interpretation have introduced bias?
RISK: LOW |
CONCLUSION Could the patient flow have introduced bias?
RISK: LOW |
|
|
Stout, 2013 |
Was a consecutive or random sample of patients enrolled? Yes
Was a case-control design avoided? Yes
Did the study avoid inappropriate exclusions? Yes
|
Were the index test results interpreted without knowledge of the results of the reference standard? Unclear
If a threshold was used, was it pre-specified? No
|
Is the reference standard likely to correctly classify the target condition? Yes
Were the reference standard results interpreted without knowledge of the results of the index test? Unclear
|
Was there an appropriate interval between index test(s) and reference standard? Yes
Did all patients receive a reference standard? Yes
Did patients receive the same reference standard? Yes
Were all patients included in the analysis? Yes |
Are there concerns that the included patients do not match the review question? No
Are there concerns that the index test, its conduct, or interpretation differ from the review question? No
Are there concerns that the target condition as defined by the reference standard does not match the review question? No
|
|
CONCLUSION: Could the selection of patients have introduced bias?
RISK: LOW |
CONCLUSION: Could the conduct or interpretation of the index test have introduced bias?
RISK: HIGH |
CONCLUSION: Could the reference standard, its conduct, or its interpretation have introduced bias?
RISK: LOW |
CONCLUSION Could the patient flow have introduced bias?
RISK: LOW |
|
|
|
Wilkinson, 2013 |
Was a consecutive or random sample of patients enrolled? Yes
Was a case-control design avoided? Yes
Did the study avoid inappropriate exclusions? Yes
|
Were the index test results interpreted without knowledge of the results of the reference standard? Unclear
If a threshold was used, was it pre-specified? No
|
Is the reference standard likely to correctly classify the target condition? Yes
Were the reference standard results interpreted without knowledge of the results of the index test? Unclear
|
Was there an appropriate interval between index test(s) and reference standard? Yes
Did all patients receive a reference standard? Yes
Did patients receive the same reference standard? Yes
Were all patients included in the analysis? Yes |
Are there concerns that the included patients do not match the review question? Unclear, there were no exclusion criteria. Therefore, patients with renal disease or other risk factors might have been included. Population characteristics were not reported, so this cannot be checked.
Are there concerns that the index test, its conduct, or interpretation differ from the review question? No
Are there concerns that the target condition as defined by the reference standard does not match the review question? No |
|
|
CONCLUSION: Could the selection of patients have introduced bias?
RISK: LOW |
CONCLUSION: Could the conduct or interpretation of the index test have introduced bias?
RISK: HIGH |
CONCLUSION: Could the reference standard, its conduct, or its interpretation have introduced bias?
RISK: LOW |
CONCLUSION Could the patient flow have introduced bias?
RISK: LOW |
|
Judgments on risk of bias are dependent on the research question: some items are more likely to introduce bias than others, and may be given more weight in the final conclusion on the overall risk of bias per domain:
Patient selection:
- Consecutive or random sample has a low risk to introduce bias.
- A case control design is very likely to overestimate accuracy and thus introduce bias.
- Inappropriate exclusion is likely to introduce bias.
Index test:
- This item is similar to “blinding” in intervention studies. The potential for bias is related to the subjectivity of index test interpretation and the order of testing.
- Selecting the test threshold to optimise sensitivity and/or specificity may lead to overoptimistic estimates of test performance and introduce bias.
Reference standard:
- When the reference standard is not 100% sensitive and 100% specific, disagreements between the index test and reference standard may be incorrect, which increases the risk of bias.
- This item is similar to “blinding” in intervention studies. The potential for bias is related to the subjectivity of index test interpretation and the order of testing.
Flow and timing:
- If there is a delay or if treatment is started between index test and reference standard, misclassification may occur due to recovery or deterioration of the condition, which increases the risk of bias.
- If the results of the index test influence the decision on whether to perform the reference standard or which reference standard is used, estimated diagnostic accuracy may be biased.
- All patients who were recruited into the study should be included in the analysis, if not, the risk of bias is increased.
Judgement on applicability:
Patient selection: there may be concerns regarding applicability if patients included in the study differ from those targeted by the review question, in terms of severity of the target condition, demographic features, presence of differential diagnosis or co-morbidity, setting of the study and previous testing protocols.
Index test: if index tests methods differ from those specified in the review question there may be concerns regarding applicability.
Reference standard: the reference standard may be free of bias but the target condition that it defines may differ from the target condition specified in the review question.
Subquestion 2 - risk of proteinuria
Evidence table for intervention studies (randomized controlled trials and non-randomized observational studies (cohort studies, case-control studies, case series))1
This table is also suitable for diagnostic studies (screening studies) that compare the effectiveness of two or more tests. This only applies if the test is included as part of a test-and-treat strategy - otherwise the evidence table for studies of diagnostic test accuracy should be used.
Research question: What is the risk of proteinuria in women with gestational hypertension without preexistent proteinuria regarding severe neonatal and maternal morbidity?
Notes:
- Prognostic balance between treatment groups is usually guaranteed in randomized studies, but non-randomized (observational) studies require matching of patients between treatment groups (case-control studies) or multivariate adjustment for prognostic factors (confounders) (cohort studies); the evidence table should contain sufficient details on these procedures.
- Provide data per treatment group on the most important prognostic factors ((potential) confounders).
- For case-control studies, provide sufficient detail on the procedure used to match cases and controls.
- For cohort studies, provide sufficient detail on the (multivariate) analyses used to adjust for (potential) confounders.
Risk of bias table for intervention studies (observational: non-randomized clinical trials, cohort and case-control studies)
Research question: What is the risk of proteinuria in women with gestational hypertension without preexistent proteinuria regarding severe neonatal and maternal morbidity?
|
Study reference
(first author, year of publication) |
Bias due to a non-representative or ill-defined sample of patients?1
(unlikely/likely/unclear) |
Bias due to insufficiently long, or incomplete follow-up, or differences in follow-up between treatment groups?2
(unlikely/likely/unclear) |
Bias due to ill-defined or inadequately measured outcome?3
(unlikely/likely/unclear) |
Bias due to inadequate adjustment for all important prognostic factors?4
(unlikely/likely/unclear) |
|
Bramham, 2013 |
Likely Women with one or more pre-existing risk factors for pre-eclampsia were included. |
Unclear Nested case-control cohort study: length of follow-up and loss to follow-up not reported. |
Unclear Definitions of several outcome measures were not given, for example perinatal death. |
Unlikely The reported risk ratios are adjusted for age and ethnicity |
|
Brown, 2013 |
Unclear Women with mild pre-eclampsia (defined as hypertension only) and severe pre-eclampsia (defined as hypertension and evidence of maternal organ dysfunction) were both included. Subsequently, women were divided into 2 groups: proteinuric hypertension and non-proteinuric hypertension. Thus, it appears that the comparison group exists of both women with and without organ dysfunction. Dipstick |
Unclear Prospective study: length of follow-up and loss to follow-up not reported. |
Unclear Definitions of the outcome measures are given. |
Unlikely No statistical adjustments have been made to raw results |
|
Dong, 2017 |
Unlikely |
Unlikely Length and loss to follow-up not described. Retrospective study |
Unclear Definitions of several outcome measures were not given, for example mild pre-eclampsia and fetal grow restriction. |
Unlikely No statistical adjustments have been made to raw results |
|
Gangaram, 2009 |
Unlikely |
Unlikely Prospective study -women recruited to the study were followed-up until 1 week post delivery. -missing data for 8 women (4.9%). Reasons: patients who delivered at other healthcare facilities or who delivered prior to coming to hospital because of no access to transport. |
Unclear Definitions of several outcome measures were not given, for example stillbirth and early neonatal death. |
Unlikely No statistical adjustments have been made to raw results |
|
Homer, 2008 |
Unlikely Dipstick |
Unlikely Length and loss to follow-up not described. Retrospective study of database |
Unclear Definitions of several outcome measures were not given, for example renal insufficiency, neurological complications, and liver disease. |
Unlikely Adjusted ORs are with adjustments for parity.
|
|
Lao, 1988 |
Unlikely Adjustment to the ACOG criteria of pre-eclampsia that both the systolic and diastolic pressures have to reach or exceed 140 mm Hg and 90 mm Hg, respectively, for a diagnosis of pre-eclampsia to be made. Sole use of dipstick Nulliparous |
Unclear Prospective study: length of follow-up and loss to follow-up not reported. |
Unclear Outcome measures gestation at deliver (weeks) and birth weight in grams and <10th centile are not clear enough. In addition, it is unclear whether admission into neonatal unit the same is as NICU admission. |
Unlikely No statistical adjustments have been made to raw results |
|
Li, 2018 |
Unclear Included were women with pregnancies complicated by hypertensive disorders of pregnancy, but no further definition was given. |
Unlikely Length and loss to follow-up not described. Retrospective study |
Unclear Definitions of several outcome measures were not given, for example pulmonary oedema, episode of eclampsia, and placenta abruption. |
Unlikely Adjusted for age and BMI. |
|
Mateus, 2017 |
Unlikely Twins and triplets included |
Unclear Secondary analysis of prospective cohort study. Length of follow-up and loss to follow-up not reported. |
Unclear Definitions of several outcome measures are not given, for example pulmonary oedema/ARDS. |
Unlikely No statistical adjustments have been made to raw results |
|
Sheikh, 2015 |
Unlikely Primigravidas Dipstick |
Unclear Prospective cohort study: length of follow-up and loss to follow-up not reported. |
Unlikely Only one outcome measure in the study: preterm delivery<37 weeks. |
Unlikely No statistical adjustments have been made to raw results |
|
Thorton, 2009 |
Unlikely Dipstick |
Unlikely Length of follow-up and loss to follow-up not described. Retrospective individual patient medical note review |
Unclear Definitions of several outcome measures were not given, for example pulmonary oedema and acute renal failure. |
Unlikely No statistical adjustments have been made to raw results. |
|
Waugh, 2017 |
Unlikely |
Unlikely |
Unclear The only outcome measure that can be used is severe pre-eclampsia, which was reported based on NICE diagnosis and clinician diagnosis.
NICE diagnosis severe PE: I: 417 C: 542
Clinician diagnosis severe PE: I: 193 C: 766
|
Unlikely No statistical adjustments have been made to raw results. |
- Failure to develop and apply appropriate eligibility criteria: a) case-control study: under- or over-matching in case-control studies; b) cohort study: selection of exposed and unexposed from different populations.
- 2 Bias is likely if: the percentage of patients lost to follow-up is large; or differs between treatment groups; or the reasons for loss to follow-up differ between treatment groups; or length of follow-up differs between treatment groups or is too short. The risk of bias is unclear if: the number of patients lost to follow-up; or the reasons why, are not reported.
- Flawed measurement, or differences in measurement of outcome in treatment and control group; bias may also result from a lack of blinding of those assessing outcomes (detection or information bias). If a study has hard (objective) outcome measures, like death, blinding of outcome assessment is not necessary. If a study has “soft” (subjective) outcome measures, like the assessment of an X-ray, blinding of outcome assessment is necessary.
- Failure to adequately measure all known prognostic factors and/or failure to adequately adjust for these factors in multivariate statistical analysis.
Table of excluded studies
Subquestion 1 - optimal cut-off value
|
Author and year |
Reason for exclusion |
|
Aggarwal, 2008 |
included in Morris (2012) |
|
Al, 2009 |
Not conform PICO (ACR) |
|
Al, 2004 |
included in Morris (2012) |
|
Baba, 2015 |
Not conform PICO (1 PCR cut-off value versus 24 hours urine) |
|
Bahasadri, 2011 |
Not conform PICO (predictor microalbuminuria adverse outcomes) |
|
Basharat, 2017 |
Not conform PICO (1 PCR cut-off value versus 24 hours urine) |
|
Bhide, 2015 |
Not conform PICO (1 PCR cut-off value versus 24 hours urine) |
|
Cade, 2012 |
Not conform PICO (1 PCR cut-off value versus 24 hours urine) |
|
Cade, 2015 |
Not conform PICO (comparison PCR to ACR) |
|
Chan, 2005 |
Study published within search Morris (2012) |
|
Côté, 2008 |
sys review without usable data (no pooled sens/spec per cut-off value) |
|
Demirci, 2015 |
Not conform PICO (1 PCR cut-off value versus 24 hours urine) |
|
Dogan, 2019 |
No original article (narrative review) |
|
Durnwald, 2003 |
included in Morris (2012) |
|
Dwyer, 2008 |
included in Morris (2012) |
|
Elia, 2017 |
Not conform PICO (ACR) |
|
Eslamian, 2011 |
Not conform PICO (1 PCR cut-off value versus 24 hours urine) |
|
Gangaram, 2009 |
included in Morris (2012) |
|
Gangaram, 2009 |
Not conform PICO (ACR) |
|
Gonsales Valério, 2005 |
Not conform PICO (timing of sample and the effect on diagnostic accuracy) |
|
Haas, 2003 |
Study published within search Morris (2012), does not conform PICO (1 PCR cut-off value versus 24 h) |
|
Hirshberg 2014 |
Not conform PICO (1 PCR cut-off value versus 24 hours urine) |
|
Hossain, 2014 |
Not conform PICO (1 PCR cut-off value versus 24 hours urine) |
|
Jaschevatzky, 1990 |
Study published within search Morris (2012), not conform PICO (comparison group are healthy women) |
|
Kattah 2017 |
Not conform PICO (normotensive women) |
|
Kayatas, 2013 |
Not conform PICO (1 PCR cut-off value versus 24 hours urine) |
|
Kucukgoz Gulec, 2017 |
Not conform PICO (1 PCR cut-off value versus 24 hours urine) |
|
Kyle, 2008 |
Not conform PICO (ACR) |
|
Lamontagne, 2014 |
Not conform PICO (1 PCR cut-off value versus 24 hours urine) |
|
Leanos-Miranda, 2007 |
included in Morris (2012) |
|
Lopes Ramos, 1999 |
included in Morris (2012) |
|
Malin, 2007 |
Not conform PICO (ACR) |
|
Martins-Costa, 2011 |
Not conform PICO (does not study cut-off values of PCR) |
|
Mohseni, 2013 |
Not conform PICO (timing of sample and the effect on diagnostic accuracy) |
|
Moiety, 2014 |
Not conform PICO (ACR) |
|
Morris, 2012b |
No original paper (conference abstract) |
|
Nipanal, 2018 |
Not conform PICO (1 PCR cut-off value versus 24 hours urine) |
|
Nisar, 2017 |
Not conform PICO (1 PCR cut-off value versus 24 hours urine) |
|
Ökzkara, 2018 |
Not conform PICO (1 PCR cut-off value versus 24 hours urine) |
|
Pahwa, 2007 |
Study published within search Morris (2012), not conform PICO (PCR versus 24 hours urine) |
|
Papanna, 2008 |
Review by Morris (2012) is more up to date |
|
Park, 2013 |
Not conform PICO (PCR versus 24 hours urine) |
|
Payne, 2011 |
Not conform PICO (does not study cut-off values of PCR) |
|
Price, 2005 |
Not conform PICO (other patient group) |
|
Risberg, 2004 |
Not conform PICO (ACR) |
|
Rizk, 2007 |
Not conform PICO (PCR versus 24 hours urine) |
|
Robert, 1997 |
included in Morris (2012) |
|
Rodriguez-Thompson, 2001 |
included in Morris (2012) |
|
Roudsari, 2012 |
Not conform PICO (does not study cut-off values of PCR) |
|
Sachan, 2017 |
Not conform PICO (ACR) |
|
Salmon, 2018 |
Not conform PICO (does not study cut-off values of PCR) |
|
Sanchez-Ramos, 2013 |
Review by Morris (2012) is more up to date |
|
Schubert, 2006 |
included in Morris (2012) |
|
Sethuram, 2011 |
Not conform PICO (1 PCR cut-off value versus 24 hours urine) |
|
Shahbazian, 2008 |
included in Morris (2012) |
|
Shennan, 2008 |
Study published within search Morris (2012) |
|
Taherian, 2006 |
included in Morris (2012) |
|
Thangaratinam, 2009 |
Not conform PICO (sys review with different outcome measure (LR), based on reference list 2 additional articles to Morris (2012) were identified and included) |
|
Thangaratinam, 2017 |
Not conform PICO (does not study cut-off values of PCR) |
|
Valdés, 2016 |
Not conform PICO (1 PCR cut-off value versus 24 hours urine) |
|
Valerio, 2007 |
Not conform PICO (ACR) |
|
Verdonk, 2014 |
Not conform PICO (timing of sample and the effect on diagnostic accuracy) |
|
Waugh, 2005 |
included in Morris (2012) |
|
Waugh, 2017 |
Not conform PICO (does not study cut-off values of PCR) |
|
Wheeler, 2007 |
included in Morris (2012) |
|
Wikström, 2006 |
Not conform PICO (ACR) |
|
Yamada 2014 |
Not conform PICO (1 PCR cut-off value versus 24 hours urine) |
|
Yamasmit, 2003 |
Study published within search Morris (2012) |
|
Yamasmit, 2004 |
included in Morris (2012) |
|
Yan, 2016 |
Not conform PICO (does not study cut-off values of PCR) |
|
Young, 1996 |
Study published within search Morris (2012) |
|
Zadehmodarres, 2006 |
Study published within search Morris (2012) |
Subquestion 2 - risk of proteinuria
|
Author and year |
Reason for exclusion |
|
Abebe 2008 |
Not conform PICO (analysis of reliability 2-hour urine versus 12-hour urine versus 24-hour urine) |
|
Allotey 2017 |
Protocol paper |
|
Babu 2015 |
Not conform PICO (microalbumin as predictor of pre-eclampsia comparing hypertensive and normotensive women) |
|
Bae 2017 |
Not conform PICO (women without hypertension) |
|
Bouzari 2014 |
Prognostic model |
|
Buchbinder 2002 |
Not conform PICO (women with pre-eclampsia in previous pregnancy; not corrected for the effect of the intervention consisting of a dosis aspirine) |
|
Chan 2005 |
Prognostic model with composite score |
|
Chung 2018 |
Not conform PICO (comparison of isolated gestational proteinuria (without hypertension) with pre-eclampsia) |
|
Cote 2008 |
Not conform PICO (analysis of reliability 24-hour urine) |
|
Elia 2017 |
Prognostic model with composite score |
|
Erdemoglu 2010 |
Not conform PICO (predictors of development HELLP) |
|
Feroze 2012 |
Not conform PICO (no comparison concerning no proteinuria) |
|
Gaspari 2006 |
No original paper (commentary) |
|
Guida 2014 |
Not conform PICO (no comparison concerning no proteinuria) |
|
Hall 2002 |
Not conform PICO (no comparison concerning no proteinuria) |
|
Hofmeyr 2009 |
No original paper (commentary) |
|
Jim 2014 |
Not conform PICO (predictors of development pre-eclampsia) |
|
Kim 2017 |
Not conform PICO (no comparison concerning no proteinuria) |
|
Kocijancic 2013 |
Narrative review |
|
Lee 2014 |
Prognostic model |
|
Martinez-Fierro 2018 |
Not conform PICO (predictors of development pre-eclampsia) |
|
Morikawa, 2008 |
Not conform PICO (isolated gestational proteinuria (without hypertension) |
|
Morikawa 2009 |
Narrative review |
|
Moslemizadeh 2008 |
Not conform PICO (analysis of reliability 8-hour urine versus 12-hour urine versus 24-hour urine) |
|
Nakanishi 2017 |
Not conform PICO (superimposed pre-eclampsia) |
|
Newman 2003 |
Not conform PICO (no comparison concerning no proteinuria) |
|
Payne 2011 |
Prognostic model with composite score |
|
Payne 2014 |
Prognostic model in low-middle income countries |
|
Payne 2015 |
Prognostic model |
|
Portelli 2018 |
Narrative review |
|
Rabiee 2007 |
Not conform PICO (analysis of reliability 8-hour urine versus 12-hour urine versus 24-hour urine) |
|
Salako 2003 |
Not conform PICO (microalbumin as predictor of pre-eclampsia in normotensive women) |
|
Sarmiento-Piña 2017 |
Language (Spanish) |
|
Schröder 2000 |
Not conform PICO (women with diabetes) |
|
Seong 2010 |
Not applicable to the Dutch health-care system (use of albumin) |
|
Shinar 2016 |
Not conform PICO (isolated gestational proteinuria without hypertension) |
|
Sirohiwal 2009 |
Not conform PICO (normotensive women and the risk at pre-eclampsia) |
|
Silva 2018 |
Not conform PICO (analysis of reliability 12-hour urine versus 24-hour urine) |
|
Tanacan 2019 |
Not conform PICO (no comparison concerning no proteinuria) |
|
Taneja 2006 |
Not conform PICO (analysis of reliability 8-hour urine versus 12-hour urine versus 24-hour urine) |
|
Thangaratinam 2007 |
Delphi procedure (deciding on the best test for proteinuria) |
|
Tochio, 2019 |
Not conform PICO (group women ‘without proteinuria’ not appropriate based on patient characteristics). |
|
Von Dadelszen 2004 |
No original paper (prenotification) |
|
Waugh 2005 |
Not conform PICO (comparison of proteinuria 0.3 gram versus proteinuria 0.5 gram) |
|
Yamamoto 2018 |
Not conform PICO (twin pregnancies and the risk at adverse outcomes) |
|
Zhang 2001 |
Not conform PICO (comparing definitions of hypertension and the associated outcomes) |
|
Zhuang 2015 |
Not conform PICO (no comparison concerning proteinuria versus no proteinuria) |
[1] Comparator test is vergelijkbaar met de C uit de PICO van een interventievraag. Er kunnen ook meerdere tests worden vergeleken. Voeg die toe als comparator test 2 etc. Let op: de comparator test kan nooit de referentiestandaard zijn.
[2] In geval van een case-control design moeten de patiëntkarakteristieken per groep (cases en controls) worden uitgewerkt. NB; case control studies zullen de accuratesse overschatten (Lijmer et al., 1999)
[3] Comparator test is vergelijkbaar met de C uit de PICO van een interventievraag. Er kunnen ook meerdere tests worden vergeleken. Voeg die toe als comparator test 2 etc. Let op: de comparator test kan nooit de referentiestandaard zijn.
[4] De referentiestandaard is de test waarmee definitief wordt aangetoond of iemand al dan niet ziek is. Idealiter is de referentiestandaard de Gouden standaard (100% sensitief en 100% specifiek). Let op! dit is niet de “comparison test/index 2”.
4 Beschrijf de statistische parameters voor de vergelijking van de indextest(en) met de referentietest, en voor de vergelijking tussen de indextesten onderling (als er twee of meer indextesten worden vergeleken).
[5] In geval van een case-control design moeten de patiëntkarakteristieken per groep (cases en controls) worden uitgewerkt. NB; case control studies zullen de accuratesse overschatten (Lijmer et al., 1999)
[6] Comparator test is vergelijkbaar met de C uit de PICO van een interventievraag. Er kunnen ook meerdere tests worden vergeleken. Voeg die toe als comparator test 2 etc. Let op: de comparator test kan nooit de referentiestandaard zijn.
[7] De referentiestandaard is de test waarmee definitief wordt aangetoond of iemand al dan niet ziek is. Idealiter is de referentiestandaard de Gouden standaard (100% sensitief en 100% specifiek). Let op! dit is niet de “comparison test/index 2”.
4 Beschrijf de statistische parameters voor de vergelijking van de indextest(en) met de referentietest, en voor de vergelijking tussen de indextesten onderling (als er twee of meer indextesten worden vergeleken).
[8] In geval van een case-control design moeten de patiëntkarakteristieken per groep (cases en controls) worden uitgewerkt. NB; case control studies zullen de accuratesse overschatten (Lijmer et al., 1999)
[9] Comparator test is vergelijkbaar met de C uit de PICO van een interventievraag. Er kunnen ook meerdere tests worden vergeleken. Voeg die toe als comparator test 2 etc. Let op: de comparator test kan nooit de referentiestandaard zijn.
[10] De referentiestandaard is de test waarmee definitief wordt aangetoond of iemand al dan niet ziek is. Idealiter is de referentiestandaard de Gouden standaard (100% sensitief en 100% specifiek). Let op! dit is niet de “comparison test/index 2”.
4 Beschrijf de statistische parameters voor de vergelijking van de indextest(en) met de referentietest, en voor de vergelijking tussen de indextesten onderling (als er twee of meer indextesten worden vergeleken).
Beoordelingsdatum en geldigheid
Publicatiedatum : 14-06-2021
Beoordeeld op geldigheid : 22-07-2021
|
Module[1] |
Regiehouder(s)[2] |
Jaar van autorisatie |
Eerstvolgende beoordeling actualiteit richtlijn[3] |
Frequentie van beoordeling op actualiteit[4] |
Wie houdt er toezicht op actualiteit[5] |
Relevante factoren voor wijzigingen in aanbeveling[6] |
|
Proteinurie en EKR |
NVOG |
2020 |
2025 |
Elke 5 jaar |
NVOG |
Nieuwe literatuur |
[1] Naam van de module
[2] Regiehouder van de module (deze kan verschillen per module en kan ook verdeeld zijn over meerdere regiehouders)
[3] Maximaal na vijf jaar
[4] (half)Jaarlijks, eens in twee jaar, eens in vijf jaar
[5] regievoerende vereniging, gedeelde regievoerende verenigingen, of (multidisciplinaire) werkgroep die in stand blijft
[6] Lopend onderzoek, wijzigingen in vergoeding/organisatie, beschikbaarheid nieuwe middelen
Algemene gegevens
De ontwikkeling/herziening van deze richtlijnmodule werd ondersteund door het Kennisinstituut van de Federatie Medisch Specialisten en werd gefinancierd uit de Stichting Kwaliteitsgelden Medisch Specialisten (SKMS). De financier heeft geen enkele invloed gehad op de inhoud van de richtlijnmodule.
Deze richtlijn is ontwikkeld in samenwerking met:
- Patiëntenfederatie Nederland
Doel en doelgroep
Doel
Deze richtlijn beoogt een leidraad te geven voor de dagelijkse praktijk van de zorg van zwangere vrouwen met een hypertensieve aandoening. De richtlijn bespreekt niet de indicaties voor het beëindigen van de zwangerschap op maternale indicatie, maar beperkt zich bij de behandeling tot de medicamenteuze behandeling.
Doelgroep
Deze richtlijn is geschreven voor alle leden van de beroepsgroepen die aan de ontwikkeling van de richtlijn hebben bijgedragen. Deze staan vermeld bij de samenstelling van de werkgroep. Tot de beroepsgroepen die geen zitting hadden in de werkgroep, maar wel beoogd gebruikers zijn van deze richtlijn behoren o.a. klinisch verloskundigen.
Samenstelling werkgroep
Voor het ontwikkelen van de richtlijnmodule is in 2019 een werkgroep ingesteld, bestaande uit vertegenwoordigers van alle relevante specialismen die betrokken zijn bij de zorg voor vrouwen met hypertensieve aandoeningen in de zwangerschap.
Werkgroep
- Dr. C.J. (Caroline) Bax, gynaecoloog-perinatoloog, werkzaam in het Amsterdam UMC locatie AMC, NVOG, voorzitter stuurgroep.
- Dr. S.V. (Steven) Koenen, gynaecoloog, werkzaam in het ETZ, locatie Elisabeth Ziekenhuis, NVOG, lid stuurgroep.
- Dr. Duvekot, gynaecoloog, werkzaam in het Erasmus MC, NVOG, lid stuurgroep.
- Dr. M.A. (Marjon) de Boer, gynaecoloog-perinatoloog, werkzaam in het Amsterdam UMC, locatie VUmc, NVOG.
- Dr. A.T. (Titia) Lely, gynaecoloog, werkzaam in het UMC Utrecht, NVOG.
- Dr. P.J. (Petra) Hajenius, gynaecoloog-perinatoloog, werkzaam in het Amsterdam UMC locatie AMC, NVOG.
- Dr. J.W.(Wessel) Ganzevoort, gynaecoloog-perinatoloog, werkzaam in het Amsterdam UMC locatie AMC, NVOG.
- Dr. O.W.H. (Olivier) van der Heijden, gynaecoloog-perinatoloog, werkzaam in het Radboud UMC Nijmegen, NVOG.
- MSc F.M. (Fenna) van der Molen, verloskundige, werkzaam in praktijk Veilige Geboorte, KNOV.
- Dr. M.C. (Mignon) van der Horst, klinisch verloskundige, werkzaam in de Gelderse Vallei Ede, KNOV.
- Mw. A.M.M. (Annemijn) Doppenberg, MSc, adviseur, Patiëntenfederatie Nederland.
- Mw. J.C. (Anne) Mooij, MSc, adviseur, Patiëntenfederatie Nederland.
- Mw. K.L.H.E. (Kim) VandenAuweele, beleidsmedewerker HELLP Stichting.
Meelezers
- Leden van de Otterlo - werkgroep (2020)
Met ondersteuning van
- Dr. A. (Anne) Bijlsma-Rutte, adviseur, Kennisinstituut van de Federatie Medisch Specialisten
- Dr. L. (Laura) Viester, adviseur, Kennisinstituut van de Federatie Medisch Specialisten
- Dr. M.A.C. (Marleen) van Son, adviseur, Kennisinstituut van de Federatie Medisch Specialisten
- MSc Y. (Yvonne) Labeur, junior adviseur, Kennisinstituut van de Federatie Medisch Specialisten.
Belangenverklaringen
De Code ter voorkoming van oneigenlijke beïnvloeding door belangenverstrengeling is gevolgd. Alle werkgroepleden hebben schriftelijk verklaard of zij in de laatste drie jaar directe financiële belangen (betrekking bij een commercieel bedrijf, persoonlijke financiële belangen, onderzoeksfinanciering) of indirecte belangen (persoonlijke relaties, reputatiemanagement) hebben gehad. Gedurende de ontwikkeling of herziening van een module worden wijzigingen in belangen aan de voorzitter doorgegeven. De belangenverklaring wordt opnieuw bevestigd tijdens de commentaarfase.
Een overzicht van de belangen van werkgroepleden en het oordeel over het omgaan met eventuele belangen vindt u in onderstaande tabel. De ondertekende belangenverklaringen zijn op te vragen bij het secretariaat van het Kennisinstituut van de Federatie Medisch Specialisten.
|
Werkgroeplid |
Functie |
Nevenfuncties |
Gemelde belangen |
Ondernomen actie |
|
Bax (voorzitter stuurgroep) |
Gynaecoloog-perinatoloog Amsterdam UMC, locatie AMC, 0,8 fte |
Gastvrouw Hospice Xenia Leiden (onbetaald) |
|
geen |
|
Duvekot (lid stuurgroep) |
Gynaecoloog, Erasmus MC (full time) |
Directeur 'medisch advies en expertise bureau Duvekot', Ridderkerk, ZZP'er |
|
geen |
|
Koenen (lid stuurgroep) |
gynaecoloog, ETZ , Tilburg |
incidenteel juridische expertise (betaald) |
|
geen |
|
de Boer |
gynaecoloog-perinatoloog AUMC, locatie Vumc |
geen |
|
geen |
|
Hajenius |
Gynaecoloog (1.0 fte), afdeling Obstetrie Amsterdam Universitair Medische Centra (AUMC), locatie Meibergdreef (AMC). |
geen nevenwerkzaamheden |
De module Geboortezorg - Hypertensieve aandoeningen zal in de praktijk worden vertaald naar een lokaal protocol voor de afdeling Obstetrie van het AUMC waar ik werkzaam ben en de lokale protocollen beheer. In die zin zullen naaste collega's (artsen, klinisch verloskundigen en arts assistenten) "baat" hebben bij de uitkomsten van de module. |
geen |
|
Lely |
Gynaecoloog WKZ |
off-road commissie lid ZonMw (onkostenvergoeding, onbetaald) |
|
geen |
|
Van der Heijden |
Gynaecoloog, perinatoloog |
Lid multidisciplinaire richtlijn commissie (NVOG): |
|
geen |
|
Ganzevoort |
Gynaecoloog , Amsterdam UMC |
Redacteur NTOG, onbetaald |
Ik ben PI van enkele ZonMW gefinancierde studies bij foetale groeirestrictie en centrum-contactpersoon voor enkele andere pre-eclampsie studies. Binnen die studies wordt ook door Roche Diagnostics materiaal in-kind ter beschikking gesteld. Er zijn door het bedrijf hieraan geen inhoudelijke voorwaarden gesteld, op geen enkel vlak. |
geen actie, de richtlijnmodules doen geen uitspraak over welke testapparatuur/-methode gehanteerd moet worden voor het bepalen van proteïnurie, alleen dat men dit middels het eiwit-kreatinine ratio doet. |
|
van der Horst |
Klinisch verloskundige, ziekenhuis Gelderse Vallei, Ede |
PKV, KNOV vacatievergoeding |
|
geen |
|
van der Molen |
eerstelijns verloskundige, KNOV |
Ledenraad Eerstelijns Verloskundigen Amsterdam Amstelland (EVAA) - afwisselend voorzitter, notulist en algemeen lid - onbetaald Commissie Kwaliteit en onderzoek EVAA - afwisselend voorzitter, notulist en algemeen lid - onbetaald |
|
geen |
|
van Son |
Beleidsmedewerker KNOV |
Niet van toepassing |
|
geen |
|
Van den Auweele |
Beleidsmedewerker Hellp Stichting |
|
|
geen |
|
Ensink |
Medior adviseur patiëntbelang Patiëntenfederatie |
Niet van toepassing |
|
geen |
|
Mooij |
adviseur Patientenbelang, Patientenfederatie Nederland |
Niet van toepassing |
|
geen |
|
Doppenberg |
adviseur Patientenbelang, Patientenfederatie Nederland |
Niet van toepassing |
|
geen |
Inbreng patiëntenperspectief
Er werd aandacht besteed aan het patiëntenperspectief door uitnodigen van patiëntvertegenwoordigers van verschillende patiëntverenigingen voor de Invitational conference en afvaardigen van patiëntenverenigingen in de clusterwerkgroep. Het verslag hiervan is besproken in de werkgroep. De verkregen input is meegenomen bij het opstellen van de uitgangsvragen, de keuze voor de uitkomstmaten en bij het opstellen van de overwegingen (zie per module ook ‘Waarden en voorkeuren van patiënten (en eventueel hun verzorgers)’. De conceptrichtlijn wordt tevens ter commentaar voorgelegd aan de betrokken patiëntenverenigingen.
Methode ontwikkeling
Evidence based
Werkwijze
AGREE
Deze richtlijnmodule is opgesteld conform de eisen vermeld in het rapport Medisch Specialistische Richtlijnen 2.0 van de adviescommissie Richtlijnen van de Raad Kwaliteit. Dit rapport is gebaseerd op het AGREE II instrument (Appraisal of Guidelines for Research & Evaluation II; Brouwers, 2010).
Knelpuntenanalyse en uitgangsvragen
Tijdens de voorbereidende fase inventariseerden de werkgroep de knelpunten in de zorg voor vrouwen met hypertensieve aandoeningen in de zwangerschap. Tevens zijn er knelpunten aangedragen door patiëntenverenigingen tijdens de Invitational conference. Een verslag hiervan is opgenomen in de bijlagen.
Op basis van de uitkomsten van de knelpuntenanalyse zijn door de werkgroep concept-uitgangsvragen opgesteld en definitief vastgesteld.
Uitkomstmaten
Na het opstellen van de zoekvraag behorende bij de uitgangsvraag inventariseerde de werkgroep welke uitkomstmaten voor de patiënt relevant zijn, waarbij zowel naar gewenste als ongewenste effecten werd gekeken. Hierbij werd een maximum van acht uitkomstmaten gehanteerd. De werkgroep waardeerde deze uitkomstmaten volgens hun relatieve belang bij de besluitvorming rondom aanbevelingen, als cruciaal (kritiek voor de besluitvorming), belangrijk (maar niet cruciaal) en onbelangrijk. Tevens definieerde de werkgroep tenminste voor de cruciale uitkomstmaten welke verschillen zij klinisch (patiënt) relevant vonden.
Methode literatuursamenvatting
Een uitgebreide beschrijving van de strategie voor zoeken en selecteren van literatuur en de beoordeling van de risk-of-bias van de individuele studies is te vinden onder ‘Zoeken en selecteren’ onder Onderbouwing. De beoordeling van de kracht van het wetenschappelijke bewijs wordt hieronder toegelicht.
Beoordelen van de kracht van het wetenschappelijke bewijs
De kracht van het wetenschappelijke bewijs werd bepaald volgens de GRADE-methode. GRADE staat voor ‘Grading Recommendations Assessment, Development and Evaluation’ (zie http://www.gradeworkinggroup.org/). De basisprincipes van de GRADE-methodiek zijn: het benoemen en prioriteren van de klinisch (patiënt) relevante uitkomstmaten, een systematische review per uitkomstmaat, en een beoordeling van de bewijskracht per uitkomstmaat op basis van de acht GRADE-domeinen (domeinen voor downgraden: risk of bias, inconsistentie, indirectheid, imprecisie, en publicatiebias; domeinen voor upgraden: dosis-effect relatie, groot effect, en residuele plausibele confounding).
GRADE onderscheidt vier gradaties voor de kwaliteit van het wetenschappelijk bewijs: hoog, redelijk, laag en zeer laag. Deze gradaties verwijzen naar de mate van zekerheid die er bestaat over de literatuurconclusie, in het bijzonder de mate van zekerheid dat de literatuurconclusie de aanbeveling adequaat ondersteunt (Schünemann, 2013; Hultcrantz, 2017).
|
GRADE |
Definitie |
|
Hoog |
|
|
Redelijk |
|
|
Laag |
|
|
Zeer laag |
|
Bij het beoordelen (graderen) van de kracht van het wetenschappelijk bewijs in richtlijnen volgens de GRADE-methodiek spelen grenzen voor klinische besluitvorming een belangrijke rol (Hultcrantz, 2017). Dit zijn de grenzen die bij overschrijding aanleiding zouden geven tot een aanpassing van de aanbeveling. Om de grenzen voor klinische besluitvorming te bepalen moeten alle relevante uitkomstmaten en overwegingen worden meegewogen. De grenzen voor klinische besluitvorming zijn daarmee niet één op één vergelijkbaar met het minimaal klinisch relevant verschil (Minimal Clinically Important Difference, MCID). Met name in situaties waarin een interventie geen belangrijke nadelen heeft en de kosten relatief laag zijn, kan de grens voor klinische besluitvorming met betrekking tot de effectiviteit van de interventie bij een lagere waarde (dichter bij het nuleffect) liggen dan de MCID (Hultcrantz, 2017).
Overwegingen (van bewijs naar aanbeveling)
Om te komen tot een aanbeveling zijn naast (de kwaliteit van) het wetenschappelijke bewijs ook andere aspecten belangrijk en worden meegewogen, zoals aanvullende argumenten uit bijvoorbeeld de biomechanica of fysiologie, waarden en voorkeuren van patiënten, kosten (middelenbeslag), aanvaardbaarheid, haalbaarheid en implementatie. Deze aspecten zijn systematisch vermeld en beoordeeld (gewogen) onder het kopje ‘Overwegingen’ en kunnen (mede) gebaseerd zijn op expert opinion. Hierbij is gebruik gemaakt van een gestructureerd format gebaseerd op het evidence-to-decision framework van de internationale GRADE Working Group (Alonso-Coello, 2016a; Alonso-Coello, 2016b). Dit evidence-to-decision framework is een integraal onderdeel van de GRADE-methodiek.
Formuleren van aanbevelingen
De aanbevelingen geven antwoord op de uitgangsvraag en zijn gebaseerd op het beschikbare wetenschappelijke bewijs en de belangrijkste overwegingen, en een weging van de gunstige en ongunstige effecten van de relevante interventies. De kracht van het wetenschappelijk bewijs en het gewicht dat door de werkgroep wordt toegekend aan de overwegingen, bepalen samen de sterkte van de aanbeveling. Conform de GRADE-methodiek sluit een lage bewijskracht van conclusies in de systematische literatuuranalyse een sterke aanbeveling niet a priori uit, en zijn bij een hoge bewijskracht ook zwakke aanbevelingen mogelijk (Agoritsas, 2017; Neumann, 2016). De sterkte van de aanbeveling wordt altijd bepaald door weging van alle relevante argumenten tezamen. De werkgroep heeft bij elke aanbeveling opgenomen hoe zij tot de richting en sterkte van de aanbeveling zijn gekomen.
In de GRADE-methodiek wordt onderscheid gemaakt tussen sterke en zwakke (of conditionele) aanbevelingen. De sterkte van een aanbeveling verwijst naar de mate van zekerheid dat de voordelen van de interventie opwegen tegen de nadelen (of vice versa), gezien over het hele spectrum van patiënten waarvoor de aanbeveling is bedoeld. De sterkte van een aanbeveling heeft duidelijke implicaties voor patiënten, behandelaars en beleidsmakers (zie onderstaande tabel). Een aanbeveling is geen dictaat, zelfs een sterke aanbeveling gebaseerd op bewijs van hoge kwaliteit (GRADE-gradering HOOG) zal niet altijd van toepassing zijn, onder alle mogelijke omstandigheden en voor elke individuele patiënt.
|
Implicaties van sterke en zwakke aanbevelingen voor verschillende richtlijngebruikers |
||
|
|
Sterke aanbeveling |
Zwakke (conditionele) aanbeveling |
|
Voor patiënten |
De meeste patiënten zouden de aanbevolen interventie of aanpak kiezen en slechts een klein aantal niet. |
Een aanzienlijk deel van de patiënten zouden de aanbevolen interventie of aanpak kiezen, maar veel patiënten ook niet. |
|
Voor behandelaars |
De meeste patiënten zouden de aanbevolen interventie of aanpak moeten ontvangen. |
Er zijn meerdere geschikte interventies of aanpakken. De patiënt moet worden ondersteund bij de keuze voor de interventie of aanpak die het beste aansluit bij zijn of haar waarden en voorkeuren. |
|
Voor beleidsmakers |
De aanbevolen interventie of aanpak kan worden gezien als standaardbeleid. |
Beleidsbepaling vereist uitvoerige discussie met betrokkenheid van veel stakeholders. Er is een grotere kans op lokale beleidsverschillen. |
Organisatie van zorg
In de knelpuntenanalyse en bij de ontwikkeling van de richtlijnmodule is expliciet aandacht geweest voor de organisatie van zorg: alle aspecten die randvoorwaardelijk zijn voor het verlenen van zorg (zoals coördinatie, communicatie, (financiële) middelen, mankracht en infrastructuur). Randvoorwaarden die relevant zijn voor het beantwoorden van deze specifieke uitgangsvraag zijn genoemd bij de overwegingen. Meer algemene, overkoepelende, of bijkomende aspecten van de organisatie van zorg worden behandeld in de module Organisatie van zorg.
Commentaar- en autorisatiefase
De conceptrichtlijnmodule wordt aan de betrokken (wetenschappelijke) verenigingen en (patiënt) organisaties voorgelegd ter commentaar. De commentaren worden verzameld en besproken met de werkgroep. Naar aanleiding van de commentaren wordt de conceptrichtlijnmodule aangepast en definitief vastgesteld door de werkgroep. De definitieve richtlijnmodule wordt aan de deelnemende (wetenschappelijke) verenigingen en (patiënt) organisaties voorgelegd voor autorisatie en door hen geautoriseerd dan wel geaccordeerd.
Literatuur
Agoritsas T, Merglen A, Heen AF, Kristiansen A, Neumann I, Brito JP, Brignardello-Petersen R, Alexander PE, Rind DM, Vandvik PO, Guyatt GH. UpToDate adherence to GRADE criteria for strong recommendations: an analytical survey. BMJ Open. 2017 Nov 16;7(11):e018593. doi: 10.1136/bmjopen-2017-018593. PubMed PMID: 29150475; PubMed Central PMCID: PMC5701989.
Alonso-Coello P, Schünemann HJ, Moberg J, Brignardello-Petersen R, Akl EA, Davoli M, Treweek S, Mustafa RA, Rada G, Rosenbaum S, Morelli A, Guyatt GH, Oxman AD; GRADE Working Group. GRADE Evidence to Decision (EtD) frameworks: a systematic and transparent approach to making well informed healthcare choices. 1: Introduction. BMJ. 2016 Jun 28;353:i2016. doi: 10.1136/bmj.i2016. PubMed PMID: 27353417.
Alonso-Coello P, Oxman AD, Moberg J, Brignardello-Petersen R, Akl EA, Davoli M, Treweek S, Mustafa RA, Vandvik PO, Meerpohl J, Guyatt GH, Schünemann HJ; GRADE Working Group. GRADE Evidence to Decision (EtD) frameworks: a systematic and transparent approach to making well informed healthcare choices. 2: Clinical practice guidelines. BMJ. 2016 Jun 30;353:i2089. doi: 10.1136/bmj.i2089. PubMed PMID: 27365494.
Brouwers MC, Kho ME, Browman GP, Burgers JS, Cluzeau F, Feder G, Fervers B, Graham ID, Grimshaw J, Hanna SE, Littlejohns P, Makarski J, Zitzelsberger L; AGREE Next Steps Consortium. AGREE II: advancing guideline development, reporting and evaluation in health care. CMAJ. 2010 Dec 14;182(18):E839-42. doi: 10.1503/cmaj.090449. Epub 2010 Jul 5. Review. PubMed PMID: 20603348; PubMed Central PMCID: PMC3001530.
Hultcrantz M, Rind D, Akl EA, Treweek S, Mustafa RA, Iorio A, Alper BS, Meerpohl JJ, Murad MH, Ansari MT, Katikireddi SV, Östlund P, Tranæus S, Christensen R, Gartlehner G, Brozek J, Izcovich A, Schünemann H, Guyatt G. The GRADE Working Group clarifies the construct of certainty of evidence. J Clin Epidemiol. 2017 Jul;87:4-13. doi: 10.1016/j.jclinepi.2017.05.006. Epub 2017 May 18. PubMed PMID: 28529184; PubMed Central PMCID: PMC6542664.
Medisch Specialistische Richtlijnen 2.0 (2012). Adviescommissie Richtlijnen van de Raad Kwalitieit. https://richtlijnendatabase.nl/over_deze_site/richtlijnontwikkeling.html.
Neumann I, Santesso N, Akl EA, Rind DM, Vandvik PO, Alonso-Coello P, Agoritsas T, Mustafa RA, Alexander PE, Schünemann H, Guyatt GH. A guide for health professionals to interpret and use recommendations in guidelines developed with the GRADE approach. J Clin Epidemiol. 2016 Apr;72:45-55. doi: 10.1016/j.jclinepi.2015.11.017. Epub 2016 Jan 6. Review. PubMed PMID: 26772609.
Schünemann H, Brożek J, Guyatt G, et al. GRADE handbook for grading quality of evidence and strength of recommendations. Updated October 2013. The GRADE Working Group, 2013. Available from http://gdt.guidelinedevelopment.org/central_prod/_design/client/handbook/handbook.html.
Schünemann HJ, Oxman AD, Brozek J, Glasziou P, Jaeschke R, Vist GE, Williams JW Jr, Kunz R, Craig J, Montori VM, Bossuyt P, Guyatt GH; GRADE Working Group. Grading quality of evidence and strength of recommendations for diagnostic tests and strategies. BMJ. 2008 May 17;336(7653):1106-10. doi: 10.1136/bmj.39500.677199.AE. Erratum in: BMJ. 2008 May 24;336(7654). doi: 10.1136/bmj.a139.
Schünemann, A Holger J (corrected to Schünemann, Holger J). PubMed PMID: 18483053; PubMed Central PMCID: PMC2386626.
Wessels M, Hielkema L, van der Weijden T. How to identify existing literature on patients' knowledge, views, and values: the development of a validated search filter. J Med Libr Assoc. 2016 Oct;104(4):320-324. PubMed PMID: 27822157; PubMed Central PMCID: PMC5079497.
Zoekverantwoording
Subquestion 1 - optimal cut-off value PCR
|
Clinical question: What is the optimal cut-off value for the protein-creatine ratio (PCR)? |
|
|
Database(s): Medline, Embase |
Date: 09-10-2019 |
|
Publication date range: 1980-Oktober 2019 |
Languages: English |
|
Database |
Zoektermen |
Totaal |
|
Medline (OVID) 1980 – okt 2019
|
1 exp Pre-Eclampsia/ or exp Hypertension, Pregnancy-Induced/ or exp HELLP Syndrome/ or eclamp*.ti,ab,kw. or preeclamp*.ti,ab,kw. or 'pre-eclamp*'.ti,ab,kw. or preclamp*.ti,ab,kw. or (hypertens* adj4 (pregnan* or gestational or maternal)).ti,ab,kw. or help.ti,ab,kw. (534210) 2 exp Proteinuria/ or proteinuria.ti,ab,kw. or (protein* adj3 (urine or urinary)).ti,ab,kw. (68686) 3 (((protein or albumin or microalbumin) adj3 creatinine) or pcr or acr or (spot adj2 (urine or urinary))).ti,ab,kw. (501394) 4 1 and 2 and 3 (408) 5 limit 4 to (english language and yr="1980 -Current") (388) 6 (meta-analysis/ or meta-analysis as topic/ or (meta adj analy$).tw. or ((systematic* or literature) adj2 review$1).tw. or (systematic adj overview$1).tw. or exp "Review Literature as Topic"/ or cochrane.ab. or cochrane.jw. or embase.ab. or medline.ab. or (psychlit or psyclit).ab. or (cinahl or cinhal).ab. or cancerlit.ab. or ((selection criteria or data extraction).ab. and "review"/)) not (Comment/ or Editorial/ or Letter/ or (animals/ not humans/)) (414325) 7 (exp clinical trial/ or randomized controlled trial/ or exp clinical trials as topic/ or randomized controlled trials as topic/ or Random Allocation/ or Double-Blind Method/ or Single-Blind Method/ or (clinical trial, phase i or clinical trial, phase ii or clinical trial, phase iii or clinical trial, phase iv or controlled clinical trial or randomized controlled trial or multicenter study or clinical trial).pt. or random*.ti,ab. or (clinic* adj trial*).tw. or ((singl* or doubl* or treb* or tripl*) adj (blind$3 or mask$3)).tw. or Placebos/ or placebo*.tw.) not (animals/ not humans/) (1903269) 8 Epidemiologic studies/ or case control studies/ or exp cohort studies/ or Controlled Before-After Studies/ or Case control.tw. or (cohort adj (study or studies)).tw. or Cohort analy$.tw. or (Follow up adj (study or studies)).tw. or (observational adj (study or studies)).tw. or Longitudinal.tw. or Retrospective*.tw. or prospective*.tw. or consecutive*.tw. or Cross sectional.tw. or Cross-sectional studies/ or historically controlled study/ or interrupted time series analysis/ (Onder exp cohort studies vallen ook longitudinale, prospectieve en retrospectieve studies) (3276071) 9 5 and 6 (8) 10 (5 and 7) not 9 (85) 11 (5 and 8) not (9 or 10) (144) 12 9 or 10 or 11 (237) = 237 (97 uniek) |
329 |
|
Embase 1980 – okt 2019
|
'eclampsia and preeclampsia'/exp OR 'maternal hypertension'/exp OR 'hellp syndrome'/exp OR eclamp*:ti,ab OR preeclamp*:ti,ab OR 'pre-eclamp*':ti,ab OR preclamp*:ti,ab OR ((hypertens* NEAR/4 (pregnan* OR gestational OR maternal)):ti,ab) OR hellp:ti,ab AND 'proteinuria'/exp OR proteinuria:ti,ab OR ((protein* NEAR/3 (urine OR urinary)):ti,ab) AND 'protein creatinine ratio'/exp OR (((protein OR albumin OR microalbumin) NEAR/3 creatinine):ti,ab) OR pcr:ti,ab OR acr:ti,ab OR ((spot NEAR/2 (urine OR urinary)):ti,ab) AND (english)/lim AND (1980-2019)/py NOT 'conference abstract':it
Gebruikte filters: Sytematische reviews ('meta analysis'/de OR cochrane:ab OR embase:ab OR psycinfo:ab OR cinahl:ab OR medline:ab OR ((systematic NEAR/1 (review OR overview)):ab,ti) OR ((meta NEAR/1 analy*):ab,ti) OR metaanalys*:ab,ti OR 'data extraction':ab OR cochrane:jt OR 'systematic review'/de) NOT (('animal experiment'/exp OR 'animal model'/exp OR 'nonhuman'/exp) NOT 'human'/exp)
RCT’s ('clinical trial'/exp OR 'randomization'/exp OR 'single blind procedure'/exp OR 'double blind procedure'/exp OR 'crossover procedure'/exp OR 'placebo'/exp OR 'prospective study'/exp OR rct:ab,ti OR random*:ab,ti OR 'single blind':ab,ti OR 'randomised controlled trial':ab,ti OR 'randomized controlled trial'/exp OR placebo*:ab,ti) NOT 'conference abstract':it
Observationeel onderzoek 'major clinical study'/de OR 'clinical study'/de OR 'case control study'/de OR 'family study'/de OR 'longitudinal study'/de OR 'retrospective study'/de OR 'prospective study'/de OR 'cohort analysis'/de OR ((cohort NEAR/1 (study OR studies)):ab,ti) OR (('case control' NEAR/1 (study OR studies)):ab,ti) OR (('follow up' NEAR/1 (study OR studies)):ab,ti) OR (observational NEAR/1 (study OR studies)) OR ((epidemiologic NEAR/1 (study OR studies)):ab,ti) OR (('cross sectional' NEAR/1 (study OR studies)):ab,ti)
= 236 (232 uniek) |
Subquestion 2 - risk of proteinuria
|
Clinical question 1b: What is the risk of proteinuria in women with gestational hypertension without preexistent proteinuria regarding severe neonatal and maternal morbidity? |
|
|
Database(s): Medline, Embase |
Date: 14-10-2019 |
|
Publication date range: 1999-Oktober 2019 |
Languages: English |
|
Database |
Search terms |
Total hits |
|
Medline (OVID) 1999 – Okt 2019
|
1 exp Pregnancy Outcome/ or exp Pregnancy Complications/ or ((maternal or perinatal or neonatal or newborn or pregnancy) adj2 (morbidity or outcome* or complication*)).ti,ab,kw. or exp Renal Insufficiency/ or ((kidney* or renal) adj3 (failure or insufficiency)).ti,ab,kw. or exp Pulmonary Edema/ or ((lung or pulmonary) adj3 (edema or oedema)).ti,ab,kw. or ((liver or hepatic) adj3 (bleeding* or hemorrhage or haemorrhage)).ti,ab,kw. or exp Cerebral Hemorrhage/ or ((brain or cerebral) adj3 (bleeding* or hemorrhage or haemorrhage)).ti,ab,kw. or exp Abruptio Placentae/ or ((ablatio* or abruptio* or detachment or solutio* or separation) adj3 placenta*).ti,ab,kw. or exp Fetal Death/ or ((fetus or fetal or foetus or foetal or intrauterine or antepartum or prenatal or endouterine) adj3 (abort* or death or dead)).ti,ab,kw. or exp Intensive Care Units, Neonatal/ or nicu*.ti,ab,kw. or ((newborn or neonatal or 'neo natal') adj2 ('intensive care unit*' or 'intensive care department' or icu*)).ti,ab,kw. or exp Infant, Very Low Birth Weight/ or exp Infant, Low Birth Weight/ or ((lbw or underweight) adj3 (infant* or neonat* or newborn*)).ti,ab,kw. or 'low birthweight'.ti,ab,kw. or 'low birth weight'.ti,ab,kw. or exp Infant, Premature, Diseases/ or exp Premature Birth/ or exp Infant, Premature/ or (('pre matur*' or preterm or 'pre term') adj3 (infant* or neonate* or baby or babies or child or children or newborn* or childbirth or birth or syndrome)).ti,ab,kw. or 'premature'.ti,ab,kw. or 'prematuritas'.ti,ab,kw. or 'prematurity'.ti,ab,kw. (922025) 2 exp *Proteinuria/ or proteinuria.ti,ab,kw. or (protein* adj3 (urine or urinary)).ti,ab,kw. (56694) 3 exp Pre-Eclampsia/ or exp Hypertension, Pregnancy-Induced/ or exp HELLP Syndrome/ or eclamp*.ti,ab,kw. or preeclamp*.ti,ab,kw. or 'pre-eclamp*'.ti,ab,kw. or preclamp*.ti,ab,kw. or (hypertens* adj4 (pregnan* or gestational or maternal)).ti,ab,kw. or hellp.ti,ab,kw. (54710) 4 1 and 2 and 3 (3007) 5 limit 4 to (english language and yr="1999 -Current") (2472) 6 (meta-analysis/ or meta-analysis as topic/ or (meta adj analy$).tw. or ((systematic* or literature) adj2 review$1).tw. or (systematic adj overview$1).tw. or exp "Review Literature as Topic"/ or cochrane.ab. or cochrane.jw. or embase.ab. or medline.ab. or (psychlit or psyclit).ab. or (cinahl or cinhal).ab. or cancerlit.ab. or ((selection criteria or data extraction).ab. and "review"/)) not (Comment/ or Editorial/ or Letter/ or (animals/ not humans/)) (415277) 7 Epidemiologic studies/ or case control studies/ or exp cohort studies/ or Controlled Before-After Studies/ or Case control.tw. or (cohort adj (study or studies)).tw. or Cohort analy$.tw. or (Follow up adj (study or studies)).tw. or (observational adj (study or studies)).tw. or Longitudinal.tw. or Retrospective*.tw. or prospective*.tw. or consecutive*.tw. or Cross sectional.tw. or Cross-sectional studies/ or historically controlled study/ or interrupted time series analysis/ (Onder exp cohort studies vallen ook longitudinale, prospectieve en retrospectieve studies) (3280961) 8 5 and 6 (93) 9 (5 and 7) not 8 (911) 10 8 or 9 (1004) = 471 |
After removing duplicates combined with clinical question 1a à 843 |
|
Embase 1999 – Okt 2019
|
'eclampsia and preeclampsia'/exp/mj OR 'maternal hypertension'/exp/mj OR 'hellp syndrome'/exp OR eclamp*:ti,ab OR preeclamp*:ti,ab OR 'pre-eclamp*':ti,ab OR preclamp*:ti,ab OR ((hypertens* NEAR/4 (pregnan* OR gestational OR maternal)):ti,ab) OR hellp:ti,ab AND 'proteinuria'/exp/mj OR proteinuria:ti,ab OR ((protein* NEAR/3 (urine OR urinary)):ti,ab) AND 'parameters concerning the fetus, newborn and pregnancy'/exp/mj OR 'maternal morbidity'/exp/mj OR 'perinatal morbidity'/exp/mj OR 'pregnancy complication'/exp/mj OR (((maternal OR perinatal OR neonatal OR newborn OR pregnancy) NEAR/2 (morbidity OR outcome* OR complication*)):ti,ab) OR 'kidney failure'/exp/mj OR (((kidney* OR renal) NEAR/3 (failure OR insufficiency)):ti,ab) OR 'lung edema'/exp/mj OR (((lung OR pulmonary) NEAR/3 (edema OR oedema)):ti,ab) OR 'liver hemorrhage'/exp/mj OR (((liver OR hepatic) NEAR/3 (bleeding* OR hemorrhage OR haemorrhage)):ti,ab) OR 'brain hemorrhage'/exp/mj OR (((brain OR cerebral) NEAR/3 (bleeding* OR hemorrhage OR haemorrhage)):ti,ab) OR 'solutio placentae'/exp/mj OR (((ablatio* OR abruptio* OR detachment OR solutio* OR separation) NEAR/3 placenta*):ti,ab) OR 'fetus death'/exp/mj OR (((fetus OR fetal OR foetus OR foetal OR intrauterine OR antepartum OR prenatal OR endouterine) NEAR/3 (abort* OR death OR dead)):ti,ab) OR 'neonatal intensive care unit'/exp/mj OR nicu*:ti,ab OR (((newborn OR neonatal OR 'neo natal') NEAR/2 ('intensive care unit*' OR 'intensive care department' OR icu*)):ti,ab) OR 'low birth weight'/exp/mj OR (((lbw OR underweight) NEAR/3 (infant* OR neonat* OR newborn*)):ti,ab) OR 'low birthweight':ti,ab OR 'low birth weight':ti,ab OR 'prematurity'/exp/mj OR ((('pre matur*' OR preterm OR 'pre term') NEAR/3 (infant* OR neonate* OR baby OR babies OR child OR children OR newborn* OR childbirth OR birth OR syndrome)):ti,ab) OR 'premature':ti,ab OR 'prematuritas':ti,ab OR 'prematurity':ti,ab AND (english)/lim AND (1999-2019)/py NOT 'conference abstract':it
Used filters: Systematic reviews ('meta analysis'/de OR cochrane:ab OR embase:ab OR psycinfo:ab OR cinahl:ab OR medline:ab OR ((systematic NEAR/1 (review OR overview)):ab,ti) OR ((meta NEAR/1 analy*):ab,ti) OR metaanalys*:ab,ti OR 'data extraction':ab OR cochrane:jt OR 'systematic review'/de) NOT (('animal experiment'/exp OR 'animal model'/exp OR 'nonhuman'/exp) NOT 'human'/exp)
Observational studies 'major clinical study'/de
= 372 |