Bepaling botinvasie
Uitgangsvraag
Hoe dient botinvasie van de mandibula preoperatief bepaald te worden?
Aanbeveling
Gebruik voor het detecteren van botinvasie de beeldvormende technieken (CT en/of MRI) die standaard gebruikt worden voor het bepalen van de uitbreiding van de primaire tumor.
Overweeg bij een onzekere CT of MRI uitslag een cone beam-CT (CBCT) te maken bij alle mondholtecarcinomen die tegen de mandibula aangelegen zijn om botinvasie te diagnosticeren.
Overweeg het gebruik van SPECT-CT alleen in geselecteerde gevallen waar de uitslagen van CT/MRI/CBCT onzeker zijn en het uitsluiten van botinvasie van invloed is op het chirurgisch behandelplan.
Overwegingen
Er is een redelijk vertrouwen in de gevonden sensitiviteit van SPECT (0,97; 95% betrouwbaarheidsinterval(BHI) 0,92 tot 0,99) bij de diagnostisering van mandibulaire botinvasie. De zekerheid over de gevonden sensitiviteit was laag voor CBCT (0,90; 95%BHI 0,85 to 0,93), CT (0,73; 95%BHI 0,66 tot 0,80), MRI (0,88; 95%BHI 0,78 tot 0,94) en OPG (0,75; 95%BHI 0,67 tot 0,82) bij de diagnostisering van botinvasie en zeeg laag voor CT (0,85; 95%BHI 0,43 tot 0,98), PET-CT (0,90; 95%BHI: 0,58 tot 0.98) en MRI (0,93; 95%BHI 0,81 tot 0,98) bij de diagnostisering van beenmerginvasie door een tumor. Er werden geen data gerapporteerd voor dual energy-CT (DECT).
Voor de specificiteit van beeldvormende modaliteiten is er een redelijk vertrouwen in CT (0,91; 95%BHI 0,88 tot 0,94) en OPG (0,83; 95%BHI 0,79 tot 0,86) bij de diagnostisering van botinvasie. De zekerheid van de gevonden specificiteit van SPECT (0,69; 95%BHI 0,52 tot 0,82), CBCT (0,85; 95%BHI 0,62 tot 0,95), en MRI (0,90; 95%BHI 0,80 tot 0,95) was laag bij de diagnostisering van botinvasie en zeer laag voor CT (0,86; 95%BHI 0,73 tot 0,93), PET-CT (0,89; 95%BHI: 0,85 tot 1,00) en MRI (0,84; 95%BHI 0,60 tot 0,95) bij de diagnostisering van beenmerginvasie. Er werden geen data gerapporteerd voor DECT.
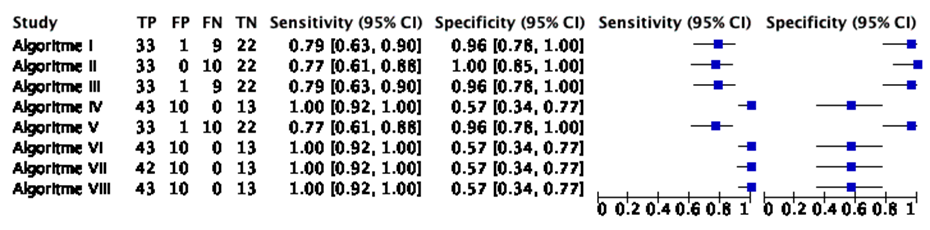
Er was tevens een zeer laag vertrouwen in de acht algoritmen uit Van Cann (2008), voornamelijk door het lage aantal deelnemers in de studie. De diagnostische test accuratesse van elk algoritme is te zien in Tabel 5 (tabblad ‘Samenvatting literatuur’). De auteurs concludeerden dat het uitvoeren van een CT of MRI gevolgd door een SPECT het aantal mandibulaire resecties aanzienlijk zou verminderen en dat SPECT alleen noodzakelijk is indien de voorafgaande CT of MRI geen mandibulaire invasie laat zien (Van Cann, 2008).
Het zeer lage vertrouwen in beeldvormende modaliteiten voor het diagnosticeren van beenmerginvasie door tumoren wordt met name veroorzaakt door onverklaarbare heterogeniteit tussen studies en/of het lage aantal deelnemers in de studies (Qiao, 2018). Er werden geen data gerapporteerd met betrekking tot de positief en negatief voorspellende waarde in de systematische review van Qiao (2018). Na de zoekdatum van deze richtlijnmodule verscheen er een artikel over de diagnostische accuratesse van DECT voor het detecteren van beenmergoedeem (Timmer, 2020). Beenmergoedeem kan optreden bij botinvasie, maar ook bij trauma, bloedingen of ontstekingen. DECT (2e of 3e generatie scanners) werd als indextest afgezet tegenover MRI (Short Tau Inversion Recovery (STIR) of T2-weighted MRI met vetonderdrukking). De gemiddelde tijd tussen DECT en MRI was 9 dagen (SD: 11). Er werden 33 patiënten geselecteerd die tussen 2016 en 2018 zowel DECT als MRI ondergingen voor hoofd-hals abnormaliteiten. Indicaties in de steekproef waren hoofd-hals maligniteiten (n=27, waarvan n=15 voor mondholte maligniteiten), infecties (n=3), goedaardige tumor (n=1), en veranderingen na radiotherapie (n=2). Alle beelden werden door twee radiologen onafhankelijk van elkaar beoordeeld en waren geblindeerd voor de indicatie, klinische diagnose en andere patiëntgegevens. De auteurs rapporteerden de sensitiviteit (0,85), specificiteit (0,92), positief voorspellende waarde (0,94) en negatief voorspellende waarde (0,80), maar geen bijgaande 95% betrouwbaarheidsintervallen. De auteurs concludeerden dat, wanneer er contra-indicaties zijn voor het maken van een MRI, DECT de potentie heeft om als alternatief het beenmergoedeem te kunnen detecteren.
Bij een onjuiste diagnose van botinvasie kan onder- of overbehandeling plaatsvinden. Bij een fout-positieve bevinding wordt onterecht een (uitgebreidere) mandibularesectie verricht. Het hierna ontstane defect dient meestal gereconstrueerd te worden en bemoeilijkt dentale rehabilitatie. Bij een fout-negatieve bevinding zal bij de tumorresectie de resectierand positief zijn, waardoor adjuvante behandeling (heroperatie en/of (chemo)radiotherapie) met bijbehorende morbiditeit nodig is en de prognose waarschijnlijk negatief beïnvloed wordt. Er zijn geen aanvullende argumenten vanuit andere groepen of interventies bekend. Het genoemde probleem bij fout-positieve bevinding en op basis hiervan marginale mandibularesectie is een groter probleem bij patiënten met een lage onderkaak. Bij deze patiënten ontstaat eerder een continuïteitsonderbreking, waardoor meestal een uitgebreidere reconstructie nodig is.
Preoperatief is het belangrijk om zo goed mogelijk geïnformeerd te zijn over eventuele botinvasie van een primair mondholtecarcinoom. Deze informatie wordt gebruikt bij het opstellen van het therapieplan, met name of een marginale dan wel segmentale mandibularesectie dient te worden verricht. De uitgebreidheid van de operatie hangt hier dus (gedeeltelijk) vanaf. De meeste van deze beeldvormend onderzoeken kunnen poliklinisch laagdrempelig gemaakt worden (bijvoorbeeld orthopantomogram (OPG) en CBCT) of worden al gemaakt om de uitbreiding in de weke delen te beoordelen (bijvoorbeeld MRI). De sensitiviteit van de CBCT en MRI is hoog bij een acceptabele specificiteit, waardoor het risico op positieve of krappe resectieranden (met indicatie voor adjuvante behandeling en kans op slechtere overleving) laag is en het risico op een te uitgebreide behandeling (met risico op extra morbiditeit) acceptabel is.
Een CT of MRI wordt in de meeste centra standaard vervaardigd om de uitbreiding naar weke delen te bepalen bij mondholtecarcinomen. Deze scans hebben ook een waarde bij de diagnostiek naar botinvasie. Het gebruik van deze, reeds vervaardigde beeldvorming, zal dan geen belasting en geen extra kosten met zich meebrengen voor het detecteren van botinvasie. Een CBCT is vaak gemakkelijk met lage kosten beschikbaar en heeft ook een goede sensitiviteit. Hoewel een SPECT (botscintigrafie) de hoogste sensitiviteit lijkt te hebben, is dit onderzoek duurder en minder gemakkelijk toegankelijk dan de alternatief beschikbare beeldvormende technieken, die laagdrempelig en tegen lagere kosten kunnen worden vervaardigd. Daarnaast is de kwaliteit van beeldvorming voor (vrijwel) alle modaliteiten in de loop der jaren verbeterd. Dit is een ook in de toekomst een continu proces.
Alle onderzochte beeldvormende onderzoeken zijn voor iedereen bereikbaar. SPECT en DECT zijn minder gemakkelijk toegankelijk, terwijl OPG, CBCT, CT en MRI juist gemakkelijk voor iedere patiënt toegankelijk zijn. Een OPG en CBCT worden routinematig zeer frequent op de polikliniek Mondziekten, Kaak-, en Aangezichtschirurgie verricht. CT en MRI zijn standaard onderzoeken bij patiënten met hoofd-halskanker. Niet elke patiënt kan echter een MRI ondergaan door angst, claustrofobie of metalen voorwerpen in het lichaam. Daarnaast kunnen er restricties zijn voor nierpatiënten om een CT met contrastvloeistof te ondergaan. Zie hiervoor ook de algemene contra-indicaties voor MRI en CT. In deze situaties zou een CBCT alleen mogelijk ook voldoende kunnen zijn. Er zijn geen subgroepen van patiënten bekend met andere waarden en voorkeuren.
Rationale van de aanbeveling: weging van argumenten voor en tegen de interventies
Een OPG wordt veelal standaard verricht voor focusonderzoek. De sensitiviteit (met name voor invasie van het beenmerg) lijkt te laag te zijn, zodat bij een negatieve uitslag aanvullend onderzoek verricht dient te worden. CT en/of MRI worden veelal standaard voor andere doeleinden gemaakt. De sensitiviteit en specificiteit van deze modaliteiten lijken acceptabel te zijn voor het detecteren van botinvasie, zonder extra kosten. SPECT lijkt het meest sensitief te zijn, maar is minder goed toegankelijk en is duurder. Een CBCT lijkt een hoge sensitiviteit en specificiteit voor het detecteren van botinvasie van de mandibula te hebben. CBCT is een onderzoek dat laagdrempelig en tegen lage kosten vaak poliklinisch kan worden verricht omdat veel MKA poliklinieken CBCT apparatuur beschikbaar hebben.
Onderbouwing
Achtergrond
Mandibulaire botinvasie door een mondholtecarcinoom is geassocieerd met een slechtere lokale controle. Botinvasie zou daarom behandeld dienen te worden met een chirurgische resectie van een deel van de mandibula, wat meer functieverlies voor de patiënt kan veroorzaken. Vanwege de verstrekkende consequenties van een chirurgische resectie is het belangrijk om met beeldvorming vóór de ingreep betrouwbaar te kunnen bepalen of er sprake is van mandibulaire botinvasie.
Conclusies / Summary of Findings
Algorithms to detect mandibular bone invasion
|
Very low GRADE |
There is a very low certainty about the sensitivity of the diagnostic algorithm in Van Cann (2008) for diagnosing mandibular bone invasion by a tumor in patients with an oral cavity carcinoma.
Sources: (Van Cann, 2008) |
|
Very low GRADE |
There is a very low certainty about the specificity of the diagnostic algorithm in Van Cann (2008) for diagnosing mandibular bone invasion by a tumor in patients with an oral cavity carcinoma.
Sources: (Van Cann, 2008) |
|
Very low GRADE |
There is a very low certainty about the positive predictive value of the diagnostic algorithm in Van Cann (2008) for diagnosing mandibular bone invasion by a tumor in patients with an oral cavity carcinoma.
Sources: (Van Cann, 2008) |
|
Very low GRADE |
There is a very low certainty about the negative predictive value of the diagnostic algorithm in Van Cann (2008) for diagnosing mandibular bone invasion by a tumor in patients with an oral cavity carcinoma.
Sources: (Van Cann, 2008) |
Samenvatting literatuur
Description of the systematic review for the diagnostic accuracy of imaging modalities
Qiao (2018) performed a diagnostic test accuracy systematic review of imaging modalities for the diagnosis of mandibular bone invasion. On the first of November 2017 the following databases were searched by Qiao (2018): MEDLINE, CINAHL, Latin American and Caribbean Health Sciences, Chinese Biomedical Literature Databases, China National Knowledge Infrastructure, VIP database, and the Wanfang Database. Grey literature was searched in Science Paper Online, System for Information on Grey Literature in Europe, and the WHO International Clinical Trials Registry Platform. Twenty-one Chinese journals were hand-searched for additional relevant studies (journals were not referenced). Studies were included when designed as a cohort, participants were diagnosed with oral or head and neck cancer with preoperative biopsy and mandibulectomy during surgery, the index test of interest was used (CT, MRI, CBCT, OPG, PET-CT, SPECT, BS, US), pathological diagnosis was used as a reference test, the target condition was mandible invasion by the tumor, and when outcomes of interest were reported (or could be calculated). Their search and selection resulted in the inclusion of 49 unique studies (of which 45 were relevant to the PICRO in this guideline module). All of the included studies recruited patients with oral cavity carcinomas, while less than half the studies also recruited some patients with tumor locations outside the oral cavity. Twenty-six studies exclusively selecting oral cavity carcinomas recruited 1372 patients in total. Twenty-three studies recruiting patients with tumors at oral cavity sites as well as head and neck sites included the following tumor locations: cheek (13 studies), lymph node (1 study), tonsil (6 studies), mandible (2 studies), submandibular trigone (1 study), submandibular glad (1 study), oropharynx (5 studies), and/or pharynx (1 study). Two authors independently assessed the risk of bias of the individual studies with the QUADAS-2 instrument. Results of the studies were pooled (statistical model was not mentioned) and a meta-regression was performed, if possible, to assess the observed heterogeneity between studies. The mean age (when reported) of patients varied from 51.5 to 73.6 years. The number of male patients (when reported) participating in studies varied from 50% to 88.2%. The prevalence of mandibular invasion in the included studies varied from 17.6% to 95.2%. The used tracers for SPECT in the 14 included studies were: 99mTechnetium mythelene diphosphonate (n=7), 99mTechnetium hydroxymethelene di phosphonate (n=4), 99mTechnetium dicarboxy propan (n=1), 99mTechnetium 3,3-disphosphono-1,2-propanedicarboxylic acid (n=1), 201TI-chloride (n=1), 99mTechnetium-bisphosphonate (n=1, unclear which specific type), unclear (n=2). Two studies used two different tracers for separate groups in the sample (99mTechnetium mythelene diphosponate or 99mTechnetium hydroxymethylene diphosponate). One study used a dual isotope protocol (99mTechnetium hydroxymethylene diphosphonate and 201TI-chloride).
Description of studies with diagnostic algorithms
Van Cann (2008) described eight different diagnostic algorithms using SPECT, CT, and MRI to diagnose mandibular bone invasion in patients with oral cavity carcinomas. Data from 67 patients (62.7% male) were analyzed. The mean age was 64 years (range: 43-84). Patients had tumours at the following sites: floor of mouth (n=31), retromolar area (n=20), lower alveolar process (n=13), or cheek mucosa (n=3). There were two assessors for each imaging modality. The assessors were blinded from the results of the imaging modalities they did not assess. A positive result for CT was defined as the absence of cortex adjacent to an abnormal tissue mass. A positive result for MRI was defined as the replacement of the hypointense signal of cortical bone by the signal intensity of a tumour on both the SE T2-weighted and SE T1-weighted images, or as a replacement of hyperintense signal of medullary bone by the tumour intensity signal. No criteria were provided for a positive SPECT. The reference test was a histopathological assessment. Cortical bone invasion was defined as the replacement of bone by an advancing tumour front, without invasion to cancellous spaces, the dental canal, or the periodontal ligament. Medullary invasion was defined as the diffuse growth through the cortex into cancellous bone, the dental canal, or the periodontal ligament. The absence of bone invasion was defined as a continuous periosteal layer separating the tumor from bone. Eight algorithms were presented:
Algorithm I: start with SPECT
- Negative SPECT à No invasion.
- Positive SPECT, continue with MRI:
- Negative MRI, continue with CT:
- Negative CT à No invasion.
- Positive CT à Invasion.
- Positive MRI à Invasion.
- Negative MRI, continue with CT:
Algorithm II: start with SPECT:
- Negative SPECT à No invasion.
- Positive SPECT, continue with CT:
- Negative CT, continue with MRI:
- Negative MRI à No invasion.
- Positive MRI àInvasion.
- Positive CT à Invasion.
- Negative CT, continue with MRI:
Algorithm III: start with MRI:
- Positive MRI à Invasion.
- Negative MRI, continue with SPECT:
- Positive SPECT, continue with CT:
- Negative CT à No invasion.
- Positive CT à Invasion.
- Negative SPECT à No invasion.
- Positive SPECT, continue with CT:
Algorithm IV: start with MRI:
- Positive MRI à Invasion.
- Negative MRI, continue with CT:
- Negative CT, continue with SPECT:
- Negative SPECT à No invasion.
- Positive SPECT à Invasion.
- Positive CTà invasion.
- Negative CT, continue with SPECT:
Algorithm V: start with CT:
- Positive CT à Invasion.
- Negative CT, continue with SPECT:
- Positive SPECT, continue with MRI:
- Negative MRI à No invasion.
- Positive MRI à Invasion.
- Negative SPECT à No invasion.
- Positive SPECT, continue with MRI:
Algorithm VI: start with CT:
- Positive CT -> Invasion.
- Negative CT, continue with MRI:
- Negative MRI, continue with SPECT:
- Negative SPECT à No invasion.
- Positive SPECT à Invasion.
- Positive MRI à Invasion.
- Negative MRI, continue with SPECT:
Algorithm VII: start with MRI:
- Positive MRI à Invasion.
- Negative MRI, continue with SPECT:
- Positieve SPECT à Invasion
- Negatieve SPECT à No invasion
- Positieve SPECT à Invasion
Algorithm VIII: start with CT:
- Positive CT à Invasion.
- Negative CT, continue with SPECT:
- Positive SPECT à Invasion.
- Negative SPECT à No invasion.
Results
Diagnostic test accuracy of imaging modalities
Orthopantogram (OPG)
Sensitivity
From 15 studies (n=772, as described in the systematic review’s characteristics table) data were pooled by Qiao (2018) for the sensitivity of OPG in diagnosing mandibular bone invasion. A pooled sensitivity estimate of 0.75 (95%CI: 0.67 to 0.82, I2=62%) was reported. For medullary invasion, Qiao (2018) included 1 study (n=29, as described in the study characteristics table) where a sensitivity of 0.63 was found (95%CI not reported).
Specificity
A pooled specificity estimate of 0.83 (95%CI: 0.79 to 0.86, I2=19%) was calculated by Qiao (2018) for OPG in diagnosing mandibular bone invasion. Data were pooled from 15 studies (n=772, as described in the systematic review’s characteristics table). Qiao (2018) included 1 study (n=29, as described in the study characteristics table) for the specificity of OPG in diagnosing medullary invasion. A specificity of 0.90 was presented (95%CI not reported).
Positive predictive value
No studies were included that reported the positive predictive value for OPG.
Negative predictive value
No studies were included that reported the negative predictive value for OPG.
Cone Beam Computed Tomography (CBCT):
Sensitivity
Data from 5 studies were pooled (n=557, as described in the systematic review’s characteristics table) for CBCT diagnosing mandibular invasion (Qiao, 2018). The pooled sensitivity was 0.90 (95%CI: 0.85 to 0.93, I2=0%).
Specificity
Qiao (2018) pooled data from 5 studies (n=557, as described in the systematic review’s characteristics table) for the specificity of CBCT in diagnosing mandibular bone invasion. A pooled specificity of 0.85 (95%CI: 0.62 to 0.95, I2=80%) was reported.
Positive predictive value
No studies were included that reported the positive predictive value for CBCT.
Negative predictive value
No studies were included that reported the negative value for CBCT.
Computed Tomography (CT)
Sensitivity
From 35 studies (n=1908, as described in the systematic review’s characteristics table) data was pooled by Qiao (2018) for the sensitivity of CT diagnosing mandibular bone invasion. The pooled sensitivity was 0.73 (95%CI: 0.66 to 0.80, I2=70%). Qiao (2018) also pooled data from 4 studies (n=145, as described in the study characteristics table) for the sensitivity of CT in diagnosing mandibular medullary invasion. A pooled sensitivity of 0.85 (95%CI: 0.43 to 0.98, I2=83%) was found.
Specificity
Qiao (2018) calculated a pooled estimate of the specificity of CT diagnosing mandibular bone invasion from 35 studies (n=1908, as described in the systematic review’s characteristics table). From these 35 studies, 9 were published before the year 2000 (publication range: 1990 and 1998, n=397 participants) and 26 were published since the year 2000 (publication range: 2000-2014, n=1511 participants). A pooled specificity of 0.91 (95%CI: 0.88 to 0.94, I2=49%) was reported. The pooled specificity for CT diagnosing medullary invasion was calculated from 5 studies (n=145, as described in the study characteristics table) and was 0.86 (95%CI: 0.73 to 0.93, I2=32%).
Positive predictive value
No studies were included that reported the positive predictive value for CT.
Negative predictive value
No studies were included that reported the negative predictive value for CT.
Positron Emission Tomography-Computed Tomography (PET-CT)
Sensitivity
Four studies (n=114, as described in the systematic review’s characteristics table) were pooled by Qiao (2018) to calculate a summary sensitivity for diagnosing mandibular bone invasion. All of these four studies were published after the year 2000 (range: 2005 and 2011). A pooled sensitivity of 0.90 (95%CI: 0.58 to 0.85, I2= 64%) was reported. Qiao (2018) also included 2 studies for diagnosing medullary invasion with PET-CT. The reported sensitivity in both studies were 0.78 and 1.00, respectively (95% CI’s were not reported).
Specificity
Qiao (2018) pooled 4 studies (n= 114, as described in the systematic review’s characteristics table) to calculate a summary specificity. The four studies were published between 2005 and 2011. A summary specificity of 0.89 (95%CI: 0.77 to 0.96) was reported for PET-CT diagnosing mandibular bone invasion. Qiao (2018) also included two studies for diagnosing medullary invasion with PET-CT. The reported specificity in both studies were 0.14 and 0.86, respectively (95% CI’s were not reported).
Positive predictive value
No studies were included that reported the positive predictive value for PET-CT.
Negative predictive value
No studies were included that reported the negative predictive value for PET-CT.
Single-Photon Emission Computed Tomography (SPECT)
Sensitivity
Qiao (2018) used data from 13 studies on the diagnostic accuracy of SPECT for diagnosing mandibular bone invasion. There was data from 858 patients (as described in the systematic review’s characteristics table of Qiao (2018). Data was pooled and a sensitivity of 0.97 (95%CI: 0.92 to 0.99, I2=72%) was reported.
Specificity
Qiao (2018) reported a pooled specificity of 0.69 (95%CI: 0.52 to 0.82, I2=79%) for SPECT diagnosing mandibular bone invasion. Data from 13 studies (n=858, as described in the systematic review’s characteristics table) was pooled.
Positive predictive value
No studies were included that reported the positive predictive value for SPECT.
Negative predictive value
No studies were included that reported the negative predictive value for SPECT.
Dual Energy Computed Tomography (DECT):
No studies were included that reported the diagnostic test accuracy of DECT.
Magnetic Resonance Imaging (MRI)
Sensitivity
For the sensitivity of MRI in diagnosing mandibular bone invasion, Qiao (2018) pooled data from 18 studies (n=820, as described in the systematic review’s characteristics table). A pooled sensitivity of 0.88 (95%CI: 0.78 to 0.94, I2=76%) was presented. For diagnosing medullary invasion with MRI, data from 7 studies (n=311, as described in the study characteristics table) were pooled by Qiao (2018). The pooled sensitivity was 0.93 (95%CI: 0.81 to 0.98, I2=79%).
Specificity
The pooled specificity of MRI for diagnosing mandibular bone invasion was calculated by Qiao (2018) from data in 18 studies (n=820, as described in the systematic review’s characteristics table). The pooled specificity was 0.90 (95%CI: 0.80 to 0.95, I2=81%). Qiao (2018) also pooled data for the specificity of MRI in diagnosing medullary invasion. From 7 studies (n=311, as described in the study characteristics table), a specificity of 0.84 (95%CI: 0.60 to 0.95, I2=79%) was found.
Positive predictive value
No studies were included that reported the positive predictive value for MRI.
Negative predictive value
No studies were included that reported the positive predictive value for MRI.
Algorithms for bone invasion
Sensitivity
The sensitivity of the algorithms was not reported (Van Cann, 2008). From the reported data about the classifications of the algorithms (i.e. true positives, false positives, false negatives, true negatives) a sensitivity was calculated per algorithm. The sensitivity of the algorithms varied between 0.77 and 1.00. See Table 1 for an overview per algorithm and Figure 1 for a graphical representation.
Specificity
The specificity of the algorithms was not reported (Van Cann, 2008). From the reported data about the classifications of the algorithms (i.e. true positives, false positives, false negatives, true negatives) a specificity was calculated per algorithm. The specificity of the algorithms varied between 0.57 and 1.00. See Table 1 for an overview per algorithm and Figure 1 for a graphical representation.
Positive predictive value
The positive predictive value of the algorithms was not reported (Van Cann, 2008). From the reported data about the classifications of the algorithms (i.e. true positives, false positives, false negatives, true negatives) a positive predictive value was calculated per algorithm. The positive predictive value of the algorithms varied between 0.80 and 1.00. See Table 1 for an overview per algorithm.
Negative predictive value
The negative predictive value of the algorithms was not reported (Van Cann, 2008). From the reported data about the classifications of the algorithms (i.e. true positives, false positives, false negatives, true negatives) a negative predictive value was calculated per algorithm. The negative predictive value of the algorithms varied between 0.69 and 1.00. See Table 1 for an overview per algorithm.
Table 1 An overview of the used modalities and the diagnostic accuracy per algorithm, in Van Cann (2008). The PPV, NPV, sensitivity, and specificity were calculated from the reported (mis)classifications
|
Algorithm |
Sequential tests |
Sample size |
TP |
FP |
FN |
TN |
PPV |
NPV |
Sensitivity (95%CI) |
Specificity (95%CI) |
|
Algorithm I |
SPECT-MRI-CT |
65 |
33 |
1 |
9 |
22 |
0,97 |
0,71 |
0.79 (0.63- 0.90) |
0.96 (0.78-1.00) |
|
Algorithm II |
SPECT-CT-MRI |
66 |
33 |
0 |
10 |
22 |
1,00 |
0,69 |
0.77 (0.61-0.88) |
1.00 (0.85-1.00) |
|
Algorithm III |
MRI-SPECT-CT |
65 |
33 |
1 |
9 |
22 |
0,97 |
0,71 |
0.79 (0.63-0.90) |
0.96 (0.78-1.00) |
|
Algorithm IV |
MRI-CT-SPECT |
66 |
43 |
10 |
0 |
13 |
0,81 |
1.00 |
1.00 (0.92-1.00) |
0.57 (0.34-0.77) |
|
Algorithm V |
CT-SPECT-MRI |
66 |
33 |
1 |
10 |
22 |
0,97 |
0,69 |
0.77 (0.61-0.88) |
0.96 (0.78-1.00) |
|
Algorithm VI |
CT-MRI-SPECT |
66 |
43 |
10 |
0 |
13 |
0,81 |
1,00 |
1.00 (0.92-1.00) |
0.57 (0.34-0.77) |
|
Algorithm VII |
MRI-SPECT |
65 |
42 |
10 |
0 |
13 |
0,80 |
1,00 |
1.00 (0.92-1.00) |
0.57 (0.34-0.77) |
|
Algorithm VIII |
CT-SPECT |
66 |
43 |
10 |
0 |
13 |
0,81 |
1,00 |
1.00 (0.92-1.00) |
0.57 (0.34-0.77) |
|
TP: True positive FP: False positive FN: False negative TN: True negative PPV: Positive predictive value NPV: Negative predictive value CI: Confidence interval |
||||||||||
Figure 1 A graphical representation of the diagnostic accuracy per algorithm, in Van Cann (2008). Sensitivity and specificity were calculated from the reported (mis)classifications
Level of evidence of the literature
Modalities for mandibular bone invasion
OPG
Sensitivity (mandibular bone invasion)
The level of evidence regarding sensitivity (for mandibular bone invasion) was downgraded by 2 levels because of the study limitations (1 level for risk of bias: 72% of the judgements were ‘unclear’ in the assessment with the QUADAS-2 tool) and the number of included patients (1 level for imprecision: the upper and lower limit of the confidence interval of the pooled accuracy estimate may lead to different conclusions); Publication bias was not assessed.
Specificity (mandibular bone invasion):
The level of evidence regarding specificity (for mandibular bone invasion) was downgraded by 2 levels because of the study limitations (1 level for risk of bias: 72% of the judgements were ‘unclear’ in the assessment with the QUADAS-2 tool); Publication bias was not assessed.
Positive predictive value:
The positive predictive value was not reported and therefore a GRADE assessment could not be performed.
Negative predictive value:
The negative predictive value was not reported and therefore a GRADE assessment could not be performed.
CBCT
Sensitivity (mandibular bone invasion)
The level of evidence regarding sensitivity (for mandibular bone invasion) was downgraded by 2 levels because of the study limitations (1 level for risk of bias: 4 out of 5 judgements for the selection of participants, 3 out of 5 judgements for the reference test, and 3 out of 5 judgements for the flow and timing were ‘unclear’ in the assessment with the QUADAS-2 tool) and the number of included patients (1 level for imprecision: the number of included patients is relatively low); Publication bias was not assessed.
Specificity (mandibular bone invasion)
The level of evidence regarding specificity (for mandibular bone invasion) was downgraded by 2 levels because of the study limitations (1 level for risk of bias: 4 out of 5 judgements for the selection of participants, 3 out of 5 judgements for the reference test, and 3 out of 5 judgements for the flow and timing were ‘unclear’ in the assessment with the QUADAS-2 tool) and conflicting results (1 level for inconsistency: the heterogeneity could not be explained by the variables in the meta-regression for CBCT performed by Qiao (2018), The I2 was 90%); Publication bias was not assessed.
Positive predictive value:
The positive predictive value was not reported and therefore a GRADE assessment could not be performed.
Negative predictive value:
The negative predictive value was not reported and therefore a GRADE assessment could not be performed.
CT
Sensitivity (mandibular bone invasion)
The level of evidence regarding sensitivity (for mandibular bone invasion) was downgraded by 2 levels because of the study limitations (1 level for risk of bias: 61% of the judgements were ‘unclear’ in the assessment with the QUADAS-2 tool) and conflicting results (1 level for inconsistency: the heterogeneity could not be explained by the variables in the meta-regression for CT performed by Qiao (2018), The I2 was 70%); Publication bias was not assessed.
Specificity (mandibular bone invasion)
The level of evidence regarding specificity (for mandibular bone invasion) was downgraded by 1 level because of the study limitations (1 level for risk of bias: 61% of the judgements were ‘unclear’ in the assessment with the QUADAS-2 tool); Publication bias was not assessed.
Sensitivity (medullary bone invasion)
The level of evidence regarding sensitivity (for medullary bone invasion) was downgraded by 3 levels because of the study limitations (1 level for risk of bias: 65% of the judgements were ‘unclear’ in the assessment with the QUADAS-2 tool) and conflicting results (2 levels for inconsistency: the confidence intervals overlap insufficiently while the heterogeneity was unexplained, the I2 was 83%); Publication bias was not assessed.
Specificity (medullary bone invasion)
The level of evidence regarding specificity (for medullary bone invasion) was downgraded by 3 levels because of the study limitations (1 level for risk of bias: 65% of the judgements were ‘unclear’ in the assessment with the QUADAS-2 tool) and the number of included patients (2 levels for imprecision: the number of patients was low); Publication bias was not assessed.
Positive predictive value
The positive predictive value was not reported and therefore a GRADE assessment could not be performed.
Negative predictive value
The negative predictive value was not reported and therefore a GRADE assessment could not be performed.
PET-CT
Sensitivity (mandibular bone invasion)
The level of evidence regarding sensitivity was downgraded by 3 levels because of the study limitations (1 level for risk of bias: Three of the four included studies had an unclear risk in the ‘patient selection’ and ‘reference test’ domains of the QUADAS-2 tool) and the number of included patients (2 levels for imprecision: the number of patients was low); Publication bias was not assessed.
Specificity (mandibular bone invasion)
The level of evidence regarding specificity was downgraded by 3 levels because of the study limitations (1 level for risk of bias: Three of the four included studies had an unclear risk in the ‘patient selection’ and ‘reference test’ domains of the QUADAS-2 tool) and the number of included patients (2 levels for imprecision: the number of patients was low); Publication bias was not assessed.
Positive predictive value
The positive predictive value was not reported and therefore a GRADE assessment could not be performed.
Negative predictive value
The negative predictive value was not reported and therefore a GRADE assessment could not be performed.
SPECT
Sensitivity (mandibular bone invasion)
The level of evidence regarding the sensitivity (for mandibular bone invasion) was downgraded by 1 level because of the study limitations (1 level for risk of bias: 57% of the risk of bias judgements were ‘unclear’ in the assessment with the QUADAS-2 tool); publication bias was not assessed.
Specificity (mandibular bone invasion)
The level of evidence regarding specificity (for mandibular bone invasion) was downgraded by 2 levels because of the study limitations (1 level for risk of bias: 57% of the risk of bias judgements were ‘unclear’ in the assessment with the QUADAS-2 tool) and conflicting results (1 level for inconsistency: the heterogeneity could not be explained by the variables in the meta-regression for SPECT performed by Qiao (2018)); Publication bias was not assessed.
Positive predictive value
The positive predictive value was not reported and therefore a GRADE assessment could not be performed.
Negative predictive value
The negative predictive value was not reported and therefore a GRADE assessment could not be performed.
Algorithms for mandibular bone invasion
Algorithms in Van Cann (2008)
Sensitivity
The level of evidence regarding sensitivity was downgraded by 3 levels because of the study limitations (1 level for risk of bias: judgements were largely ‘unclear’ in the risk of bias assessment) and the number of included patients (2 levels for imprecision: the number of included patients is very low); Publication bias was not assessed.
Specificity
The level of evidence regarding specificity was downgraded by 3 levels because of the study limitations (1 level for risk of bias: judgements were largely ‘unclear’ in the risk of bias assessment) and the number of included patients (2 levels for imprecision: the number of included patients is very low and the upper and lower limit of the confidence interval of the pooled accuracy estimate may lead to different conclusions); Publication bias was not assessed.
Positive predictive value
The level of evidence regarding positive predictive value was downgraded by 3 levels because of the study limitations (1 level for risk of bias: judgements were largely ‘unclear’ in the risk of bias assessment) and the number of included patients (2 levels for imprecision: the number of included patients is very low); Publication bias was not assessed.
Negative predictive value
The level of evidence regarding negative predictive value was downgraded by 3 levels because of the study limitations (1 level for risk of bias: judgements were largely ‘unclear’ in the risk of bias assessment) and the number of included patients (2 levels for imprecision: the number of included patients is very low); Publication bias was not assessed.
Conclusions
Imaging modalities (mandibular bone invasion)
The pooled accuracy estimates of imaging modalities and their certainty (following GRADE) for detecting mandibular bone invasion are presented in Table 2. Positive and negative predictive values were not reported.
Table 2 Pooled accuracy estimates and GRADE certainty for imaging modalities detecting mandibular bone invasion
|
Imaging modality |
Sensitivity (95%CI) (GRADE certainty) |
Specificity (95%CI) (GRADE certainty) |
Positive / negative predictive values (95%CI) (GRADE certainty) |
Reference |
|
OPG |
0.75 (0.67-0.82) (LOW) |
0.83 (0.79-0.86) (MODERATE) |
NA |
Qiao 2018 |
|
CBCT |
0.90 (0.85-0.93) (LOW) |
0.85 (0.62-0.95) (LOW) |
NA |
Qiao 2018 |
|
CT |
0.73 (0.66-0.80) (LOW) |
0.91 (0.88-0.94) (MODERATE) |
NA |
Qiao 2018 |
|
PET-CT |
0.90 (0.58-0.85) (VERY LOW) |
0.89 (0.77-0.96) (VERY LOW) |
NA |
Qiao 2018 |
|
SPECT |
0.97 (0.92-0.99) (MODERATE) |
0.69 (0.52-0.82) (LOW) |
NA |
Qiao 2018 |
|
DECT |
NA |
NA |
NA |
NA |
|
MRI |
0.88 (0.78-0.94) (LOW) |
0.90 (0.80-0.95) (LOW) |
NA |
Qiao 2018 |
Imaging modalities (medullary bone invasion)
The pooled accuracy estimates of imaging modalities and their certainty (following GRADE) for detecting medullary bone invasion are presented in Table 3. Positive and negative predictive values were not reported. The working-group decided not to present the test performance in a hypothetical cohort based on an arbitrarily chosen pretest probability.
Table 3 Pooled accuracy estimates and GRADE certainty for imaging modalities detecting medullary bone invasion
|
Imaging modality |
Sensitivity (95%CI) (GRADE certainty) |
Specificity (95%CI) (GRADE certainty) |
Positive/negative predictive values (95%CI) (GRADE certainty) |
Reference |
|
OPG |
NA |
NA |
NA |
NA |
|
CBCT |
NA |
NA |
NA |
NA |
|
CT |
0.85 (0.43-0.98) (VERY LOW) |
0.86 (0.73-0.93) (VERY LOW) |
NA |
Qiao 2018 |
|
PET-CT |
NA |
NA |
NA |
NA |
|
SPECT |
NA |
NA |
NA |
NA |
|
DECT |
NA |
NA |
NA |
NA |
|
MRI |
0.93 (0.81-0.98) (VERY LOW) |
0.84 (0.60-0.95) (VERY LOW) |
NA |
Qiao 2018 |
Zoeken en selecteren
A systematic review of the literature was performed to answer the following question:
What is the diagnostic accuracy of an orthopantogram (OPG), Cone Beam Computed Tomography (CBCT), Computed Tomography (CT), Positron Emission Tomography-Computed Tomography (PET-CT), Single-Photon Emission Computed Tomography (SPECT), Dual Energy Computed Tomography (DECT), Magnetic Resonance Imaging (MRI), or diagnostic algorithms with a pathological assessment as reference to diagnose mandibular bone invasion of a tumor preoperatively in patients with oral cancer?
P: patients with an oral cavity carcinoma at risk for mandibular bone invasion;
I: preoperative diagnosis of mandibular invasion with OPG, CBCT, CT, PET-CT, SPECT, DECT, MRI, or with a diagnostic algorithm;
C: comparison of modalities;
R: postoperative pathological assessment;
O: sensitivity, specificity, positive predictive value, negative predictive value.
A priori, the working group did not define cortical/medullary bone invasion but used the definitions used in the studies.
Relevant outcome measures
The guideline development group considered sensitivity and negative predictive value as a critical outcome measure for decision making; and specificity and positive predictive value as an important outcome measure for decision making.
Search and select (Methods)
The databases Medline (via OVID) and Embase (via embase.com) were searched with relevant terms for primary diagnostic studies of diagnostic algorithms until 18th of November 2019. The systematic literature search resulted in 56 hits. Studies reporting diagnostic algorithms were selected on the following criteria: the population were patients with oral cavity carcinomas, the patients were suspected of mandibular bone invasion, the mandibular invasion was preoperatively diagnosed by using a diagnostic algorithm, the diagnostic accuracy was reported, the reference standard was a postoperative pathological assessment. Studies reporting an algorithm were excluded when the (imaging) data were collected before the year 2000. Based on title and abstract, nineteen studies were initially selected. Eighteen studies were excluded after reading the full-text (see the table with reasons for exclusion under the tab Evidence tables). One study reporting diagnostic algorithms was included.
A second search was performed. The databases Medline (via OVID) and Embase (via embase.com) were searched with relevant terms for diagnostic test accuracy systematic reviews of imaging modalities until 20th of November 2019. The systematic literature search resulted in 22 hits. Studies reporting the diagnostic test accuracy of imaging modalities were selected based on the following criteria: the population were patients with oral cavity carcinomas, the patients were suspected of mandibular bone invasion, the mandibular invasion was preoperatively diagnosed with OPG/CBCT/CT/PET-CT/SPECT/DECT/MRI, the diagnostic accuracy was reported, the reference standard was a postoperative pathological assessment. Based on title and abstract, eleven systematic reviews were initially selected. Ten systematic reviews were excluded after reading the full-text (see the table with reasons for exclusion under the tab Evidence tables). One systematic review reporting the diagnostic accuracy of imaging modalities was included.
The details of both search strategies are depicted under the tab Methods.
Results
Two studies were included in the analysis of the literature (one study for diagnostic algorithms and one diagnostic test accuracy systematic review). Important study characteristics and results are summarized in the evidence tables. The assessment of the risk of bias is summarized in the risk of bias tables (under the tab Evidence tables).
Referenties
- Qiao X, Liu W, Cao Y, Miao C, Yang W, Su N, Ye L, Li L, Li C. Performance of different imaging techniques in the diagnosis of head and neck cancer mandibular invasion: A systematic review and meta-analysis. Oral Oncol. 2018 Nov;86:150-164. doi: 10.1016/j.oraloncology.2018.09.024. Epub 2018 Sep 25. PubMed PMID: 30409295.
- Timmer VCML, Kroonenburgh AMJLV, Henneman WJP, Vaassen LAA, Roele ED, Kessler PAWH, Postma AA. Detection of Bone Marrow Edema in the Head and Neck With Dual-Energy CT: Ready for Clinical Use? AJR Am J Roentgenol. 2020 Apr;214(4):893-899. doi: 10.2214/AJR.19.21881. Epub 2020 Feb 11. PMID: 32045307.
- Van Cann EM, Koole R, Oyen WJ, de Rooy JW, de Wilde PC, Slootweg PJ, Schipper M, Merkx MA, Stoelinga PJ. Assessment of mandibular invasion of squamous cell carcinoma by various modes of imaging: constructing a diagnostic algorithm. Int J Oral Maxillofac Surg. 2008 Jun;37(6):535-41. doi: 10.1016/j.ijom.2008.02.009. Epub 2008 Apr 10. PubMed PMID: 18406107.
Evidence tabellen
Table of quality assessment for systematic reviews of diagnostic studies
Based on AMSTAR checklist (Shea, 2007; BMC Methodol 7: 10; doi:10.1186/1471-2288-7-10) and PRISMA checklist (Moher, 2009, PLoS Med 6: e1000097; doi:10.1371/journal. pmed1000097)
Research question:
|
Study
First author, year |
Appropriate and clearly focused question?1
Yes/no/unclear |
Comprehensive and systematic literature search?2
Yes/no/unclear |
Description of included and excluded studies?3
Yes/no/unclear |
Description of relevant characteristics of included studies?4
Yes/no/unclear |
Assessment of scientific quality of included studies?5
Yes/no/unclear |
Enough similarities between studies to make combining them reasonable?6
Yes/no/unclear |
Potential risk of publication bias taken into account?7
Yes/no/unclear |
Potential conflicts of interest reported?8
Yes/no/unclear |
|
Qiao 2018 |
No
Reason: the question should have been more specific on the domain and outcomes. Although, the focus of the SR can be seen in the inclusioncriteria. |
Yes
Reason: transparent reporting, although the exact search strategy (search string) is not reported. |
No
Reason: Excluded studies were not referenced. |
Yes
Reason: provided in table 1 |
Yes
Reason: performed with QUADAS-2 |
Unclear
Reason: setting and place of diagnostic test is not reported in the systematic review. Diagnostic criteria (or thresholds) were not reported. The authors do perform a meta-regression to assess heterogeneity. |
No
Reason: Authors state that publication bias was not assessed. |
No
Reason: Authors declare that there is no conflict of interest, however this is not reported for the individual studies. |
- Research question (PICO) and inclusion criteria should be appropriate (in relation to the research question to be answered in the clinical guideline) and predefined.
- Search period and strategy should be described; at least Medline searched.
- Potentially relevant studies that are excluded at final selection (after reading the full text) should be referenced with reasons.
- Characteristics of individual studies relevant to the research question (PICO) should be reported.
- Quality of individual studies should be assessed using a quality scoring tool or checklist (preferably QUADAS-2; COSMIN checklist for measuring instruments) and taken into account in the evidence synthesis.
- Clinical and statistical heterogeneity should be assessed; clinical: enough similarities in patient characteristics, diagnostic tests (strategy) to allow pooling? For pooled data: at least 5 studies available for pooling; assessment of statistical heterogeneity and, more importantly (see Note), assessment of the reasons for heterogeneity (if present)? Note: sensitivity and specificity depend on the situation in which the test is being used and the thresholds that have been set, and sensitivity and specificity are correlated; therefore, the use of heterogeneity statistics (p-values; I2) is problematic, and rather than testing whether heterogeneity is present, heterogeneity should be assessed by eye-balling (degree of overlap of confidence intervals in Forest plot), and the reasons for heterogeneity should be examined.
- There is no clear evidence for publication bias in diagnostic studies, and an ongoing discussion on which statistical method should be used. Tests to identify publication bias are likely to give false-positive results, among available tests, Deeks’ test is most valid. Irrespective of the use of statistical methods, you may score “Yes” if the authors discuss the potential risk of publication bias.
- Sources of support (including commercial co-authorship) should be reported in both the systematic review and the included studies. Note: To get a “yes,” source of funding or support must be indicated for the systematic review AND for each of the included studies.
Evidence table for systematic reviews of diagnostic test accuracy studies
|
Study reference |
Study characteristics |
Patient characteristics
|
Index test (test of interest) |
Reference test
|
Follow-up |
Outcome measures and effect size |
Comments |
|
Qiao 2018
(individual study characteristics deduced from Qiao 2018)
|
SR (and meta-analysis)
Literature searches up to November 2017.
1: Abd El-Hafez 2011 2: Acton 2000 3: Ahuja 1990 4: Babin 2008 5: Bahadur 1990 6: Bolzoni 2004 7: Brockenbourgh 2003 8: Brown 1994 9: Chung 1994 10: Curran 1996 11: Dreiseidler 2011 12: Duan 2008 13: Gilbert 1986 14: Goerres 2005 15: Gu 2010 16: Hakim 2014 17: Handschel 2012 18: Hendrikx 2010 19: Heppt 1993 20: Huang 2011 21: Imaizumi 2006 22: Imola 2001 23: Kalavrezos 1996 24: Kim 2013 25: Kolk 2014 26: Kushraj 2011 27: Lane 2000 28: Leipzig 1985 29: Linz 2015 30: Luyk 1986 31: Millesi 1990 32: Momin 2009 33: Mukherji 2001 34: Ord 1997 35: Rajesh 2008 36: Rao 2004 37: Schimming 2000 38: Smyth 1996 39: Soderholm 1990 40: Suzuki 2004 41: Tsue 1994 42: Van Cann 2008a 43: Van Cann 2008b 44: Van den Brekel 1998 45: Vidiri 2010 46: Wiener 2006 47: Yamamoto 2002 48: Zieron 2001 49: Zupi 1996
Study design: cohort (by inclusion criteria), retrospective / prospective 1: Retrospect. 2: Prospect. 3: Retrospect. 4: Prospect. 5: Retrospect. 6: Prospect. 7: Retrospect. 8: Prospect. 9: Retrospect. 10: Retrospect. 11: Prospect. 12: Retrospect. 13: Retrospect. 14: Prospect. 15: Retrospect. 16: Retrospect. 17: Retrospect. 18: Retrospect. 19: Prospect. 20: Prospect. 21: Retrospect. 22: Prospect. 23: Retrospect. 24: Prospect. 25: Prospect. 26: Prospect. 27: Retrospect. 28: Prospect. 29: Retrospect. 30: Retrospect. 31: Prospect. 32: Prospect. 33: Retrospect. 34: Retrospect. 35: Retrospect. 36: Prospect. 37: Prospect. 38: Retrospect. 39: Prospect. 40: Prospect. 41: Retrospect. 42: Prospect. 43: Prospect. 44: Retrospect. 45: Retrospect. 46: Retrospect. 47: Prospect. 48: Retrospect. 49: Retrospect.
Country: 1: China 2: Asutralia 3: Scotland 4: France 5: India 6: Italia 7: US 8: UK 9: US 10: Ireland 11: Germany 12: China 13: US 14: Sweden 15: Korea 16: Germany 17: Germany 18: Netherlands 19: Germany 20: China 21: Japan 22: US 23: Sweden 24: Japan 25: Germany 26: India 27: US 28: US 29: Germany 30: UK 31: Australia 32: Japan 33: US 34: US 35: UK 36: India 37: Germany 38: Ireland 39: Finland 40: Japan 41: USA 42: Netherlands 43: Netherlands 44: Netherlands 45: Italia 46: Germany 47: Japan 48: Germany 49: Italia
Source of funding and conflicts of interest: Authors state that there is no CoI. Not reported for individual studies.
|
Inclusion criteria SR: DTA studies designed as cohort studies, patients diagnosed with oral cancer or head/neck cancer with preoperative biopsy and mandibulectomy during surgery, CT/ MRI / CBCT / OPG / PET-CT / SPECT / BS / US imaging as index test, pathological diagnosis as reference test, mandible invasion by the tumor as the target condition, TP / FP / FN / TN / Se / Sp / LR+ / LR- as outcomes.
Exclusion criteria SR: Not stated
49 studies included.
Important patient characteristics:
Number of patients, mandibular invasion/total (prevalence) 1: 37/114 (32.5%) 2: 36/67 (53.7%) 3: 30/48 (62.5%) 4: 3/17 (17.6%) 5: 11/44 (25%) 6: 14/43 (32.6%) 7: 22/36 (61.1%) 8: 21/35 (60%) 9: 12/22 (54.4%) 10: 9/29 (31%) 11: 48/77 (62.3%) 12: 20/21 (95.2%) 13: 35/104 (33.7%) 14: 12/34 (35.3%) 15: 12/46 (26.1%) 16: 84/210 (40%) 17: 44/107 (41.1%) 18: 11/23 (47.8%) 19: 13/33 (39.4%) 20: 8/17 (47.1%) 21: 25/51 (49%) 22: 20/38 (52.6%) 23: 48/60 (80%) 24: 20/27 (74.1%) 25: 28/50 (56%) 26: 8/15 (53.3%) 27: 14/26 (53.8%) 28: 17/31 (54.8%) 29: 66/197 (33.5%) 30: 4/11 (36.4%) 31: 31/97 (32%) 32: 43/50 (86%) 33: 26/49 (53.1%) 34: 15/46 (32.6%) 35: 19/23 (82.6%) 36: 24/51 (47.1%) 37: 40/88 (45.5%) 38: 27/40 (67.5%) 39: 10/13 (76.9%) 40: 17/34 (50%) 41: 25/64 (39.1%) 42: 44/67 (65.7%) 43: 12/25 (48%) 44: 18/29 (62.1%) 45: 14/36 (38.9%) 46: 8/52 (15.4%) 47: 13/39 (33.3%) 48: 41/89 (46.1%) 49: 23/50 (46%)
Mean age in years, Sex as % male: 1: NR (NR) 2: 61.6 (70.1%) 3: NR (NR) 4: NR (88.2%) 5: range: 22-65 (70.5%) 6: 57 (86%) 7: 65.4 (63.9%) 8: 64.9 (80%) 9: NR (NR) 10: 67 (72.4%) 11: 61 (67.5%) 12: 53.2 (85.7%) 13: 61 (75%) 14: 64.2 (50%) 15: 59.4 (84.8%) 16: NR (NR) 17: 62 (NR) 18: 63 (NR) 19: NR (NR) 20: 54 (94.1%) 21: 61 (76.5%) 22: 60.7 (76.3%) 23: 60.2 (73.3%) 24: 73.6 (40.7%) 25: 61 (86%) 26: NR (NR) 27: NR (NR) 28: NR (NR) 29: 63.7 (66.5%) 30: range:42-74 (63.6%) 31: NR (NR) 32: 55 (60%) 33: 59 (69.4%) 34: 63.2 (56.5%) 35: NR (NR) 36: 53.4 (58.8%) 37: 51.5 (83%) 38: 57 (82.5%) 39: range:40-89 (53.9%) 40: 63 (67.6%) 41: 62 (50%) 42: 63 (62.7%) 43: 54 (60%) 44: 57 (65.5%) 45: 56 (72.2%) 46: 63 (67.3%) 47: 63.2 (53.8%) 48: NR (NR) 49: NR (56%)
Types of tumors included: A: cheek B: gingiva C: tongue D: floor of mouth E: retromolar trigone F: palate G: oral cavity H: oropharynx I: lymph node J: lip K: tonsil L: submandibular triangle M: submandibular gland N: mandible O: pharynx
1: A, B, C, F, E, F 2: D, B, E 3: G 4: G, H 5: A, D, C, B, E, K 6: G, H 7: G 8: D, B, E, I 9: G, H 10: G, H 11: G 12: B 13: C, K, E, B, D 14: B, E 15: G 16: G 17: D, C, B 18: E, D, B 19: D, K 20: A 21: B, D, A 22: B, E, C, K 23: G 24: G 25: B, D, C, F, A 26: G 27: E 28: G 29: D, J, F, N, C, A 30: B, D, L 31: D, C 32: B 33: G 34: D, E, A, B 35: G 36: G 37: C, E, B, D 38: D, B, K 39: G 40: N, D, C, E, J, A, M 41: B, E, D, J, C, A, K, H 42: D, E, B, A 43: D, B, E 44: D, E 45: G 46: B, D, C, F, A 47: C, A, B, D 48: B, D, C, O 49: G
|
Describe index and comparator tests* and cut-off point(s):
1: PET-CT, MRI 2: SPECT, OPG, CT 3: OPG, BS 4: PET-CT, CT 5: CT, BS 6: MRI 7: CT 8: OPG, BS, CT, MRI 9: MRI 10: SOECT, CT 11: SPECT, CT, CBCT 12: SPECT, CT 13: BS 14: SPECT, PET-CT, CT 15: CT, MRI, PET-CT, 16: CT, CBCT, BS, SPECT 17: CT 18: OPG, MRI, CBCT 19: US 20: PET-CT, MRI, CT 21: CT, MRI 22: SPECT, OPG, CT 23: BS, CT 24: MRI, PET-CT 25: SPECT, CT, MRI, OPG 26: OPG, CT, SPECT 27: CT 28: BS 29: OPG, CBCT, BS, CT, MRI 30: BS, OPG 31: CT, BS, US 32: OPG, CBCT 33: CT 34: CT, OPG 35: PET-CT, CT, MRI 36: OPG 37: OPG, CT, SPECT 38: OPG, CT, MRI 39: BS, OPG 40: SPECT, CT 41: CT, MRI 42: SPECT, CT, MRI 43: CT, MRI 44: OPG, CT, MRI 45: CT, MRI 46: CT, MRI 47: SPECT, CT 48: SPECT, CT 49: BS, MRI, CT
|
Describe reference test and cut-off point(s):
1-49: pathological diagnosis
Prevalence (%) 1: 32.5% 2: 53.7% 3: 62.5% 4: 17.6% 5: 25% 6: 32.6% 7: 61.1% 8: 60% 9: 54.4% 10: 31% 11: 62.3% 12: 95.2% 13: 33.7% 14: 35.3% 15: 26.1% 16: 40% 17: 41.1% 18: 47.8% 19: 39.4% 20: 47.1% 21: 49% 22: 2.6% 23: 80% 24: 74.1% 25: 56% 26: 53.3% 27: 53.8% 28: 54.8% 29: 33.5% 30: 36.4% 31: 32% 32: 86% 33: 53.1% 34: 32.6% 35: 82.6% 36: 47.1% 37: 45.5% 38: 67.5% 39: 76.9% 40: 50% 41: 39.1% 42: 65.7% 43: 48% 44: 62.1% 45: 38.9% 46: 15.4% 47: 33.3% 48: 46.1% 49: 46%
For how many participants were no complete outcome data available? N (%) Not reported
Reasons for incomplete outcome data described. Not reported
|
Endpoint of follow-up: N/A |
Outcome measures and effect size (include 95%CI and p-value if available):
SPECT sensitivity for mandibular invasion (95%CI): 2: 0.60 (0.15-0.95) 10: 1.00 (0.66-1.00) 11: 0.92 (0.80-0.98) 12: 1.00 (0.83-1.00) 14: 0.92 (0.62-1.00) 22: 0.95 (0.75-1.00) 25: 1.00 (0.88-1.00) 26: 1.00 (0.63-1.00) 35: 1.00 (0.82-1.00) 40: 0.95 (0.74-1.00) 42: 1.00 (0.92-1.00) 47: 1.00 (0.75-1.00) 48: 0.95 (0.83-0.99) Sensitivity (statistical model not reported): 0.97 (95%CI 0.92 to 0.99) Heterogeneity (reasons): I^2 = 72%
SPECT specificity for mandibular invasion (95%CI): 2: 0.67 (0.30-0.93) 10: 0.29 (0.04-0.71) 11: 0.41 (0.24-0.61) 12: 0.00 (0.00-0.98) 14: 0.86 (0.65-0.97) 22: 0.72 (0.47-0.90) 25: 1.00 (0.85-1.00) 26: 0.14 (0.00-0.58) 35: 0.50 (0.07-0.93) 37: 0.92 (0.80-0.98) 40: 0.73 (0.45-0.92) 42: 0.57 (0.34-0.77) 47: 0.85 (0.65-0.96) 48: 0.56 (0.41-0.71) Specificity (statistical model not reported): 0.69 (95% CI 0.52 to 0.82) Heterogeneity (reasons): I^2 = 79%
SPECT AUC for mandibular invasion (95%CI): AUC (SE) from HSROC curve: AUC = 0.943 (0.039)
CBCT sensitivity for mandibular invasion (95%CI): 11: 0.92 (0.80-0.98) 16: 0.94 (0.79-0.99) 18: 0.91 (0.59-1.00) 29: 0.88 (0.78-0.95) 32: 0.88 (0.75-0.96) Sensitivity (statistical model not reported): 0.90 (95% CI 0.85 to 0.93) Heterogeneity (reasons): I^2 = 0%
CBCT specificity for mandibular invasion (95%CI): (e.g., sensitivity / specificity (%)) 11: 0.97 (0.82-1.00) 16: 0.59 (0.39-0.78) 18: 1.00 (0.74-1.00) 29: 0.83 (0.76-0.89) 32: 0.57 (0.18-0.90) Specificity (statistical model not reported): 0.85 (95% CI 0.62 to 0.95) Heterogeneity (reasons): I^2 = 80%
CBCT AUC for mandibular invasion (95%CI): AUC (SE) from HSROC curve: AUC = 0.946 (0.015)
CT sensitivity for mandibular invasion (95%CI): 2: 0.67 (0.46-0.83) 4: 0.33 (0.01-0.91) 5: 0.80 (0.28-0.99) 7: 0.95 (0.77-1.00) 8: 0.42 (0.15-0.72) 10: 0.89 (0.52-1.00) 11: 0.79 (0.65-0.90) 12: 0.80 (0.56-0.94) 14: 0.92 (0.62-1.00) 15: 0.42 (0.15-0.72) 16: 0.63 (0.45-0.79) 17: 0.82 (0.67-0.92) 20: 0.56 (0.21-0.86) 21: 1.00 (0.86-1.00) 22: 0.55 (0.32-0.77) 23: 0.78 (0.60-0.91) 25: 0.89 (0.72-0.98) 26: 0.75 (0.35-0.97) 27: 0.50 (0.23-0.77) 29: 0.64 (0.48-0.78) 33: 0.96 (0.80-1.00) 34: 0.53 (0.27-0.79) 35: 0.95 (0.74-1.00) 37: 0.90 (0.76-0.97) 38: 0.63 (0.35-0.85) 40: 0.71 (0.44-0.90) 41: 0.50 (0.28-0.72) 42: 0.58 (0.42-0.73) 43: 0.38 (0.18-0.62) 44: 0.64 (0.35-0.87) 45: 0.79 (0.49-0.95) 46: 0.75 (0.34-0.97) 47: 0.38 (-.14-0.68) 48: 0.63 (0.41-0.81) 49: 0.91 (0.72-0.99) Sensitivity (statistical model not reported): 0.73 (95% CI 0.66 to 0.80) Heterogeneity (reasons): I2 = 70%
CT specificity for mandibular invasion (95%CI): 2: 0.90 (0.76-0.97) 4: 1.00 (0.77-1.00) 5: 0.94 (0.71-1.00) 7: 0.79 (0.49-0.95) 8: 1.00 (0.69-1.00) 10: 0.75 (0.43-0.95) 11: 1.00 (0.88-1.00) 12: 1.00 (0.03-1.00) 14: 1.00 (0.85-1.00) 15: 1.00 (0.90-1.00) 16: 0.84 (0.69-0.93) 17: 0.87 (0.77-0.94) 20: 0.50 (0.16-0.84) 21: 0.88 (0.70-0.98) 22: 0.89 (0.65-0.99) 23: 0.80 (0.52-0.96) 25: 1.00 (0.85-1.00) 26: 1.00 (0.59-1.00) 27: 0.92 (0.62-1.00) 29: 0.86 (0.75-0.93) 33: 0.87 (0.66-0.97) 34: 0.93 (0.76-0.99) 35: 1.00 (0.40-1.00) 37: 0.94 (0.83-0.99) 38: 0.75 (0.53-0.90) 40: 1.00 (0.75-1.00) 41: 0.86 (0.67-0.96) 42: 0.96 (0.78-1.00) 43: 0.75 (0.19-0.99) 44: 0.89 (0.52-1.00) 45: 0.82 (0.60-0.95) 46: 0.95 (0.85-0.99) 47: 0.96 (0.80-1.00) 48: 0.78 (0.56-0.93) 49: 0.96 (0.81-1.00) Specificity (statistical model not reported): 0.91 (95% CI 0.88 to 0.94) Heterogeneity (reasons): I^2 = 49%
CT AUC for mandibular invasion (95%CI): AUC (SE) from HSROC curve: AUC = 0.899 (0.029)
CT sensitivity for bone marrow invasion (95%CI): 21: 1.00 (0.86-1.00) 38: 0.90 (0.55-1.00) 43: 0.67 (0.35-0.90) 44: 0.40 (0.12-0.74) Sensitivity (statistical model not reported): 0.85 (95% CI 0.43 to 0.98) Heterogeneity (reasons): I^2 = 83%
CT specificity for bone marrow invasion (95%CI): 21: 0.88 (0.70-0.98) 38: 0.77 (0.58-0.90) 43: 1.00 (0.75-1.00) 44: 0.85 (0.55-0.98) Specificity (statistical model not reported): 0.86 (95% CI 0.73 to 0.93) Heterogeneity (reasons): I^2 = 32%
CT AUC for bone marrow invasion (95%CI): AUC (SE) from HSROC curve: AUC = 0.924 (0.045)
PET-CT sensitivity for mandibular invasion (95%CI): 4: 1.00 (0.29-1.00) 14: 1.00 (0.74-1.00) 15: 0.58 (0.28-0.85) 20: 0.88 (0.47-1.00) Sensitivity (statistical model not reported): 0.90 (95% CI 0.58 to 0.85) Heterogeneity (reasons): I^2 = 64%
PET-CT specificity for mandibular invasion (95%CI): 4: 0.86 (0.57-0.98) 14: 0.91 (0.71-0.99) 15: 0.97 (0.85-1.00) 20: 0.67 (0.30-0.93)
PET-CT AUC for mandibular invasion (95%CI): AUC (SE) from HSROC curve: AUC = 0.929 (0.0349)
MRI sensitivity for mandibular invasion (95%CI): 6: 0.93 (0.68-1.00) 8: 0.91 (0.59-1.00) 9: 1.00 (0.74-1.00) 15: 0.58 (0.28-0.85) 18: 0.82 (0.48-0.98) 20: 0.75 (0.35-0.97) 21: 0.96 (0.80-1.00) 25: 0.96 (0.82-1.00) 29: 0.75 (0.53-0.90) 35: 1.00 (0.82-1.00) 38: 0.67-0.09-0.99) 41: 1.00 (0.29-1.00) 42: 0.63 (0.47-0.77) 43: 0.58 (0.28-0.85) 44: 0.94 (0.73-1.00) 45: 0.93 (0.66-1.00) 46: 1.00 (0.63-1.00) 49: 0.39 (0.20-0.61) Sensitivity (statistical model not reported): 0.88 (95% CI 0.78 to 0.94) Heterogeneity (reasons): I^2 = 76%
MRI specificity for mandibular invasion (95%CI): 6: 0.93 (0.76-0.99) 8: 1.00 (0.29-1.00) 9: 0.40 (0.12-0.74) 15: 0.97 (0.85-1.00) 18: 0.67 (0.35-0.90) 20: 0.75 (0.35-0.97) 21: 0.54 (0.33-0.73) 25: 0.95 (0.77-1.00) 29: 0.97 (0.91-1.00) 35: 0.75 (0.19-0.99) 38: 1.00 (0.48-1.00) 41: 0.50 (0.16-0.84) 42: 1.00 (0.85-1.00) 43: 1.00 (0.75-1.00) 44: 0.73 (0.39-0.94) 45: 0.82 (0.60-0.95) 46: 0.93 (0.81-0.99) 49: 0.96 (0.81-1.00) Specificity (statistical model not reported): 0.90 (95% CI 0.80 to 0.95) Heterogeneity (reasons): I^2 = 81%
MRI AUC for mandibular invasion (95%CI): AUC (SE) from HSROC curve: AUC = 0.929 (0.014)
MRI sensitivity for bone marrow invasion (95%CI): 1: 0.97 (0.86-1.00) 6: 1.00 (0.69-1.00) 9: 1.00 (0.48-1.00) 21: 0.96 (0.80-1.00) 24: 0.95 (0.75-1.00) 43: 0.58 (0.28-0.85) 44: 0.83 (0.52-0.98) Sensitivity (statistical model not reported): 0.93 (95% CI 0.81 to 0.98) Heterogeneity (reasons): I^2 = 79%
MRI specificity for bone marrow invasion (95%CI): 1: 0.61 (0.49-0.72) 6: 1.00 (0.89-1.00) 9: 0.71 (0.44-0.90) 21: 0.81 (0.61-0.93) 24: 0.57 (0.18-0.90) 43: 1.00 (0.75-1.00) 44: 0.65 (0.38-0.86) Specificity (statistical model not reported): 0.84 (95% CI 0.60 to 0.95) Heterogeneity (reasons): I^2 = 79%
MRI AUC for bone marrow invasion (95%CI): AUC (SE) from HSROC curve: AUC = 0.934 (0.030)
OPG sensitivity for mandibular invasion (95%CI): 2: 0.75 (0.58-0.88) 3: 0.93 (0.76-0.99) 8: 0.76 (0.53-0.92) 18: 0.55 (0.23-0.83) 22: 0.50 (0.27-0.73) 25: 0.79 (0.59-0.92) 26: 0.75 (0.35-0.97) 29: 0.59 (0.46-0.71) 30: 1.00 (0.40-1.00) 32: 0.72 (0.56-0.85) 34: 0.87 (0.60-0.98) 36: 0.92 (0.74-0.99) 37: 0.82 (0.67-0.93) 38: 0.81 (0.54-0.96) 39: 0.40 (0.12-0.74) Sensitivity (statistical model not reported): 0.75 (95% CI 0.67 to 0.82) Heterogeneity (reasons): I^2 = 62%
OPG specificity for mandibular invasion (95%CI): 2: 0.71 (0.52-0.86) 3: 0.71 (0.48-0.89) 8: 0.92 (0.62-1.00) 18: 0.92 (0.62-1.00) 22: 0.94 (0.73-1.00) 25: 0.82 (0.60-0.95) 26: 1.00 (0.59-1.00) 29: 0.82 (0.60-0.95) 30: 1.00 (0.59-1.00) 32: 0.86 (0.42-1.00) 34: 0.80 (0.61-0.92) 36: 0.88 (0.70-0.98) 37: 0.79 (0.65-0.90) 38: 0.96 (0.79-1.00) 39: 0.67 (0.09-0.99) Specificity (statistical model not reported): 0.83 (95% CI 0.79 to 0.86) Heterogeneity (reasons): I^2 = 19%
OPG AUC for mandibular invasion (95%CI): AUC (SE) from HSROC curve: AUC = 0.876 (0.022)
OPG for bone marrow invasion (95%CI): Only 1 study measured bone marrow invasion with OPG. From the systematic review it was unclear which study. Sensitivity: 0.63 (95%CI NR) Specificity: 0.90 (95%CI: NR) AUC = N/A |
Study quality (ROB): QUADAS-2
Authors performed meta-regression analysis as a means for heterogeneity analysis.
|
*comparator test equals the C of the PICO; two or more index/ comparator tests may be compared; note that a comparator test is not the same as a reference test (golden standard)
Voor de risk of bias en applicability assessment van individuele studies met het QUADAS-2 beoordelingsinstrument wordt verwezen naar de systematische review van Qiao (2018).
Risk of bias assessment diagnostic accuracy studies (QUADAS II, 2011) voor algoritmen
|
Study reference |
Patient selection
|
Index test |
Reference standard |
Flow and timing |
Comments with respect to applicability |
|
Van Cann 2008 |
Was a consecutive or random sample of patients enrolled? Consecutive
Was a case-control design avoided? Yes
Did the study avoid inappropriate exclusions? Yes
|
Were the index test results interpreted without knowledge of the results of the reference standard? Unclear (observers were unaware of results from other imaging modalities, however such statement was not found with regards to the reference test)
If a threshold was used, was it pre-specified? Thresholds were implicit. Yes (for MRI and CT) No (for spect)
|
Is the reference standard likely to correctly classify the target condition? Yes
Were the reference standard results interpreted without knowledge of the results of the index test? Unclear (not reported who assessed the specimens and whether they were blinded for index test results)
|
Was there an appropriate interval between index test(s) and reference standard? Unclear (time between index and reference test was not described)
Did all patients receive a reference standard? Yes
Did patients receive the same reference standard? Yes
Were all patients included in the analysis? No (there were some exclusions due to CT artefacts, uncertain MR imaging, uncertain SPECT imaging, it is unclear how this may have affected the results since it concerned a low number of exclusions in each analysis) |
Are there concerns that the included patients do not match the review question? No
Are there concerns that the index test, its conduct, or interpretation differ from the review question? No
Are there concerns that the target condition as defined by the reference standard does not match the review question? No
|
|
CONCLUSION: Could the selection of patients have introduced bias?
RISK: LOW |
CONCLUSION: Could the conduct or interpretation of the index test have introduced bias?
RISK: UNCLEAR |
CONCLUSION: Could the reference standard, its conduct, or its interpretation have introduced bias?
RISK: UNCLEAR |
CONCLUSION Could the patient flow have introduced bias?
RISK: Unclear |
|
Judgments on risk of bias are dependent on the research question: some items are more likely to introduce bias than others, and may be given more weight in the final conclusion on the overall risk of bias per domain:
Patient selection:
- Consecutive or random sample has a low risk to introduce bias.
- A case control design is very likely to overestimate accuracy and thus introduce bias.
- Inappropriate exclusion is likely to introduce bias.
Index test:
- This item is similar to “blinding” in intervention studies. The potential for bias is related to the subjectivity of index test interpretation and the order of testing.
- Selecting the test threshold to optimise sensitivity and/or specificity may lead to overoptimistic estimates of test performance and introduce bias.
Reference standard:
- When the reference standard is not 100% sensitive and 100% specific, disagreements between the index test and reference standard may be incorrect, which increases the risk of bias.
- This item is similar to “blinding” in intervention studies. The potential for bias is related to the subjectivity of index test interpretation and the order of testing.
Flow and timing:
- If there is a delay or if treatment is started between index test and reference standard, misclassification may occur due to recovery or deterioration of the condition, which increases the risk of bias.
- If the results of the index test influence the decision on whether to perform the reference standard or which reference standard is used, estimated diagnostic accuracy may be biased.
- All patients who were recruited into the study should be included in the analysis, if not, the risk of bias is increased.
Judgement on applicability:
Patient selection: there may be concerns regarding applicability if patients included in the study differ from those targeted by the review question, in terms of severity of the target condition, demographic features, presence of differential diagnosis or co-morbidity, setting of the study and previous testing protocols.
Index test: if index tests methods differ from those specified in the review question there may be concerns regarding applicability.
Reference standard: the reference standard may be free of bias but the target condition that it defines may differ from the target condition specified in the review question.
Evidence table for diagnostic test accuracy studies
|
Study reference |
Study characteristics |
Patient characteristics |
Index test (test of interest) |
Reference test
|
Follow-up |
Outcome measures and effect size |
Comments |
|
Van Cann 2008 |
Type of study: cohort (prospective data collection, retrospective analyses)
Setting and country: University hospital, the Netherlands
Funding and conflicts of interest: no CoI/funding statements reported in the manuscript |
Inclusion criteria: histologically confirmed tumors fixed or adjacent to the mandible
Exclusion criteria: history of surgery or radiotherapy in the head/neck area. Osteomyelitis, osteonecrosis, recent dental extraction, recent biopsy, trauma to the mandible
N=67
Prevalence: 44/67 = 65.7%
Mean age (range): 63 (43-84).
Sex: 42/67M (62.7%) / 25F (37.2%)
Other important characteristics:
Tumor location: Floor of mouth: 31 Retromolar area: 20 Lower aveolar process: 13 Cheek mucosa: 3
|
Describe individual index tests:
Clinical examinations (procedures not described)
OPT (Periapical radiographs if possible due to pain or limited access) (radiographs were taken tangential to the suspected area. Two surgeons were informed of the SCC site and assessed the radiographs, but unaware of findings of other imaging modalities)
SPECT (SPECT with a dual head gamma camera was performed 3-4 hours after injection with Tc-99m-methylene-diphosphonate. Two nuclear medicine physicians assessed the scans, unaware of findings from other imaging modes)
CT (spiral CT was performed after injection of iohexol. 1.5mm slices were recorded in the area of suspected invasion. Two radiologists assessed the scans, unaware of findings from other modalities)
MRI (Fast spin echo T2-weightet images were recorded on a 1.5T MR system. Two radiologists assessed the MR images, unaware of the findings from other modalities)
Cut-off point(s): For CT: absence of cortex adjacent to an abnormal soft-tissue mass For MRI: replacement of hypointense signal of cortical bone by the signal intensity of tumour on both the SE T2-weightet and SE T1-weighted images -or- as a replacement of hyperintense signal of medullary bone by tumor signal intensity For other modalities: N/A
Describe test strategies:
Algorithm I (2 CT artefacts) Start with SPECT.
Algorithm II (1 uncertain MRI) Start with SPECT.
Algorithm III (2 CT artefacts) Start with MRI.
Algorithm IV (1 uncertain SPECT) Start with MRI.
Algorithm V (1 uncertain MRI) Start with CT.
Algorithm VI (1 uncertain SPECT) Start with CT.
Algorithm VII Start with MRI.
Algorithm VIII Start with CT.
Comparator test: N/A
Cut-off point(s): N/A |
Describe reference test: Pathohistological assessment. Specimens were devided in two groups: Group C(M): present cortical bone invasion or present medullary invasion Group O: no bone invasion
Cut-off point(s): Cortical invasion: replacement of bone by an advancing tumor front without invasion to cancellous spaces / dental canal / periodontal ligament Medullary invasion: diffuse growth through the cortex into cancellous bone / dental canal / periodontal ligament. No invasion: a continuous periosteal layer separating the tumor form bone.
|
Time between the index test and reference test: not described.
For how many participants were no complete outcome data available? 10 participants were excluded because not all imaging data was complete: extreme obesity (n=1), claustrophobia (n=3), no slots available for imaging (n=6) 1 MRI scan and 1 SPECT scan were uncertain. Two CT scans showed artefacts due to metallic dental restorations.
Reasons for incomplete outcome data described. Extreme obesity (n=1), claustrophobia (n=3), no slots available for imaging (n=6) Two CT scans had artefacts due to metallic dental restorations. |
Outcome measures and effect size (include 95%CI and p-value if available):
Algorithm I (2 CT artefacts, n=67) Start with SPECT.
Total false results: 10 False positive: 0.0303 (95%CI: 0.000767-0.158) False negative: 0.290 (95%CI: 0.142-0.480)
Algorithm II (1 uncertain MRI, n=67) Start with SPECT.
Total false results: 11 False positive: 0.0303 (95%CI: 0.000767-0.158) False negative: 0.313 (95%CI: 0.161-0.500)
Algorithm III (2 CT artefacts, n=67) Start with MRI.
Total false results: 10 False positive: 0.0294 (95%CI: 0.000744-0.153) False negative: 0.290 (95%CI: 0.142-0.480)
Algorithm IV (1 uncertain SPECT, n=67) Start with MRI.
Total false results: 10 False positive: 0.385 (95%CI: 0.202-0.594) False negative: 0 (95%CI: 0-0.0881)
Algorithm V (1 uncertain MRI, n=67) Start with CT.
Total false results: 11 False positive: 0.0294 (95%CI: 0.000744-0.153) False negative: 0.313 (95%CI: 0.161-0.500)
Algorithm VI (1 uncertain SPECT) Start with CT.
Total false results: 10 False positive: 0.189 (95%CI: 0.0944-0.320) False negative: 0 (95%CI: 0-0.247)
Algorithm VII N=65 Start with MRI.
Total false results: 10 False positive: 0.192 (95%CI: 0.0963-0.325) False negative: 0 (95%CI: 0-0.247)
Algorithm VIII Start with CT.
Total false results: 10 False positive: 0.189 (95%CI: 0.0944-0.320) False negative: 0 (95%CI: 0-0.247)
|
10 out of 77 participants were excluded because not all imaging data was complete: extreme obesity (n=1), claustrophobia (n=3), no slots available for imaging (n=6) |
Tabel Exclusie na het lezen van het volledige artikel
Algoritmen
|
Auteur en jaartal |
Redenen van exclusie |
|
Kalavrezos 1006 |
Bevatte enkel imaging data van vóór 2000 |
|
Wong 1996 |
Geen algoritme, gaat niet specifiek over mandibula invasie |
|
Ord 1997 |
Geen algoritme |
|
Schimming 2000 |
Geen algoritme |
|
Imola 2001 |
Geen algoritme |
|
Mukherji 2001 |
Geen algoritme |
|
Werning 2001 |
Geen algoritme |
|
Gu 2010 |
Geen algoritme |
|
Arya 2013 |
Geen algoritme |
|
Hakim 2014 |
Geen algoritme |
|
Jamdade 2014 |
Geen algoritme |
|
Kolk 2014 |
Geen algoritme |
|
Li 2015 |
Geen algoritme |
|
Li 2015 |
Artikel in de Chinese taal |
|
Farrow 2016 |
Geen algoritme |
|
Silva 2016 |
Geen algoritme |
|
Qiao 2018 |
Geen algoritme |
|
Nae 2019 |
Geen algoritme, maar diagnostische accuratesse van gecombineerde modaliteiten |
Modaliteiten
|
Auteur en jaartal |
Redenen van exclusie |
|
Uribe 2013 |
Voegt qua studieselectie geen nieuwe informatie toe ten opzichte van Qiao 2018 |
|
Evangelista 2014 |
voegt qua studieselectie geen nieuwe informatie toe ten opzichte van Qiao 2018 |
|
Li 2014 |
voegt qua studieselectie geen nieuwe informatie toe ten opzichte van Qiao 2018, mist een aantal studies ten opzichte van Qiao 2018 |
|
Li 2014 |
Voegt qua studieselectie geen nieuwe informatie toe ten opzichte van Qiao 2018 |
|
Chun-Jie 2015 |
Artikel in de Chinese taal |
|
Li 2015 |
Voegt qua studieselectie geen nieuwe informatie toe ten opzichte van Qiao 2018 |
|
Li 2015 |
Artikel in de Chinese taal |
|
Sheng 2015 |
Conference abstract |
|
Xiaonian 2017 |
Artikel in de Chinese taal |
|
Brandao 2018 |
Mist veel studies over CT en MRI die wel in Qiao 2018 zitten |
Verantwoording
Beoordelingsdatum en geldigheid
Publicatiedatum : 08-01-2024
Beoordeeld op geldigheid :
Algemene gegevens
De ontwikkeling/herziening van deze richtlijnmodule werd ondersteund door het Kennisinstituut van de Federatie Medisch Specialisten en werd gefinancierd uit de Stichting Kwaliteitsgelden Medisch Specialisten (SKMS). De financier heeft geen enkele invloed gehad op de inhoud van de richtlijnmodule.
Samenstelling werkgroep
Voor het ontwikkelen van de richtlijnmodule is in 2019 een multidisciplinaire werkgroep ingesteld, bestaande uit vertegenwoordigers van alle relevante specialismen die betrokken zijn bij de zorg voor patiënten met hoofd-halstumoren.
Werkgroep
- Prof. Dr. R. de Bree, KNO-arts/hoofd-halschirurg, UMC Utrecht, Utrecht, NVKNO (voorzitter)
- Dr. M.B. Karakullukcu, KNO-arts/hoofd-halschirurg, NKI, Amsterdam, NVKNO
- Dr. H.P. Verschuur, KNO-arts/hoofd-halschirurg, Haaglanden MC, Den Haag, NVKNO
- Dr. M. Walenkamp, AIOS-KNO, LUMC, Leiden, NVKNO
- Dr. A. Sewnaik, KNO-arts/hoofd-halschirurg, Erasmus MC, Rotterdam, NVKNO
- Drs. L.H.E. Karssemakers, MKA-chirurg-oncoloog/hoofd-hals chirurg, NKI, Amsterdam, NVMKA
- Dr. M.J.H. Witjes, MKA-chirurg-oncoloog, UMC Groningen, Groningen, NVMKA
- Drs. L.A.A. Vaassen, MKA-chirurg-oncoloog, Maastricht UMC+, Maastricht, NVMKA
- Drs. W.L.J. Weijs, MKA-chirurg-oncoloog, Radboud UMC, Nijmegen, NVKMA
- Drs. E.M. Zwijnenburg, Radiotherapeut-oncoloog, Radboud UMC, Nijmegen, NVRO
- Dr. A. Al-Mamgani, Radiotherapeut-oncoloog, NKI, Amsterdam, NVRO
- Prof. Dr. C.H.J. Terhaard, Radiotherapeut-oncoloog, UMC Utrecht, Utrecht, NVRO
- Drs. J.G.M. Van den Hoek, Radiotherapeut-oncoloog, UMC Groningen, Groningen, NVRO
- Dr. E. Van Meerten, Internist-oncoloog, Erasmus MC Kanker Instituut, Rotterdam, NIV
- Dr. M. Slingerland, Internist-oncoloog, LUMC, Leiden, NIV
- Drs. M.A. Huijing, Plastisch Chirurg, UMC Groningen, Groningen, NVPC
- Prof. Dr. S.M. Willems, Klinisch patholoog, UMC Groningen, Groningen, NVVP
- Prof. Dr. E. Bloemena, Klinisch patholoog, Amsterdam UMC, locatie Vumc, Amsterdam, NVVP
- R.A. Burdorf, Voorzitter dagelijks bestuur patiëntenvereniging, Patiëntenvereniging HOOFD-HALS, PvHH
- P.S. Verdouw, Hoofd infocentrum patiëntenvereniging, Patiëntenvereniging HOOFD-HALS, PvHH
- A.A.M. Goossens, Verpleegkundig specialist oncologie, Haaglanden MC, Den Haag, V&VN
- Dr. P. de Graaf, Radioloog, Amsterdam UMC, Amsterdam, NVvR
- Dr. W.V. Vogel, Nucleair geneeskundige/radiotherapeut-oncoloog, NKI, Amsterdam, NVNG
- Drs. G.J.C. Zwezerijnen, Nucleair geneeskundige, Amsterdam UMC, Amsterdam, NVNG
Klankbordgroep
- Dr. C.M. Speksnijder, Fysiotherapeut, UMC Utrecht, Utrecht, KNGF
- Ir. A. Kok, Diëtist, UMC Utrecht, Utrecht, NVD
- Dr. M.M. Hakkesteegt, Logopedist, Erasmus MC, Rotterdam, NVLF
- Drs. D.J.M. Buurman, Tandarts-MFP, Maastricht UMC+, Maastricht, KNMT
- W. Van der Groot-Roggen, Mondhygiënist, UMC Groningen, Groningen, NVvM
- Drs. D.J.S. Dona, Bedrijfsarts/Klinisch arbeidsgeneeskundige oncologie, Radboud UMC, Nijmegen, NVKA
- Dr. M. Sloots, Ergotherapeut, UMC Utrecht, Utrecht
- J. Poelstra, Medisch maatschappelijk werkster, op persoonlijke titel
Met ondersteuning van
- Dr. J. Boschman, Senior adviseur, Kennisinstituut van de Federatie Medisch Specialisten
- Dr. C. Gaasterland, Adviseur, Kennisinstituut van de Federatie Medisch Specialisten
- Dr. A. Van der Hout, Adviseur, Kennisinstituut van de Federatie Medisch Specialisten
- Dr. L. Oostendorp, Adviseur, Kennisinstituut van de Federatie Medisch Specialisten
- Drs. M. Oerbekke, Adviseur, Kennisinstituut van de Federatie Medisch Specialisten
- Drs. A. Hoeven, Junior adviseur, Kennisinstituut van de Federatie Medisch Specialisten
Belangenverklaringen
De Code ter voorkoming van oneigenlijke beïnvloeding door belangenverstrengeling is gevolgd. Alle werkgroepleden hebben schriftelijk verklaard of zij in de laatste drie jaar directe financiële belangen (betrekking bij een commercieel bedrijf, persoonlijke financiële belangen, onderzoeksfinanciering) of indirecte belangen (persoonlijke relaties, reputatiemanagement) hebben gehad. Gedurende de ontwikkeling of herziening van een module worden wijzigingen in belangen aan de voorzitter doorgegeven. De belangenverklaring wordt opnieuw bevestigd tijdens de commentaarfase.
Een overzicht van de belangen van werkgroepleden en het oordeel over het omgaan met eventuele belangen vindt u in onderstaande tabel. De ondertekende belangenverklaringen zijn op te vragen bij het secretariaat van het Kennisinstituut van de Federatie Medisch Specialisten.
|
Werkgroeplid |
Functie |
Nevenfuncties |
Gemelde belangen |
Ondernomen actie |
|
Bree, de |
KNO-arts/hoofd-halschirurg, UMC Utrecht |
* Lid Algemeen Bestuur Patiëntenvereniging Hoofd-Hals (onbetaald) * Voorzitter Research Stuurgroep NWHHT * Lid Richtlijnen commissie NWHHT * Lid dagelijks bestuur NWHHT * Lid Clinical Audit Board van de Dutch Head and Neck Audit (DHNA) * Lid wetenschappelijk adviescommissie DORP * Voorzitter Adviescommissie onderzoek hoofd-halskanker (IKNL/PALGA/DHNA/NWHHT) |
Geen |
Geen |
|
Slingerland |
Internist-oncoloog, LUMC |
* 2018-present: Treasurer of the "Dutch Association of Medical Oncology"(NVMO - vacancy fees) * 2018-present: Member of the "Dutch Working Group for Head-Neck Tumors" (NWHHT-Systemic therapy) * 2016-present: Member of the 'Dutch Working Group for Head-Neck Tumors" (NWHHT - study group steering group (coordinating)) * 2016-present: Member of the "Dutch Working Group for Head-Neck Tumors" (NWHHT - Elderly Platform) * 2012-present: Member "Working Group for Head-Neck Tumors" (WHHT) "University Cancer Centre"(UCK) Leiden - Den Haag * 2019: Member CAB DHNA |
Deelname Nationaal expert forum hoofd-halskanker MSD dd 2-5-2018
* Deelname Checkmate studie, sponsor Bristol-Myers Squibb (BMS): An open label, randomized phase 3 clinical trial of nivolumab versus therapy of investigator's choice in recurrent or metastatic platinum-refractory squamous cell carcinoma of the head and neck (SCCHN) * Deelname Commence studie, sponsor Radboud University, in collaboration with Merck Serono International SA (among several Dutch medical centers): A phase lB-II study of the combination of cetuximab and methotrexate in recurrent of metastatic squamous cell carcinoma of the head and neck. A study of the Dutch Head and Neck Society, MOHN01/COMMENCE study. * Deelname HESPECTA studie: Phase I study: to determine the biological activity of two HPV16E6 specific peptides coupled to Amplivant®, a Toll-like receptor ligand in non-metastatic patients treated for HPV16-positive head and neck cancer. * Deelname PINCH studie (nog niet open): PD-L1 ImagiNg to predict durvalumab treatment response in HNSCC (PINCH) trial; patiënten met biopt bewezen locally recurrent of gemetastaseerd HNSCC * Deelname ISA 101b-HN-01-17 studie (nog niet open): A randomized, Double-blind, Placebo-Controlled, Phase 2 Study of Cemiplimab versus the combination of Cemiplimab with ISA101b in the Treatment of Subjects. |
In de werkgroep participeren 2 internist-oncologen, zodat één van beide de voortrekker is van modules over systemische therapie. Actie: werkgroeplid is uitgesloten van besluitvorming bij modules die betrekking hebben op de onderwerpen van de gemelde onderzoeken: nivolumab, cetuximab + methotrexaat, Amplivant, durvalumab, cemiplimab. |
|
Meerten, van |
Internist-oncoloog, Erasmus MC Kanker Instituut |
Geen |
Op dit moment Principal Investigator voor NL van gerandomiseerde fase III trial naar toegevoegde waarde van pembrolizumab aan chemoradiotherapie bij patiënten met gevorderd hoofdhalskanker. Sponsor: GlaxoSmithKline Research & Development Ltd. Studie is nog lopend, resultaten zullen pas bekend zijn na verschijning van de richtlijn.
In toekomst mogelijk participatie aan door industrie gesponsorde studies op gebied van behandeling van hoofdhalskanker |
In de werkgroep participeren 2 internist-oncologen, zodat één van beide de voortrekker is van modules over systemische therapie. Actie: werkgroeplid is uitgesloten van besluitvorming bij modules die betrekking hebben op het onderwerp van het gemelde onderzoeken: de toegevoegde waarde van pembrolizumab bij patiënten met gevorderd hoofdhalskanker. |
|
Huijing |
Plastisch chirurg, UMC Groningen |
Geen |
Geen |
Geen |
|
Sewnaik |
KNO-arts/hoofd Hals chirurg, Erasmus MC |
Sectorhoofd Hoofd-Hals chirurgie |
Geen |
Geen |
|
Vaassen |
MKA-chirurg-oncoloog, Maastricht UMC+ / CBT Zuid-Limburg |
*Lid Bestuur NVMKA *Waarnemend hoofd MKA-chirurgie MUMC |
Geen |
Geen |
|
Witjes |
MKA-chirurg-oncoloog, UMC Groningen |
Geen |
PI van KWF grant: RUG 2015 -8084: Image guided surgery for margin assessment of head & neck Cancer using cetuximab-IRDye800 cONjugate (ICON)
geen financieel belang |
Geen. Financiering door KWF werd niet als een belang ingeschat. |
|
Bloemena |
Klinisch patholoog, Amsterdam UMC (locatie Vumc) / Radboud UMC / Academisch Centrum voor Tandheelkunde Amsterdam (ACTA) |
* Lid bestuur Nederlandse Vereniging voor Pathologie (NVVP) – vacatiegeld (tot 1-12-20) * Voorzitter Commissie Bij- en Nascholing (NVVP) * Voorzitter (tot 1-12-20) Wetenschappelijke Raad PALGA - onbezoldigd |
Geen |
Geen |
|
Willems |
Klinisch patholoog, UMC Groningen |
Vice-vz PALGA, AB NWHHT, CAB DHNA, mede-vz en oprichter expertisegroep HH pathologie NL, Hoofdhalspathologie UMC Groningen |
PDL1 trainer NL voor MSD Onderzoeksfinanciering van Pfizer, Roche, MSD, BMS, Lilly, Novartis, Bayer, Amge, AstraZeneca |
Geen |
|
Karakullukcu |
KNO-arts/hoofd-hals chirurg, NKI/AVL |
Geen |
Geen |
Geen |
|
Verschuur |
KNO-arts/Hoofd-hals chirurg, Haaglanden MC |
* Opleider KNO-artsen |
Geen |
Geen |
|
Walenkamp |
AIOS KNO, LUMC |
Geen |
Geen |
Geen |
|
Al-Mamgani |
Radiotherapeut-oncoloog, NKI/AVL |
Geen |
Geen |
Geen |
|
Terhaard |
Radiotherapeut-oncoloog, UMC Utrecht |
Niet van toepassing |
Geen |
Geen |
|
Hoek, van den |
Radiotherapeut-oncoloog UMCG |
Niet van toepassing |
Geen |
Geen |
|
Zwijnenburg |
Radiotherapeut, Hoofd-hals Radboud UMC |
Geen |
Geen |
Geen |
|
Burdorf |
Patiëntvertegenwoordiger |
Geen |
Geen |
Geen |
|
Verdouw |
Hoofd Infocentrum patiëntenvereniging HOOFD HALS |
Geen |
Werkzaam bij de patiëntenvereniging. De achterban heeft baat bij een herziening van de richtlijn |
Geen |
|
Karssemakers |
Hoofd-hals chirurg NKI/AVL
MKA-chirurg-oncoloog Amsterdam UMC (locatie AMC) / vakgroep kaakchirurgie Amsterdam West |
Niet van toepassing |
Geen |
Geen |
|
Goossens |
Verpleegkundig specialist, Haaglanden Medisch Centrum (HMC) |
* Bestuurslid (penningmeester) PWHHT (onbetaald) * Lid Commissie voorlichting PVHH (onbetaald) |
Geen |
Geen |
|
Zwezerijnen |
Nucleair geneeskundige, Amsterdam UMC (locatie Vumc)
PhD kandidaat, Amsterdam UMC (locatie Vumc) |
Lid als nucleair geneeskundige in HOVON imaging werkgroep (bespreken van richtlijnen en opzetten/uitvoeren van wetenschappelijke studies met betrekking tot beeldvorming in de hematologie); onbetaald |
Geen |
Geen |
|
Vogel |
Nucleair geneeskundige/radiotherapeut-oncoloog, AVL |
Geen |
In de afgelopen jaren incidenteel advies of onderwijs, betaald door Bayer, maar niet gerelateerd aan hoofd-hals
KWF-grant speekselklier toxiteit na behandeling. Geen belang bij de richtlijn |
Geen |
|
Graaf, de |
Radioloog, Amsterdam UMC (locatie Vumc) |
Bestuurslid sectie Hoofd-Hals radiologie (onbetaald) |
Geen |
Geen |
|
Weijs |
MKA-chirurg-oncoloog, Radboudumc |
MKA-chirurg, Weijsheidstand B.V. Werkzaam als algemeen praktiserend MKA-chirurg, betaald (0,1 fte) |
Geen |
Geen |
Inbreng patiëntenperspectief
Er werd aandacht besteed aan het patiëntenperspectief door het uitnodigen van de patiëntenvereniging HOOFD-HALS (PVHH) voor de Invitational conference en met afgevaardigden van de PVHH in de werkgroep. Het verslag hiervan (zie bijlagen) is besproken in de werkgroep. De verkregen input is meegenomen bij het opstellen van de uitgangsvragen, de keuze voor de uitkomstmaten en bij het opstellen van de overwegingen. De conceptrichtlijn is tevens voor commentaar voorgelegd aan de patiëntenvereniging HOOFD-HALS en de eventueel aangeleverde commentaren zijn bekeken en verwerkt.
Methode ontwikkeling
Evidence based
Werkwijze
AGREE
Deze richtlijnmodule is opgesteld conform de eisen vermeld in het rapport Medisch Specialistische Richtlijnen 2.0 van de adviescommissie Richtlijnen van de Raad Kwaliteit. Dit rapport is gebaseerd op het AGREE II instrument (Appraisal of Guidelines for Research & Evaluation II; Brouwers, 2010).
Knelpuntenanalyse en uitgangsvragen
Tijdens de voorbereidende fase inventariseerden de werkgroep de knelpunten in de zorg voor patiënten met hoofd-halstumoren. De werkgroep beoordeelde de aanbeveling(en) uit de eerdere richtlijnmodule (NVKNO, 2014) op noodzaak tot revisie. Tevens zijn er knelpunten aangedragen door de patiëntenvereniging en genodigde partijen tijdens de invitational conference (zie de bijlagen voor het verslag van de invitational conference). Op basis van de uitkomsten van de knelpuntenanalyse zijn door de werkgroep concept-uitgangsvragen opgesteld en definitief vastgesteld.
Uitkomstmaten
Na het opstellen van de zoekvraag behorende bij de uitgangsvraag inventariseerde de werkgroep welke uitkomstmaten voor de patiënt relevant zijn, waarbij zowel naar gewenste als ongewenste effecten werd gekeken. Hierbij werd een maximum van acht uitkomstmaten gehanteerd. De werkgroep waardeerde deze uitkomstmaten volgens hun relatieve belang bij de besluitvorming rondom aanbevelingen, als cruciaal (kritiek voor de besluitvorming), belangrijk (maar niet cruciaal) en onbelangrijk. Tevens definieerde de werkgroep tenminste voor de cruciale uitkomstmaten welke verschillen zij klinisch (patiënt) relevant vonden.
Methode literatuursamenvatting
Een uitgebreide beschrijving van de strategie voor zoeken en selecteren van literatuur en de beoordeling van de risk-of-bias van de individuele studies is te vinden onder ‘Zoeken en selecteren’ onder Onderbouwing. De beoordeling van de kracht van het wetenschappelijke bewijs wordt hieronder toegelicht.
Beoordelen van de kracht van het wetenschappelijke bewijs
De kracht van het wetenschappelijke bewijs werd bepaald volgens de GRADE-methode. GRADE staat voor ‘Grading Recommendations Assessment, Development and Evaluation’ (zie http://www.gradeworkinggroup.org/). De basisprincipes van de GRADE-methodiek zijn: het benoemen en prioriteren van de klinisch (patiënt) relevante uitkomstmaten, een systematische review per uitkomstmaat, en een beoordeling van de bewijskracht per uitkomstmaat op basis van de acht GRADE-domeinen (domeinen voor downgraden: risk of bias, inconsistentie, indirectheid, imprecisie, en publicatiebias; domeinen voor upgraden: dosis-effect relatie, groot effect, en residuele plausibele confounding).
GRADE onderscheidt vier gradaties voor de kwaliteit van het wetenschappelijk bewijs: hoog, redelijk, laag en zeer laag. Deze gradaties verwijzen naar de mate van zekerheid die er bestaat over de literatuurconclusie, in het bijzonder de mate van zekerheid dat de literatuurconclusie de aanbeveling adequaat ondersteunt (Schünemann, 2013; Hultcrantz, 2017).
|
GRADE |
Definitie |
|
Hoog |
|
|
Redelijk |
|
|
Laag |
|
|
Zeer laag |
|
Bij het beoordelen (graderen) van de kracht van het wetenschappelijk bewijs in richtlijnen volgens de GRADE-methodiek spelen grenzen voor klinische besluitvorming een belangrijke rol (Hultcrantz, 2017). Dit zijn de grenzen die bij overschrijding aanleiding zouden geven tot een aanpassing van de aanbeveling. Om de grenzen voor klinische besluitvorming te bepalen moeten alle relevante uitkomstmaten en overwegingen worden meegewogen. De grenzen voor klinische besluitvorming zijn daarmee niet één op één vergelijkbaar met het minimaal klinisch relevant verschil (Minimal Clinically Important Difference, MCID). Met name in situaties waarin een interventie geen belangrijke nadelen heeft en de kosten relatief laag zijn, kan de grens voor klinische besluitvorming met betrekking tot de effectiviteit van de interventie bij een lagere waarde (dichter bij het nuleffect) liggen dan de MCID (Hultcrantz, 2017).
Overwegingen (van bewijs naar aanbeveling)
Om te komen tot een aanbeveling zijn naast (de kwaliteit van) het wetenschappelijke bewijs ook andere aspecten belangrijk en worden meegewogen, zoals aanvullende argumenten uit bijvoorbeeld de biomechanica of fysiologie, waarden en voorkeuren van patiënten, kosten (middelenbeslag), aanvaardbaarheid, haalbaarheid en implementatie. Deze aspecten zijn systematisch vermeld en beoordeeld (gewogen) onder het kopje ‘Overwegingen’ en kunnen (mede) gebaseerd zijn op expert opinion. Hierbij is gebruik gemaakt van een gestructureerd format gebaseerd op het evidence-to-decision framework van de internationale GRADE Working Group (Alonso-Coello, 2016a; Alonso-Coello, 2016b). Dit evidence-to-decision framework is een integraal onderdeel van de GRADE-methodiek.
Formuleren van aanbevelingen
De aanbevelingen geven antwoord op de uitgangsvraag en zijn gebaseerd op het beschikbare wetenschappelijke bewijs en de belangrijkste overwegingen, en een weging van de gunstige en ongunstige effecten van de relevante interventies. De kracht van het wetenschappelijk bewijs en het gewicht dat door de werkgroep wordt toegekend aan de overwegingen, bepalen samen de sterkte van de aanbeveling. Conform de GRADE-methodiek sluit een lage bewijskracht van conclusies in de systematische literatuuranalyse een sterke aanbeveling niet a priori uit, en zijn bij een hoge bewijskracht ook zwakke aanbevelingen mogelijk (Agoritsas, 2017; Neumann, 2016). De sterkte van de aanbeveling wordt altijd bepaald door weging van alle relevante argumenten tezamen. De werkgroep heeft bij elke aanbeveling opgenomen hoe zij tot de richting en sterkte van de aanbeveling zijn gekomen.
In de GRADE-methodiek wordt onderscheid gemaakt tussen sterke en zwakke (of conditionele) aanbevelingen. De sterkte van een aanbeveling verwijst naar de mate van zekerheid dat de voordelen van de interventie opwegen tegen de nadelen (of vice versa), gezien over het hele spectrum van patiënten waarvoor de aanbeveling is bedoeld. De sterkte van een aanbeveling heeft duidelijke implicaties voor patiënten, behandelaars en beleidsmakers (zie onderstaande tabel). Een aanbeveling is geen dictaat, zelfs een sterke aanbeveling gebaseerd op bewijs van hoge kwaliteit (GRADE-gradering HOOG) zal niet altijd van toepassing zijn, onder alle mogelijke omstandigheden en voor elke individuele patiënt.
|
Implicaties van sterke en zwakke aanbevelingen voor verschillende richtlijngebruikers |
||
|
|
Sterke aanbeveling |
Zwakke (conditionele) aanbeveling |
|
Voor patiënten |
De meeste patiënten zouden de aanbevolen interventie of aanpak kiezen en slechts een klein aantal niet. |
Een aanzienlijk deel van de patiënten zouden de aanbevolen interventie of aanpak kiezen, maar veel patiënten ook niet. |
|
Voor behandelaars |
De meeste patiënten zouden de aanbevolen interventie of aanpak moeten ontvangen. |
Er zijn meerdere geschikte interventies of aanpakken. De patiënt moet worden ondersteund bij de keuze voor de interventie of aanpak die het beste aansluit bij zijn of haar waarden en voorkeuren. |
|
Voor beleidsmakers |
De aanbevolen interventie of aanpak kan worden gezien als standaardbeleid. |
Beleidsbepaling vereist uitvoerige discussie met betrokkenheid van veel stakeholders. Er is een grotere kans op lokale beleidsverschillen. |
Organisatie van zorg
In de knelpuntenanalyse en bij de ontwikkeling van de richtlijnmodule is expliciet aandacht geweest voor de organisatie van zorg: alle aspecten die randvoorwaardelijk zijn voor het verlenen van zorg (zoals coördinatie, communicatie, (financiële) middelen, mankracht en infrastructuur). Randvoorwaarden die relevant zijn voor het beantwoorden van deze specifieke uitgangsvraag zijn genoemd bij de overwegingen. Meer algemene, overkoepelende, of bijkomende aspecten van de organisatie van zorg worden behandeld in de module Organisatie van zorg.
Commentaar- en autorisatiefase
De conceptrichtlijnmodule werd aan de betrokken (wetenschappelijke) verenigingen en (patiënt) organisaties voorgelegd ter commentaar. De commentaren werden verzameld en besproken met de werkgroep. Naar aanleiding van de commentaren werd de conceptrichtlijnmodule aangepast en definitief vastgesteld door de werkgroep. De definitieve richtlijnmodule werd aan de deelnemende (wetenschappelijke) verenigingen en (patiënt) organisaties voorgelegd voor autorisatie en door hen geautoriseerd dan wel geaccordeerd.
Agoritsas T, Merglen A, Heen AF, Kristiansen A, Neumann I, Brito JP, Brignardello-Petersen R, Alexander PE, Rind DM, Vandvik PO, Guyatt GH. UpToDate adherence to GRADE criteria for strong recommendations: an analytical survey. BMJ Open. 2017 Nov 16;7(11):e018593. doi: 10.1136/bmjopen-2017-018593. PubMed PMID: 29150475; PubMed Central PMCID: PMC5701989.
Alonso-Coello P, Schünemann HJ, Moberg J, Brignardello-Petersen R, Akl EA, Davoli M, Treweek S, Mustafa RA, Rada G, Rosenbaum S, Morelli A, Guyatt GH, Oxman AD; GRADE Working Group. GRADE Evidence to Decision (EtD) frameworks: a systematic and transparent approach to making well informed healthcare choices. 1: Introduction. BMJ. 2016 Jun 28;353:i2016. doi: 10.1136/bmj.i2016. PubMed PMID: 27353417.
Alonso-Coello P, Oxman AD, Moberg J, Brignardello-Petersen R, Akl EA, Davoli M, Treweek S, Mustafa RA, Vandvik PO, Meerpohl J, Guyatt GH, Schünemann HJ; GRADE Working Group. GRADE Evidence to Decision (EtD) frameworks: a systematic and transparent approach to making well informed healthcare choices. 2: Clinical practice guidelines. BMJ. 2016 Jun 30;353:i2089. doi: 10.1136/bmj.i2089. PubMed PMID: 27365494.
Brouwers MC, Kho ME, Browman GP, Burgers JS, Cluzeau F, Feder G, Fervers B, Graham ID, Grimshaw J, Hanna SE, Littlejohns P, Makarski J, Zitzelsberger L; AGREE Next Steps Consortium. AGREE II: advancing guideline development, reporting and evaluation in health care. CMAJ. 2010 Dec 14;182(18):E839-42. doi: 10.1503/cmaj.090449. Epub 2010 Jul 5. Review. PubMed PMID: 20603348; PubMed Central PMCID: PMC3001530.
Hultcrantz M, Rind D, Akl EA, Treweek S, Mustafa RA, Iorio A, Alper BS, Meerpohl JJ, Murad MH, Ansari MT, Katikireddi SV, Östlund P, Tranæus S, Christensen R, Gartlehner G, Brozek J, Izcovich A, Schünemann H, Guyatt G. The GRADE Working Group clarifies the construct of certainty of evidence. J Clin Epidemiol. 2017 Jul;87:4-13. doi: 10.1016/j.jclinepi.2017.05.006. Epub 2017 May 18. PubMed PMID: 28529184; PubMed Central PMCID: PMC6542664.
Medisch Specialistische Richtlijnen 2.0 (2012). Adviescommissie Richtlijnen van de Raad Kwalitieit. https://richtlijnendatabase.nl/over_deze_site/richtlijnontwikkeling.html.
Neumann I, Santesso N, Akl EA, Rind DM, Vandvik PO, Alonso-Coello P, Agoritsas T, Mustafa RA, Alexander PE, Schünemann H, Guyatt GH. A guide for health professionals to interpret and use recommendations in guidelines developed with the GRADE approach. J Clin Epidemiol. 2016 Apr;72:45-55. doi: 10.1016/j.jclinepi.2015.11.017. Epub 2016 Jan 6. Review. PubMed PMID: 26772609.
Schünemann H, Brożek J, Guyatt G, et al. GRADE handbook for grading quality of evidence and strength of recommendations. Updated October 2013. The GRADE Working Group, 2013. Available from http://gdt.guidelinedevelopment.org/central_prod/_design/client/handbook/handbook.html.
Schünemann HJ, Oxman AD, Brozek J, Glasziou P, Jaeschke R, Vist GE, Williams JW Jr, Kunz R, Craig J, Montori VM, Bossuyt P, Guyatt GH; GRADE Working Group. Grading quality of evidence and strength of recommendations for diagnostic tests and strategies. BMJ. 2008 May 17;336(7653):1106-10. doi: 10.1136/bmj.39500.677199.AE. Erratum in: BMJ. 2008 May 24;336(7654). doi: 10.1136/bmj.a139.
Schünemann, A Holger J (corrected to Schünemann, Holger J). PubMed PMID: 18483053; PubMed Central PMCID: PMC2386626.
Wessels M, Hielkema L, van der Weijden T. How to identify existing literature on patients' knowledge, views, and values: the development of a validated search filter. J Med Libr Assoc. 2016 Oct;104(4):320-324. PubMed PMID: 27822157; PubMed Central PMCID: PMC5079497.
Zoekverantwoording
Algoritmen
|
Uitgangsvraag: Hoe dient botinvasie preoperatief van de mandibula bepaald te worden, door middel van diagnostische algoritmen |
|
|
Database(s): Ovid/Medline |
Datum: 18-11-2019 |
|
Periode: niet van toepassing |
Talen: niet van toepassing |
|
Toelichting: In eerste instantie gezocht met de P en de I. Vanwege het geringe aantal referenties de keuze gemaakt om alleen met mandibular invasion te zoeken zonder de combinatie met mondholtecarcinoom en zonder een filtering op studiedesign toe te passen. Vr. groet, Ingeborg van Dusseldorp |
|
|
|
Inclusief dubbele referenties |
Ontdubbeld |
|
Totaal |
95 |
56 |
Ovid/Medline
1 exp Mandible/ or mandib*.ti,ab,kf. or exp Mandibular Neoplasms/ or jaw.ti,ab,kf. (130121)
2 exp Neoplasm Invasiveness/ or invasi*.ti,ab,kw. or involvement.ti,ab,kf. (942372)
3 1 and 2 (4930)
4 exp Algorithms/ or algorithm*.ti,ab,kf. or 'test batter*'.ti,ab,kf. or ('combin*' and (method* or examin*)).ti,ab,kf. (1135807)
5 3 and 4 (280)
6 exp "Sensitivity and Specificity"/ or (specificit* of screening or accura* or reference value* or false positive of false negative or predictive value or roc or likelyhood* or likelihood*).ti,ab,kf. (1393295)
7 5 and 6 (50)
Embase
|
No. |
Query |
Results |
|
#9 |
#8 NOT ‘conference abstract’:it |
45 |
|
#8 |
#1 AND #2 AND #3 |
56 |
|
#7 |
#5 AND #6 |
4 |
|
#6 |
('clinical trial'/exp OR 'randomization'/exp OR 'single blind procedure'/exp OR 'double blind procedure'/exp OR 'crossover procedure'/exp OR 'placebo'/exp OR 'prospective study'/exp OR rct:ab,ti OR random*:ab,ti OR 'single blind':ab,ti OR 'randomised controlled trial':ab,ti OR 'randomized controlled trial'/exp OR placebo*:ab,ti) NOT 'conference abstract':it |
2312047 |
|
#5 |
#1 AND #2 AND #3 AND #4 |
23 |
|
#4 |
'mouth tumor'/exp OR 'oral cavity squamous cell carcinoma'/exp OR ((('buccal mucosa' OR intraoral OR 'oral' OR mouth OR tongue OR pharynx OR 'salivary gland*') NEAR/7 (tumor* OR tumour* OR carcinoma* OR cancer* OR neoplasm* OR squamous)):ti,ab) |
148660 |
|
#3 |
'sensitivity and specificity'/exp OR 'screening'/exp OR 'reference value'/exp OR 'diagnostic error'/exp OR 'predictive value'/exp OR 'receiver operating characteristic'/exp OR specificit*:ab,ti OR screening:ab,ti OR accura*:ab,ti OR 'reference value*':ab,ti OR 'false positive':ab,ti OR 'false negative':ab,ti OR 'predictive value*':ab,ti OR roc:ab,ti OR likelyhood*:ab,ti OR likelihood*:ab,ti |
2955922 |
|
#2 |
'algorithm'/exp OR 'algorithm':ti,ab OR 'test batter*':ti,ab OR ('combin*':ti,ab,kw AND (method*:ti,ab,kw OR examin*:ti,ab,kw)) |
1432654 |
|
#1 |
('mandible'/exp OR mandib*:ti,ab,kw OR 'lower jaw':ti,ab,kw OR 'jaw cancer'/exp OR 'jaw cancer':ti,ab,kw) AND ('tumor invasion'/exp OR invasi*:ti,ab OR involvement:ti,ab) |
4694 |
Modaliteiten
|
Uitgangsvraag: Hoe dient botinvasie (preoperatief) van de mandibula bewaakt te worden? modaliteiten |
|
|
Database(s): Ovid/Medline, Embase |
Datum: 20-11-2019 |
|
Periode: niet van toepassing |
Talen: niet van toepassing |
|
Toelichting: Alle sleutelartikelen werden gevonden. Vr. groet, Ingeborg van Dusseldorp |
|
|
|
Inclusief dubbele referenties |
Ontdubbeld |
|
SR |
31 |
22 |
Ovid/Medline
1 exp Diagnostic Imaging/ or exp radiography/ or 'spect'.ti,ab,kf. or 'single photon emission computed tomograph*'.ti,ab,kf. or 'single photon emission computer tomograph*'.ti,ab,kf. or 'dual energy ct'.ti,ab,kf. or 'dual energy computed tomography'.ti,ab,kf. or 'cone beam ct'.ti,ab,kf. or 'cone beam computed tomograph*'.ti,ab,kf. or 'cone beam computerized tomograph*'.ti,ab,kf. or 'cone-beam computed tomograph*'.ti,ab,kf. or 'spiral cone-beam computed tomograph*'.ti,ab,kf. or 'volume ct'.ti,ab,kf. or 'volume computed tomograph*'.ti,ab,kf. or 'volumetric ct'.ti,ab,kf. or 'volumetric computed tomograph*'.ti,ab,kf. or cbct.ti,ab,kf. or 'cat scan'.ti,ab,kf. or 'cat scanning'.ti,ab,kf. or 'computed tomographic scan'.ti,ab,kf. or 'computed tomograph*'.ti,ab,kf. or 'computed tomography scan'.ti,ab,kf. or 'computer assisted tomograph*'.ti,ab,kf. or 'computer tomograph*'.ti,ab,kf. or 'computerised axial tomograph*'.ti,ab,kf. or 'computerised tomograph*'.ti,ab,kf. or 'computerized axial tomograph*'.ti,ab,kf. or 'computerized tomograph*'.ti,ab,kf. or 'computerized tomography scan'.ti,ab,kf. or 'expert plus'.ti,ab,kf. or 'expert plus 1t'.ti,ab,kf. or 'mri'.ti,ab,kf. or 'nmr imaging'.ti,ab,kf. or 'imaging, magnetization transfer'.ti,ab,kf. or 'magnetic resonance imaging'.ti,ab,kf. or 'magnetic resonance tomograph*'.ti,ab,kf. or 'magnetization transfer imaging'.ti,ab,kf. or 'mr imaging'.ti,ab,kf. or 'nuclear magnetic resonance imaging'.ti,ab,kf. or 'orthopantography'.ti,ab,kf. or 'orthopantomograph*'.ti,ab,kf. or 'panoramic radiography'.ti,ab,kf. or 'pantomograph*'.ti,ab,kf. or 'radiography, panoramic'.ti,ab,kf. (2772799)
2 (exp Mandible/ or mandib*.ti,ab,kf. or exp Mandibular Neoplasms/ or jaw.ti,ab,kf.) and (exp Neoplasm Invasiveness/ or invasi*.ti,ab,kw. or involvement.ti,ab,kf.) (4931)
3 exp "Sensitivity and Specificity"/ or (specificit* of screening or accura* or reference value* or false positive of false negative or predictive value or roc or likelyhood* or likelihood*).ti,ab,kf. (1394731)
4 (meta-analysis/ or meta-analysis as topic/ or (meta adj analy$).tw. or ((systematic* or literature) adj2 review$1).tw. or (systematic adj overview$1).tw. or exp "Review Literature as Topic"/ or cochrane.ab. or cochrane.jw. or embase.ab. or medline.ab. or (psychlit or psyclit).ab. or (cinahl or cinhal).ab. or cancerlit.ab. or ((selection criteria or data extraction).ab. and "review"/)) not (Comment/ or Editorial/ or Letter/ or (animals/ not humans/)) (421944)
5 1 and 2 and 3 and 4 (13)
Embase
|
No. |
Query |
Results |
|
#25 |
#2 AND #4 AND #16 AND #24 |
18 |
|
#24 |
#1 OR #20 OR #23 |
2611701 |
|
#23 |
'radiography'/exp |
1207427 |
|
#22 |
#2 AND #4 AND #16 AND #21 |
18 |
|
#21 |
#1 OR #20 |
1834816 |
|
#20 |
'computer assisted diagnosis'/exp |
1098009 |
|
#19 |
#17 AND #18 |
6 |
|
#18 |
#6 OR #7 OR #10 OR #12 OR #14 |
61 |
|
#17 |
#5 AND #16 |
18 |
|
#16 |
('meta analysis'/de OR cochrane:ab OR embase:ab OR psycinfo:ab OR cinahl:ab OR medline:ab OR ((systematic NEAR/1 (review OR overview)):ab,ti) OR ((meta NEAR/1 analy*):ab,ti) OR metaanalys*:ab,ti OR 'data extraction':ab OR cochrane:jt OR 'systematic review'/de) NOT (('animal experiment'/exp OR 'animal model'/exp OR 'nonhuman'/exp) NOT 'human'/exp) |
463146 |
|
#15 |
#5 AND #14 |
1 |
|
#14 |
brandao AND magnetic AND mandibular AND invasion AND 2018 |
1 |
|
#13 |
#5 AND #12 |
2 |
|
#12 |
li AND computed AND tomography AND mandibular AND 2014 |
47 |
|
#11 |
#5 AND #10 |
1 |
|
#10 |
li AND magnetic AND mandibular AND 2014 |
10 |
|
#9 |
#5 AND #7 |
3 |
|
#8 |
#5 AND #6 |
1 |
|
#7 |
li AND emission AND mandibular AND 2015 |
3 |
|
#6 |
qiao AND performance AND mandibular AND 2018 |
1 |
|
#5 |
#3 AND #4 |
277 |
|
#4 |
'sensitivity and specificity'/exp OR 'screening'/exp OR 'reference value'/exp OR 'diagnostic error'/exp OR 'predictive value'/exp OR 'receiver operating characteristic'/exp OR specificit*:ab,ti OR screening:ab,ti OR accura*:ab,ti OR 'reference value*':ab,ti OR 'false positive':ab,ti OR 'false negative':ab,ti OR 'predictive value*':ab,ti OR roc:ab,ti OR likelyhood*:ab,ti OR likelihood*:ab,ti |
2959582 |
|
#3 |
#1 AND #2 |
1518 |
|
#2 |
('mandible'/exp OR mandib*:ti,ab,kw OR 'lower jaw':ti,ab,kw OR 'jaw cancer'/exp OR 'jaw cancer':ti,ab,kw) AND ('tumor invasion'/exp OR invasi*:ti,ab OR involvement:ti,ab) |
4694 |
|
#1 |
'single photon emission computed tomography'/exp OR 'spect':ti,ab OR 'single photon emission computed tomography':ti,ab OR 'single photon emission computer tomography':ti,ab OR 'dual energy computed tomography'/exp OR 'dual energy ct':ti,ab OR 'dual energy computed tomography':ti,ab OR 'cone beam computed tomography'/exp OR 'cone beam ct':ti,ab OR 'cone beam computed tomography':ti,ab OR 'cone beam computerized tomography':ti,ab OR 'cone-beam computed tomography':ti,ab OR 'spiral cone-beam computed tomography':ti,ab OR 'volume ct':ti,ab OR 'volume computed tomography':ti,ab OR 'volumetric ct':ti,ab OR 'volumetric computed tomography':ti,ab OR cbct:ti,ab OR 'computer assisted tomography'/exp OR 'cat scan':ti,ab OR 'cat scanning':ti,ab OR 'computed tomographic scan':ti,ab OR 'computed tomography':ti,ab OR 'computed tomography scan':ti,ab OR 'computer assisted tomography':ti,ab OR 'computer tomography':ti,ab OR 'computerised axial tomography':ti,ab OR 'computerised tomography':ti,ab OR 'computerized axial tomography':ti,ab OR 'computerized tomography':ti,ab OR 'computerized tomography scan':ti,ab OR 'nuclear magnetic resonance imaging'/exp OR 'expert plus':ti,ab OR 'expert plus 1t':ti,ab OR 'mri':ti,ab OR 'nmr imaging':ti,ab OR 'imaging, magnetization transfer':ti,ab OR 'magnetic resonance imaging':ti,ab OR 'magnetic resonance tomography':ti,ab OR 'magnetization transfer imaging':ti,ab OR 'mr imaging':ti,ab OR 'nuclear magnetic resonance imaging':ti,ab OR 'panoramic radiography'/exp OR 'orthopantography':ti,ab OR 'orthopantomography':ti,ab OR 'panoramic radiography':ti,ab OR 'pantomography':ti,ab OR 'radiography, panoramic':ti,ab |
1793177 |