Diagnostiek
Uitgangsvraag
Welke tests zijn geïndiceerd om de diagnose jicht te kunnen stellen?
Aanbeveling
Stel de diagnose jicht door het microscopisch aantonen van uraatkristallen in synoviaal vocht (kristalbewijs). Er wordt geadviseerd om bij elke patiënt een diagnostische punctie te overwegen om kristalbewijs te verkrijgen aangezien dit de gouden standaard is.
- Bij twijfel of er sprake is van een topheuze lesie wordt een diagnostische punctie geadviseerd.
Overweeg beeldvormende diagnostiek indien kristalbewijs of klinische diagnose (aanwezigheid van tophus) niet mogelijk is. De keuze is afhankelijk van beschikbaarheid en expertise van de reumatoloog/radioloog:
- Echografie (gerichte diagnostische punctie, topheus beeld, dubbel contour)
- DECT (bij symptoomduur (vanaf eerste jichtaanval) langer dan 2 jaar)
Overweeg de Janssens gout calculator of de 2015 ACR/EULAR classificatie criteria indien er geen andere (gevalideerde) diagnostische opties voor handen zijn.
Overwegingen
Voor- en nadelen van de interventie en de kwaliteit van het bewijs
In totaal zijn er zes studies (d.w.z. één systematische review (SR) en vijf individuele studies) beschreven die de plaats van DECT en/of echografie voor het stellen van de diagnose op basis van beeldvorming vergelijken met het stellen van de diagnose op basis van classificatie criteria en/of de gouden standaard, namelijk kristalbewijs, bij patiënten met verdenking op jicht.
Over het algemeen berusten de studies op retrospectieve data, worden ze uitgevoerd in verschillende populaties, varieert de prevalentie van de diagnose ‘jicht’, en is de beeldvormende diagnostiek door verschillende personen uitgevoerd. Mede door deze factoren variëren de sensitiviteit en specificiteit. Hetzelfde geldt ook voor de positief voorspellende waarde en negatief voorspellende waarde. De bewijskracht voor deze uitkomsten wordt, gegradeerd met GRADE, (zeer) laag. De bewijskracht voor de cruciale uitkomstmaat ‘sensitiviteit’ komt overeen met de bewijskracht voor de belangrijke uitkomstmaten. Er is behoefte aan geblindeerd onderzoek naar het gebruik van echografie en DECT bij het stellen van de diagnose jicht waarbij kristalbewijs als referentietest gebruikt wordt. Daarnaast zou onderzoek naar de bijdrage van plaatsbepaling bij een punctie middels echografie (bijvoorbeeld punctie ter plaatse van echografische tophus) gewenst zijn. Tevens moet worden opgemerkt dat de DECT minder betrouwbaar is bij een symptoomduur van <2 jaar. Dit staat beschreven in een artikel van Jia (2017) en in het proefschrift van Gamala (2019). Gamala (2019) benoemt hierbij dat symptoomduur gezien kan worden als de tijd vanaf de start van de eerste artritis symptomen volgens de patiënt.
Literatuur voormalige richtlijn jicht (2013)
In het kader van het gebruik van criteria sets is het van belang te wijzen op essentiële verschillen (in gerichtheid en daarmee performance) van diagnostische criteria en classificatie criteria. De eerstgenoemde categorie bestaat in feite nauwelijks. De tweede genoemde categorie beoogt samenstelling van homogene groepen van patiënten met een bepaalde aandoening (bijvoorbeeld jicht) om studies te doen en vergelijkingen op groepsniveau met resultaten van andere onderzoekers mogelijk te maken. Die homogeniteit vergt een zo laag mogelijke ‘vervuiling’ met fout-positieven, dus een hoge specificiteit. Dit gaat logischerwijs gepaard met verlies aan sensitiviteit, dat wil zeggen men mist terecht-positieven. Vooral personen die de ziekte net ontwikkeld hebben - dus juist waar vroegdiagnostiek gewenst is - lopen risico terecht te komen in de groep ‘gemiste terecht-positieven’ bij het gebruik van classificatiecriteria. Diagnostische criteria daarentegen richten zich op individuen met relatief kort bestaande ziekteverschijnselen. Men wil zo weinig mogelijk van deze mensen ongediagnosticeerd laten. Daarom moeten diagnostische criteria een hoge sensitiviteit hebben en dat gaat weer gepaard met verlies aan specificiteit. Samengevat verliezen classificatie criteria het per definitie op het vlak van sensitiviteit.
Nieuwe ontwikkelingen classificatie criteria
Sinds de vorige richtlijn zijn er nieuwe ACR/EULAR classificatiecriteria ontwikkeld in 2015.
De domeinen van de nieuwe classificatiecriteria omvatten: kliniek (patroon van gewrichts-/slijmbeursbetrokkenheid, kenmerken en tijdsverloop van symptomatische episodes), laboratorium (serum urinezuur (SU)), uraatkristallen-negatieve aspiratie van synoviaal vocht) en beeldvorming (dubbel contour op echografie of uraat-depositie op CT met dubbele energie (DECT) of radiografische jicht gerelateerde/specifieke erosie). Dit staat beschreven in een artikel van Neogi (2015). De richtlijn ‘jicht’ van de ACR/EULAR geeft hiervan een sensitiviteit en specificiteit van 92% en 89%, respectievelijk (op basis van SUGAR validation data set; Neogi, 2015). In onze literatuursearch werd één onderzoek gevonden waarin de ACR/EULAR criteria worden vergeleken met gewrichtspunctie (Gamala, 2020). De sensitiviteit was 63% (95%CI 48% tot 76%) en de specificiteit 79% (95%CI 63% tot 90%). Voor het berekenen van de ACR/EULAR criteria wordt vanuit deze richtlijn verwezen naar: https://goutclassificationcalculator.auckland.ac.nz/. Deze criteria zijn overigens ontwikkeld als classificatie criteria en niet als diagnostische criteria en zijn hiervoor ook niet gevalideerd.
Gout calculator
De gout calculator van Janssens (2010) is ontwikkeld en gevalideerd voor de eerste lijn. Er is ook een onderzoek hoe dit instrument de diagnose van jicht mogelijk kan verbeteren in de tweede lijn (Kienhorst, 2015). Het doel van deze studie was om dit instrument te valideren in een tweedelijns populatie met de gouden standaard (kristalbewijs middels gewrichtspunctie) als referentie. Het artikel concludeert dat dit instrument goede prestaties laat zien in de tweede lijn en de voorspellende waarde van de klinische diagnose jicht verbetert. De positieve en negatieve voorspellende waardes waren 64% en 87%, respectievelijk. Met de huidige ontwikkeling in de zorg zijn er reumatologen werkzaam in de anderhalvelijnszorg, waarbij er niet altijd een polarisatiemicroscoop, echoapparaat of een DECT beschikbaar is. In deze setting kan eventueel gebruik worden gemaakt van de gout calculator van Janssens (te vinden op https://www.radboudumc.nl/patientenzorg/aandoeningen/jicht/jicht-calculator).
Voor-/nadelen interventie
Voordelen van kristalbewijs (van synoviaal vocht dan wel tophus) is dat wanneer uraatkristallen worden aangetoond, de diagnose zeker is. Derhalve is dit de gouden standaard. Daarnaast kan de patiënt direct lokaal worden behandeld. Een negatieve punctie sluit jicht echter niet uit. Derhalve dient rekening gehouden te worden met comorbiditeit. Zie ‘Toxiciteitsmonitoring’ in de module Chronische jicht – optimale medicamenteuze behandeling voor de te bepalen parameters bij aanvullend laboratoriumonderzoek. Microscopisch onderzoek dient te worden uitgevoerd door een getraind zorgprofessional.
De voordelen van echografie zijn patiëntvriendelijkheid, het is non-invasief en kan door de reumatoloog zelf worden uitgevoerd. Nadelen zijn de tijdsintensiviteit en de subjectiviteit.
De DECT is non-invasief en patiëntvriendelijk. Nadelen zijn hogere kosten (dan gewrichtspunctie en/of echo), (beperkte) stralingsbelasting en, in tegenstelling tot gewrichtspunctie of echografie, is de uitslag niet meteen bekend. Tenslotte is de DECT (nog) niet in elk behandelcentrum beschikbaar en moeten de radiologen hiervoor apart getraind worden.
Bestaande literatuur
In de samenvatting van de literatuur is de systematische review van Shang (2022) als uitgangspunt gebruikt. In deze review wordt geconcludeerd dat beide methodes (DECT en echografie) veelbelovende diagnostische waardes laten zien. De diagnostische waardes voor DECT zijn mogelijk beter om de diagnose jicht te kunnen stellen in vergelijking met echografie, met name bij langer bestaande jicht. Volgens de meest recente EULAR-richtlijn (Richette, 2018) heeft echografie een veel belovende diagnostische waarde, mede wegens het echogeleid kunnen verkrijgen van synoviaal vocht waarbij uraatkristallen microscopisch aangetoond kunnen worden. Het microscopisch aantonen van de aanwezigheid van uraatkristallen in synoviaal vocht dan wel tophus is de gouden standaard bij de diagnostiek naar jicht (Neogi 2015).
Praktijkervaring
Patiënten presenteren zich over het algemeen met een mono- of oligoartritis waarbij ook voor de differentiaaldiagnose synoviaal vocht wordt verkregen. Het vocht wordt onder andere onderzocht op uraatkristallen. Na aspiratie kan de patiënt zo nodig direct behandeld worden met glucocorticoïden waarbij de patiënt niet opnieuw geprikt hoeft te worden.
In de praktijk wordt gezien dat het verkrijgen van kristalbewijs niet altijd haalbaar is, bijvoorbeeld door prikangst bij patiënt of bij een aanhoudende hoge verdenking ondanks meermaals negatieve puncties. In zulke gevallen zijn aanvullende mogelijkheden voor beeldvorming zinvol. Het inzetten van echografie is een veilige en snelle methode hiervoor, waarbij de uitslag ook direct beschikbaar is. De DECT is daarentegen niet in alle centra beschikbaar en bij twijfelgevallen is de verslaglegging afhankelijk van de ervaring van de radioloog. Beide onderzoeken zijn dus in de praktijk inzetbaar om de diagnose jicht te stellen als een punctie niet mogelijk is of als getwijfeld wordt over de diagnose bij een negatieve uitslag van de punctie. Hierbij kan op basis van de EULAR/ACR criteria of de gout calculator van Janssens worden nagegaan hoe aannemelijk het is dat een patiënt jicht heeft.
Waarden en voorkeuren van patiënten (en evt. hun verzorgers)
Patiënten zijn gebaat bij een juiste diagnose zodat ook de juiste therapie kan worden ingezet. Over het algemeen zijn patiënten gemotiveerd voor het behandelen van jicht en daarmee het voorkomen van nieuwe jichtaanvallen.
Vaak is een diagnostische punctie een onderdeel van het diagnostisch proces, mede afhankelijk van de klinische presentatie. Bij jicht is een presentatie van monoartritis, oligoartrits, tenosynovits, bursitis of zelfs polyartritis mogelijk. Bij presentatie wordt een diagnostische punctie verkregen om het synoviaal vocht te kunnen onderzoeken. Onder andere voor microscopie (polarisatiemicroscoop), maar ook om andere oorzaken uit te sluiten (CPPD kristallen, hemartros, lyme, septische artritis).
De voorkeur van patiënten gaat over het algemeen uit naar niet-invasieve diagnostische methoden. Met name op het moment van een actieve artritis kan gewrichtspunctie pijnlijk zijn, de patiënt kan dan voorkeur geven aan bijvoorbeeld echografie of DECT. Met de patiënt wordt besproken waarom een punctie verricht wordt, deze wordt alleen uitgevoerd als patiënt of wettelijk vertegenwoordiger akkoord geeft.
Kosten (middelenbeslag)
Zowel het microscopisch aantonen van uraatkristallen als echografie brengt weinig kosten met zich mee. Zowel een polarisatiemicroscoop als een echoapparaat zijn in bijna elke reumatologische praktijk beschikbaar. Voor beide is training nodig, welke tijdens de opleiding tot reumatoloog plaatsvindt.
Aanvaardbaarheid, haalbaarheid en implementatie
Op dit moment is kristalbewijs de gouden standaard. De EULAR-richtlijn jicht uit 2018 hanteert dit ook als de gouden standaard (Richette, 2020). Hoewel de literatuur veel belovend is voor zowel echografie als DECT, is de bewijslast laag voor beide diagnostische methoden. Een diagnostische punctie is zoals eerdergenoemd onderdeel van het diagnostisch proces. Iedere reumatologische praktijk heeft een polarisatiemicroscoop, zie ook NVR kwaliteitsnormen (2020). Reumatologen in opleiding worden onderwezen in het onderzoeken van synoviaal vocht naar de aanwezigheid van onder andere jichtkristallen. Daarnaast is er in veel reumatologie praktijken een echoapparaat aanwezig waarmee laagdrempelig echografie kan worden verricht. Over het algemeen hebben de meeste reumatologische praktijken een reumatoloog die bedreven is in de echografie. Dit is wel een voorwaarde om echografie uit te kunnen voeren. In de NVR kwaliteitsnormen (2020) staat beschreven dat echoapparatuur ter beschikking van de reumatoloog staat op de polikliniek. DECT is momenteel nog niet in alle centra beschikbaar, daarnaast is expertise van een in DECT getrainde radioloog essentieel.
De beschreven diagnostische strategie verschilt van de strategie in de eerste lijn. Dit verschil in diagnostische instrumenten komt onder andere voort uit het verwachte verschil in populatie (meer diagnostische onzekerheid in de tweede lijn door de selectie in doorverwijzing). Zie ook de NHG-standaard Artritis.
Rationale van de aanbeveling:
De gouden standaard blijft vooralsnog kristalbewijs, bij aantonen van uraatkristallen is de diagnose jicht zeker.
DECT en echografie zijn volgens de literatuur veelbelovend met sensitiviteit variërend van 52 % tot 100% en specificiteit is 41% tot 100% voor de DECT. Waarbij moet worden opgemerkt dat de DECT niet betrouwbaar is bij een symptoomduur van <2 jaar. De onderzoeken voor zowel echografie als DECT hebben echter een lage bewijslast aangezien het retrospectieve onderzoeken zijn en methodologisch niet optimaal uitgevoerd. Bij het verrichten van de echografie wordt geadviseerd om gericht op zoek te gaan naar een dubbelcontour (sensitiviteit 42 tot 92%, specificiteit 60 tot 100%) of een beeld van een tophus (sensitiviteit 28 tot 92%, specificiteit 100%). Als het mogelijk is, wordt een gerichte punctie (effusie of tophus) geadviseerd.
Echografische aanwezigheid van een tophus of dubbelcontour maakt de diagnose jicht respectievelijk zeer waarschijnlijk of waarschijnlijk. Afwijkingen bij de DECT maken de diagnose waarschijnlijk.
Overweeg de gout calculator van Janssens of de 2015 ACR/EULAR criteria indien kristalbewijs, klinische diagnose (aanwezigheid van tophus) of beeldvormend onderzoek (DECT/ echografie) niet mogelijk is (bijvoorbeeld bij anderhalvelijnszorg). Wees bewust dat het hier gaat om classificatie criteria. Aangezien beide methoden van diagnostiek niet gevalideerd zijn voor diagnosestelling in de 2de lijn is de zekerheidsgraad moeilijk in te schatten.
Onderbouwing
De diagnose jicht wordt gesteld door het aantonen van uraatkristallen in een punctaat van een gewricht of een tophus. De bijgewerkte EULAR 2018 aanbevelingen voor de diagnostiek van jicht adviseren om bij elke patiënt met verdenking jicht kristalbewijs te verkrijgen (Richette, 2020). In situaties waarin geen kristalbewijs kan worden verkregen, is men voor het stellen van de diagnose aangewezen op de klinische blik, diagnostische criteria of beeldvorming. De vraag is of kristalbewijs noodzakelijk is voor de diagnose, of dat de kliniek, diagnostische criteria en/of beeldvorming voldoende zijn voor de diagnose jicht. Kristalbewijs wordt beschouwd als de gouden standaard. Er is echter beperkte data beschikbaar over dit onderwerp. Sinds de totstandkoming van de vorige versie van deze richtlijn zijn er meerdere ontwikkelingen in beeldvormend onderzoek: echografie en DECT. De vraag is of dit plaats kan hebben in de diagnose stelling.
DECT vs. MSU crystals
|
Low GRADE |
… The sensitivity of DECT for gout diagnosis in patients with suspected gout, ranges from 52% to 100%, using MSU crystals as reference.
The specificity of DECT for gout diagnosis in patients with suspected gout, ranges from 41% to 100%, using MSU crystals as reference.
The positive predictive value of DECT for gout diagnosis in patients with suspected gout, ranges from 66% to 97%, using MSU crystals as reference.
The negative predictive value of DECT for gout diagnosis in patients with suspected gout, ranges from 27% to 93%, using MSU crystals as reference.
Source: Ahmad et al., 2016; Bongartz et al., 2015; Choi et al., 2012; Gamala, 2020; Glazebrook et al., 2011; Huppertz et al., 2014; Singh, 2021; Wang et al., 2018; Xie, 2021; Zou, 2021 |
DECT vs. classification criteria
|
Low GRADE |
… The sensitivity of DECT for gout diagnosis in patients with suspected gout, ranges from 75% to 100%, using the classification criteria as reference.
The specificity of DECT for gout diagnosis in patients with suspected gout, ranges from 71% to 100%, using the classification criteria as reference.
The positive predictive value of DECT for gout diagnosis in patients with suspected gout, ranges from 92% to 100%, using the classification criteria as reference.
The negative predictive value of DECT for gout diagnosis in patients with suspected gout, ranges from 37% to 100%, using the classification criteria as reference.
Source: Hu et al., 2014; Hu et al., 2015; Jia et al., 2018; Kiefer et al., 2016; Liu et al., 2010; Ren et al., 2015; ingh, 2021; Wu et al., 2014 |
Ultrasound vs. MSU crystals
|
Low GRADE |
…
The sensitivity of ultrasound for gout diagnosis in patients with suspected gout, ranges from 28% to 100%, using MSU crystals as reference.
The specificity of ultrasound for gout diagnosis in patients with suspected gout, ranges from 76% to 100%, using MSU crystals as reference.
The positive predictive value of ultrasound for gout diagnosis in patients with suspected gout, ranges from 88% to 97%, using MSU crystals as reference.
The negative predictive value of ultrasound for gout diagnosis in patients with suspected gout, ranges from 0% to 95%, using MSU crystals as reference.
Source: Das et al., 2016; Elsaman et al., 2016; Lamers-Karnebee et al., 2014; Naredo et al., 2014; Ogdie et al., 2017; Singh, 2021; Zou, 2021; Zufferey et al., 2015 |
Ultrasound vs. classification criteria
|
Very low GRADE |
…
Evidence is very uncertain about the diagnostic values of ultrasound for gout diagnosis in patients with suspected gout, using the classification criteria as reference.
The sensitivity of ultrasound for gout diagnosis in patients with suspected gout, ranges from 53% to 97%, using the classification criteria as reference.
The specificity of ultrasound for gout diagnosis in patients with suspected gout, ranges from 29% to 100%, using the classification criteria as reference.
The positive predictive value of ultrasound for gout diagnosis in patients with suspected gout, ranges from 56% to 100%, using the classification criteria as reference.
The negative predictive value of ultrasound for gout diagnosis in patients with suspected gout, ranges from 46% to 99%, using the classification criteria as reference.
Source: Di Matteo et al., 2018; Hu et al., 2014; Singh, 2021; Wang et al., 2018; Zhu et al., 2015 |
Ultrasound – double contour sign vs. MSU crystals
|
Very low GRADE |
… Evidence is very uncertain about the diagnostic values of ultrasound double contour sign (-DC) for gout diagnosis in patients with suspected gout, using MSU crystals as reference.
The sensitivity of ultrasound-DC for gout diagnosis in patients with suspected gout, ranges from 42% to 92%, using MSU crystals as reference.
The specificity of ultrasound-DC for gout diagnosis in patients with suspected gout, ranges from 60% to 100%, using MSU crystals as reference.
The positive predictive value of ultrasound-DC for gout diagnosis in patients with suspected gout, ranges from 56% to 100%, using MSU crystals as reference.
The negative predictive value of ultrasound-DC for gout diagnosis in patients with suspected gout, ranges from 46% to 99%, using MSU crystals as reference.
Source: Christiansen, 2021; Das et al., 2016; Elsaman et al., 2016; Lamers-Karnebee et al., 2014; Loffler et al., 2015; Naredo et al., 2014; Ogdie et al., 2017; Ottaviani et al., 2012; Pattamapaspong et al., 2017; Singh, 2021; Thiele et al., 2007 |
Ultrasound - tophus vs. MSU crystals
|
Very low GRADE |
… Evidence is very uncertain about the diagnostic values of ultrasound-tophus for gout diagnosis in patients with suspected gout, using MSU crystals as reference.
The sensitivity of ultrasound-tophus for gout diagnosis in patients with suspected gout, ranges from 28% to 92%, using MSU crystals as reference.
The specificity of ultrasound-tophus for gout diagnosis in patients with suspected gout, ranges from 80% to 100%, using MSU crystals as reference.
The positive predictive value of ultrasound-tophus for gout diagnosis in patients with suspected gout, ranges from 88% to 100%, using MSU crystals as reference.
The negative predictive value of ultrasound-tophus for gout diagnosis in patients with suspected gout, ranges from 35% to 92%, using MSU crystals as reference.
Source: Christiansen, 2021; Das et al., 2016; Elsaman et al., 2016; Lamers-Karnebee et al., 2014; Naredo et al., 2014; Ogdie et al., 2017; Ottaviani et al., 2012; Pattamapaspong et al., 2017; Singh, 2021; Thiele et al., 2007 |
Classification criteria vs. MSU crystals
|
Very low GRADE |
… Evidence is very uncertain about the diagnostic values of the classification criteria for gout diagnosis in patients with suspected gout, using MSU crystals as reference.
The sensitivity of the classification criteria for gout diagnosis in patients with suspected gout, was 63% (95%CI 48% to 76%), using MSU crystals as reference.
The specificity of the classification criteria for gout diagnosis in patients with suspected gout, was 79% (95%CI 63% to 90%) using MSU crystals as reference.
The positive predictive value of the classification criteria for gout diagnosis in patients with suspected gout, was 80% (95%CI 68% to 88%), using MSU crystals as reference.
The negative predictive value of the classification criteria for gout diagnosis in patients with suspected gout, was 61% (95%CI 52% to 70%), using MSU crystals as reference.
Source: Gamala, 2020 |
Description of studies
Description of systematic review
Shang (2022) performed a systematic review and meta-analysis to assess whether dual-energy computed tomography (DECT) is superior to ultrasound in the diagnosis of gout. A systematic literature research was performed of the databases PubMed, EMBASE, Cochrane and Web of Science. Studies needed to use DECT and/or US for diagnosis of gout and needed to report the number of true-positives, false-positives, false-negatives, and true-negatives. Studies that included patients with asymptomatic hyperuricemia were excluded from the review. A total of 28 cross-sectional (n = 12) or case-control studies (n = 16), either prospective or retrospective, with patients with suspected gout were included. It appeared that of the 3351 included patients, 1887 patients had gout and 1464 patients were control. Mean age in the total study population ranged from 48-65 years; 13 studies did not report (fully) on age. Of all included studies, 13 used only US for diagnosis (as intervention), four studies used both US and DECT for diagnosis and 11 studies used DECT for the diagnosis of gout. As reference standard, 16 studies used monosodium urate (MSU) crystals, ten studies used the American College of Rheumatology Guideline of 1977 (ACR1977), one study used both MSU and ACR1977 and one study used the guideline of the European Alliance of Associations for Rheumatology (EULAR) and ACR2015. Regarding quality assessment, most of the studies had a high risk of bias in patient selection, because of the case-control design.
Description of additional studies
Gamala (2020) performed a prospective cohort study to investigate the diagnostic performance of DECT compared with ACR-EULAR criteria in patients with suspected gout, using puncture for assessment of synovial fluid for the presence of monosodium urate crystals as reference standard.
Patients meeting the inclusion criteria were eligible for inclusion. If patients had a history of gout or were on uric acid lowering therapy, patients were excluded, see exclusion criteria. In total 89 patients were included. The prevalence of gout was 57% (51/89). The mean age was somewhat lower in the group with gout (60 vs. 64 years). The group with gout patients included more males (44/51 (86%) vs. 28/38 (74%)). The study is limited by the fact that only patients with mono/oligoarthritis were included.
Christiansen (2021) performed a cross-section cohort study to investigate the diagnostic performance of ultrasound (US) compared with the Fulfilment of classification in patients with suspected gout, using puncture for assessment of synovial fluid for the presence of monosodium urate crystals as reference standard.
Patients meeting the inclusion criteria were eligible for inclusion. If patients had a history of recent (<6 week) glucocorticoid injection or oral glucocorticoid, patients were excluded, see exclusion criteria. In total 82 patients were included. The prevalence of gout was 70% (57/82). The mean age was somewhat higher in the group with gout (62 vs. 58 years). The group with gout patients included more males (93% vs. 68%). The study is limited by the fact that US was performed by one assessor.
Singh (2021) performed a prospective cohort study to investigate the diagnostic performance of DECT and US compared with the ACR-EULAR criteria in patients with suspected gout, using puncture for assessment of synovial fluid for the presence of monosodium urate crystals as reference standard.
Patients meeting the inclusion criteria were eligible for inclusion. If patients were not able to undergo both US and DECT within the predefined time interval, patients were excluded, see exclusion criteria. In total 147 patients were included. The prevalence of gout was 89% (131/147). The mean age was 65 years, and 86% of all included patients were male. The study is limited by the fact that the gold standard was only performed in a small subset of 48 patients, relative long symptom duration, and the high prevalence.
Xie (2021) performed a prospective cohort study to investigate the diagnostic performance of DECT compared with the reference standard (i.e., puncture for assessment of synovial fluid for the presence of monosodium urate crystalsassessment for possible crystallization), in patients with (suspected) gout.
Patients meeting the inclusion criteria were eligible for inclusion. In total 121 patients were included. The prevalence of gout was 44% (53/121). The mean age was 54 years, and 52% of all included patients were male. The study is limited by the fact that some patients had a diagnose (based on ACR/EULAR criteria), and that it was a single centre study.
Zou (2021) performed a prospective cohort study to investigate the diagnostic performance of DECT and US compared with the reference standard (i.e., puncture for assessment of synovial fluid for the presence of monosodium urate crystalswith assessment for possible crystallization), in patients with (suspected) gout.
Patients meeting the inclusion criteria were eligible for inclusion. If gouty tophi were present, patients were excluded, see exclusion criteria. In total 50 patients were included. The prevalence of gout was 100% (50/50). The mean age was 55 years, and 98% of all included patients were male. The study is limited by the fact that all included patients had gout and the relative low sample size.
Results
Outcomes for diagnostic values are summarized per intervention (i.e., DECT and US) and outcome measure.
1. DECT
1.1 DECT vs. MSU crystals
In the systematic review of Shang (2022), six of the included studies reported outcomes regarding the diagnostic values of DECT using the presence of monosodium urate (MSU) crystals in synovial fluid as reference. Four of the five included additional studies reported this outcome as well. Results are descripted below. Due to heterogeneity in e.g., study population, and study design, outcomes were not pooled.
Sensitivity
The sensitivity ranges from 52% to 100% in all included studies, see Figure 1.
Specificity
The specificity ranges from 41% to 100% in all included studies, see Figure 1.
Figure 1. Overview of diagnostic values per study using DECT as index test and MSU crystals as reference.
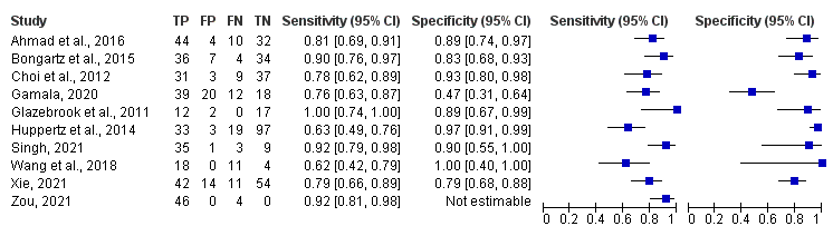
Studies with ‘et al.’ are from the systematic literature review of Shang (2022)
Positive predictive value
The positive predictive value (PPV) ranges from 66% to 97% in all included studies, see Table 1.
Negative predictive value
The negative predictive value (NPV) ranges from 27% to 93% in all included studies, see Table 1.
Table 1. Overview of positive – and negative predictive value per study using DECT as index test and MSU crystals as reference.
|
Study |
PPV |
lower |
upper |
NPV |
lower |
upper |
|
|
|
|
|
|
|
|
|
Ahmad et al., 2016 |
0,92 |
0,81 |
0,97 |
0,76 |
0,64 |
0,85 |
|
Bongartz et al., 2015 |
0,84 |
0,72 |
0,91 |
0,89 |
0,77 |
0,96 |
|
Choi et al., 2012 |
0,91 |
0,77 |
0,97 |
0,8 |
0,7 |
0,88 |
|
Gamala, 2020 |
0,66 |
0,58 |
0,73 |
0,64 |
0,53 |
0,74 |
|
Glazebrook et al., 2011 |
0,86 |
0,22 |
0,58 |
0,86 |
0,62 |
0,96 |
|
Huppertz et al., 2014 |
0,92 |
0,78 |
0,97 |
0,89 |
0,78 |
0,88 |
|
Singh, 2021 |
0,97 |
0,84 |
1 |
0,75 |
0,5 |
0,9 |
|
Wang et al., 2018 |
1 |
|
|
0,27 |
0,16 |
0,37 |
|
Xie, 2021 |
0,75 |
0,35 |
0,83 |
0,83 |
0,65 |
0,83 |
|
Zou, 2021 |
1 |
|
|
0 |
|
|
Studies with ‘et al.’ are from the systematic literature review of Shang (2022)
PPV= positive predictive value, NPV = negative predictive value, lower= lower limit of 95% CI, upper= upper limit of 95%CI.
1.2 DECT vs. classification criteria
In the systematic review of Shang (2022), seven of the included studies reported outcomes regarding the diagnostic values of DECT using ACR/EULAR criteria as reference. One of the five included additional studies reported this outcome as well. Results are descripted below. Due to heterogeneity in e.g., study population, and study design, outcomes were not pooled.
Sensitivity
The sensitivity ranges from 75% to 100% in all included studies, see Figure 2.
Specificity
The specificity ranges from 71% to 100% in all included studies, see Figure 2.
Figure 2. Overview of diagnostic values per study using DECT as index test and the classification criteria as reference.
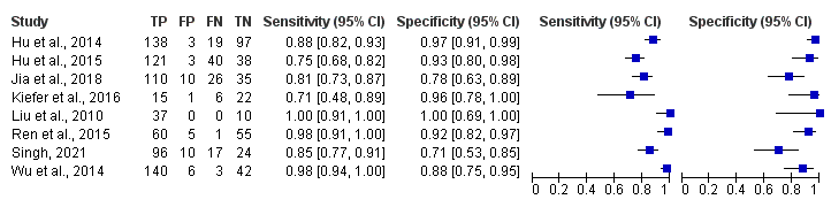
Studies with ‘et al.’ are from the systematic literature review of Shang (2022)
Positive predictive value
The PPV ranges from 92% to 100% in all included studies, see Table 2.
Negative predictive value
The NPV ranges from 37% to 100% in all included studies, see Table 2.
Table 2. Overview of positive – and negative predictive value per study using DECT as index test and the classification criteria as reference.
|
Study |
PPV |
lower |
upper |
NPV |
lower |
upper |
|
Hu et al., 2014 |
0,98 |
0,94 |
0,99 |
0,84 |
0,77 |
0,89 |
|
Hu et al., 2015 |
0,98 |
0,93 |
0,99 |
0,49 |
0,42 |
0,56 |
|
Jia et al., 2018 |
0,92 |
0,86 |
0,95 |
0,57 |
0,48 |
0,66 |
|
Kiefer et al., 2016 |
0,94 |
0,68 |
0,99 |
0,79 |
0,65 |
0,88 |
|
Liu et al., 2010 |
1 |
|
|
1 |
|
|
|
Ren et al., 2015 |
0,92 |
0,84 |
0,97 |
0,98 |
0,89 |
1 |
|
Singh, 2021 |
0,96 |
0,93 |
0,98 |
0,37 |
0,26 |
0,49 |
|
Wu et al., 2014 |
0,96 |
0,92 |
0,98 |
0,93 |
0,82 |
0,98 |
Studies with ‘et al.’ are from the systematic literature review of Shang (2022)
PPV= positive predictive value, NPV = negative predictive value, lower= lower limit of 95% CI, upper= upper limit of 95%CI.
2. Ultrasound
2.1 Ultrasound vs.MSU crystals
In the systematic review of Shang (2022), seven of the included studies reported outcomes regarding the diagnostic values of ultrasound (US) using the presence of MSU crystals (in synovial fluid) as reference. Two of the five included additional studies reported this outcome as well. Results are descripted below. Due to heterogeneity in e.g., study population, and study design, outcomes were not pooled.
Sensitivity
The sensitivity ranges from 28% to 100% in all included studies, see Figure 3.
Specificity
The specificity ranges from 76% to 100% in all included studies, see Figure 3.
Figure 3. Overview of diagnostic values per study using ultrasound as index test and MSU crystals as reference.
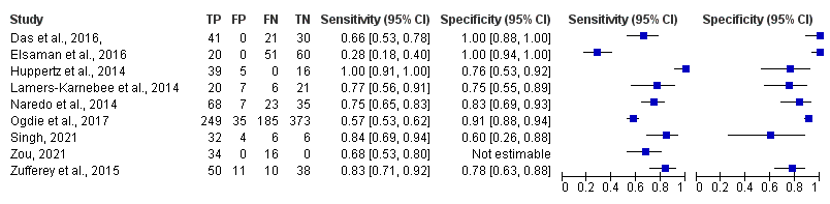
Studies with ‘et al.’ are from the systematic literature review of Shang (2022)
Positive predictive value
The positive predictive value (PPV) ranges from 88% to 100% in all included studies, see Table 3.
Negative predictive value
The negative predictive value (NPV) ranges from 0% to 95% in all included studies, see Table 3.
Table 3. Overview of positive – and negative predictive value per study using ultrasound as index test and MSU crystals as reference.
|
Study |
PPV |
lower |
upper |
NPV |
lower |
upper |
|
Das et al., 2016 |
1 |
1 |
|
0,59 |
0,5 |
0,67 |
|
Elsaman et al., 2016 |
1 |
|
|
0,54 |
0,5 |
0,58 |
|
Lamers-Karnebee et al., 2014 |
0,89 |
0,74 |
0,59 |
0,85 |
0,78 |
0,63 |
|
Naredo et al., 2014 |
0,93 |
0,91 |
0,83 |
0,95 |
0,6 |
0,51 |
|
Ogdie et al., 2017 |
0,94 |
0,88 |
0,84 |
0,91 |
0,67 |
0,64 |
|
Singh, 2021 |
0,88 |
0,89 |
0,78 |
0,95 |
0,5 |
0,29 |
|
Zou, 2021 |
1 |
|
|
0 |
|
|
|
Zufferey et al., 2015 |
0,88 |
0,82 |
0,73 |
0,89 |
0,79 |
0,68 |
Studies with ‘et al.’ are from the systematic literature review of Shang (2022)
PPV= positive predictive value, NPV = negative predictive value, lower= lower limit of 95% CI, upper= upper limit of 95%CI.
2.2 Ultrasound vs. classification criteria
In the systematic review of Shang (2022), four of the included studies reported outcomes regarding the diagnostic values of US using ACR/EULAR criteria as reference. One of the five included additional studies reported this outcome as well. Results are descripted below. Due to heterogeneity in e.g., study population, and study design, outcomes were not pooled.
Sensitivity
The sensitivity ranges from 53% to 97% in all included studies, see Figure 4.
Specificity
The specificity ranges from 29% to 100% in all included studies, see Figure 4.
Figure 4. Overview of diagnostic values per study using ultrasound as index test and the classification criteria as reference.
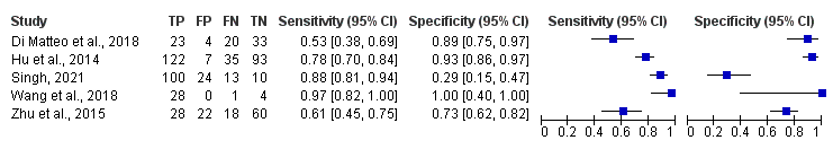
Studies with ‘et al.’ are from the systematic literature review of Shang (2022)
Positive predictive value
The positive predictive value (PPV) ranges from 56% to 100% in all included studies, see Table 4.
Negative predictive value
The negative predictive value (NPV) ranges from 24% to 80% in all included studies, see Table 4.
Table 4. Overview of positive – and negative predictive value per study using ultrasound as index test and the classification criteria as reference.
|
Study |
PPV |
lower |
upper |
NPV |
lower |
upper |
|
Di Matteo et al., 2018 |
0,85 |
0,69 |
94 |
0,62 |
0,54 |
0,7 |
|
Hu et al., 2014 |
0,95 |
0,89 |
0,97 |
0,73 |
0,66 |
0,78 |
|
Singh, 2021 |
0,91 |
0,89 |
0,93 |
0,24 |
0,13 |
0,4 |
|
Wang et al., 2018 |
1 |
|
|
0,8 |
0,35 |
0,96 |
|
Zhu et al., 2015 |
0,56 |
0,45 |
0,66 |
0,77 |
0,69 |
0,83 |
Studies with ‘et al.’ are from the systematic literature review of Shang (2022)
PPV= positive predictive value, NPV = negative predictive value, lower= lower limit of 95% CI, upper= upper limit of 95%CI.
2.3 Ultrasound – Double Contour sign vs. MSU crystals
In the systematic review of Shang (2022), nine of the included studies reported outcomes regarding the diagnostic values of US double contour sign using the presence of MSU crystals (in synovial fluid) as reference. Two of the five included additional studies reported this outcome as well. Results are descripted below. Due to heterogeneity in e.g., study population, and study design, outcomes were not pooled.
Sensitivity
The sensitivity ranges from 42% to 92% in all included studies, see Table 5.
Specificity
The specificity ranges from 60% to 100% in all included studies, see Table 5.
Positive predictive value
The positive predictive value (PPV) ranges from 56% to 100% in all included studies, see Table 5.
Negative predictive value
The negative predictive value (NPV) ranges from 46% to 99% in all included studies, see Table 5.
Table 5. Overview of sensitivity, specificity, positive – and negative predictive value per study using ultrasound double contour sign as index test, and MSU crystals as reference.
|
Study |
sensitivity |
- |
+ |
specificity |
- |
+ |
PPV |
- |
+ |
NPV |
- |
+ |
|
Christiansen, 2021 |
0,81 |
0,68 |
0,9 |
0,88 |
0,69 |
0,97 |
0,94 |
0,83 |
0,99 |
0,67 |
0,48 |
0,82 |
|
Das et al., 2016 |
0,66 |
0,53 |
1 |
1 |
0,88 |
1 |
1 |
|
|
0,59 |
0,5 |
0,67 |
|
Elsaman et al., 2016 |
0,42 |
0,61 |
0,55 |
0,98 |
0,91 |
1 |
0,97 |
0,81 |
1 |
0,59 |
0,54 |
0,63 |
|
Lamers-Karnebee et al., 2014 |
0,77 |
0,56 |
0,91 |
0,75 |
0,55 |
0,89 |
0,74 |
0,59 |
0,85 |
0,78 |
0,63 |
0,88 |
|
Loffler et al., 2015 |
0,88 |
0,78 |
0,94 |
0,64 |
0,56 |
0,72 |
0,56 |
0,5 |
0,62 |
0,91 |
0,84 |
0,78 |
|
Naredo et al., 2014 |
0,75 |
0,65 |
0,83 |
0,83 |
0,69 |
0,93 |
0,91 |
0,83 |
0,95 |
0,6 |
0,51 |
0,69 |
|
Ogdie et al., 2017 |
0,57 |
0,53 |
0,62 |
0,91 |
0,88 |
0,94 |
0,88 |
0,84 |
0,91 |
0,67 |
0,64 |
0,69 |
|
Ottaviani et al., 2012 |
0,77 |
0,64 |
0,88 |
0,98 |
0,89 |
1 |
0,98 |
0,85 |
1 |
0,8 |
0,71 |
0,87 |
|
Pattamapaspong et al., 2017 |
0,42 |
0,28 |
0,56 |
0,92 |
0,78 |
0,98 |
0,88 |
0,7 |
0,96 |
0,52 |
0,45 |
0,58 |
|
Singh, 2021 |
0,82 |
0,66 |
0,92 |
0,6 |
0,26 |
0,88 |
0,89 |
0,78 |
0,94 |
0,46 |
0,27 |
0,66 |
|
Thiele et al., 2007 |
0,92 |
0,78 |
0,98 |
1 |
0,89 |
1 |
1 |
|
|
0,92 |
0,79 |
0,97 |
Studies with ‘et al.’ are from the systematic literature review of Shang (2022)
- = lower limit of 95%CI, += upper limit of 95%CI
2.4 Ultrasound – tophus vs. MSU crystals
In the systematic review of Shang (2022), eighth of the included studies reported outcomes regarding the diagnostic values of US tophus using the presence of MSU crystals as reference. Two of the five included additional studies reported this outcome as well. Results are descripted below. Due to heterogeneity in e.g., study population, and study design, outcomes were not pooled.
Sensitivity
The sensitivity ranges from 28% to 92% in all included studies, see Figure 3.
Specificity
The specificity ranges from 80% to 100% in all included studies, see Table 6.
Positive predictive value
The positive predictive value (PPV) ranges from 88% to 100% in all included studies, see Table 6.
Negative predictive value
The negative predictive value (NPV) ranges from 35% to 92% in all included studies, see Table 6.
Table 6. Overview of sensitivity, specificity, positive – and negative predictive value per study using ultrasound tophus as index test, and MSU crystals as reference.
|
Study |
sensitivity |
- |
+ |
specificity |
- |
+ |
PPV |
- |
+ |
NPV |
- |
+ |
|
Christiansen, 2021 |
0,79 |
0,66 |
0,9 |
0,92 |
0,74 |
0,99 |
0,96 |
0,85 |
0,99 |
0,66 |
0,48 |
0,81 |
|
Das et al., 2016 |
0,66 |
0,53 |
1 |
1 |
0,88 |
1 |
1 |
|
|
0,59 |
0,5 |
0,67 |
|
Elsaman et al., 2016 |
0,66 |
0,53 |
0,78 |
1 |
0,88 |
1 |
1 |
|
|
0,59 |
0,5 |
0,67 |
|
Lamers-Karnebee et al., 2014 |
0,28 |
0,18 |
0,4 |
1 |
0,94 |
1 |
1 |
|
|
0,54 |
0,5 |
0,58 |
|
Naredo et al., 2014 |
0,75 |
0,65 |
0,83 |
0,83 |
0,69 |
0,93 |
0,91 |
0,83 |
0,95 |
0,6 |
0,51 |
0,69 |
|
Ogdie et al., 2017 |
0,57 |
0,53 |
0,62 |
0,91 |
0,88 |
0,94 |
0,88 |
0,84 |
0,91 |
0,67 |
0,64 |
0,69 |
|
Ottaviani et al., 2012 |
0,77 |
0,64 |
0,88 |
0,98 |
0,89 |
1 |
0,98 |
0,85 |
1 |
0,8 |
0,71 |
0,87 |
|
Pattamapaspong et al., 2017 |
0,42 |
0,28 |
0,56 |
0,92 |
0,78 |
0,98 |
0,88 |
0,7 |
0,96 |
0,52 |
0,45 |
0,58 |
|
Singh, 2021 |
0,61 |
0,43 |
0,76 |
0,8 |
0,44 |
0,97 |
0,9 |
0,76 |
0,98 |
0,35 |
0,24 |
0,47 |
|
Thiele et al., 2007 |
0,92 |
0,78 |
0,98 |
1 |
0,89 |
1 |
1 |
|
|
0,92 |
0,79 |
0,97 |
Studies with ‘et al.’ are from the systematic literature review of Shang (2022)
- = lower limit of 95%CI, += upper limit of 95%CI
3. Classification criteria vs. MSU crystals
In the systematic review of Shang (2022), none of the included studies reported outcomes regarding the diagnostic values of ACR/EULAR criteria, using MSU crystals as reference. One of the five included additional studies did reported this outcome. In total 32 patients were classified as true positive, 8 as false positive, 19 as false negative, and 30 as true negative, respectively.
Sensitivity
Gamala (2020) reported a sensitivity of 63% (95%CI 48% to 76%).
Specificity
Gamala (2020) reported a specificity of 79% (95%CI 63% to 90%).
Positive predictive value
Gamala (2020) reported a PPV of 80% (95%CI 68% to 88%).
Negative predictive value
Gamala (2020) reported a NPV of 61% (95%CI 52% to 70%).
Level of evidence of the literature
The level of evidence (GRADE method) is determined per comparison and diagnostic outcome measure and is based on results from diagnostic accuracy studies and therefore starts at level “high”. Subsequently, the level of evidence was downgraded if there were relevant shortcomings in one of the several GRADE domains: risk of bias, inconsistency, indirectness, imprecision, and publication bias.
1.1 DECT vs. MSU crystals
The level of evidence regarding the outcome measures sensitivity, specificity, positive predictive value, negative predictive value started as high, because results were from diagnostic accuracy studies. The level of evidence was downgraded by two levels because of risk of bias (i.e., study design and/or gold standard was not performed in all subjects; -1), and imprecision (wide 95%CI; -1). The level of evidence for the outcome ‘sensitivity, specificity, positive predictive value, negative predictive value’ is low.
1.2 DECT vs. classification criteria
The level of evidence regarding the outcome measures sensitivity, specificity, positive predictive value, negative predictive value started as high, because results were from diagnostic accuracy studies. The level of evidence was downgraded by two levels because of risk of bias (i.e., study design and/or gold standard was not performed in all subjects; -1), and imprecision (wide 95%CI; -1). The level of evidence for the outcome ‘sensitivity, specificity, positive predictive value, negative predictive value’ is low.
2.1 Ultrasound vs. MSU crystals
The level of evidence regarding the outcome measures sensitivity, specificity, positive predictive value, negative predictive value started as high, because results were from diagnostic accuracy studies. The level of evidence was downgraded by two levels because of risk of bias (i.e., study design and/or gold standard was not performed in all subjects; -1), and imprecision (wide 95%CI; -1). The level of evidence for the outcome ‘sensitivity, specificity, positive predictive value, negative predictive value’ is low.
2.2 Ultrasound vs. classification criteria
The level of evidence regarding the outcome measures sensitivity, specificity, positive predictive value, negative predictive value started as high, because results were from diagnostic accuracy studies. The level of evidence was downgraded by three levels because of risk of bias (i.e., study design and/or gold standard was not performed in all subjects; -1), inconsistency (-1), and imprecision (wide 95%CI; -1). The level of evidence for the outcome ‘sensitivity, specificity, positive predictive value, negative predictive value’ is very low.
2.3 Ultrasound – double contour sign vs. MSU crystals
The level of evidence regarding the outcome measures sensitivity, specificity, positive predictive value, negative predictive value started as high, because results were from diagnostic accuracy studies. The level of evidence was downgraded by three levels because of risk of bias (i.e., study design and/or gold standard was not performed in all subjects; -1), inconsistency (-1), and imprecision (wide 95%CI; -1). The level of evidence for the outcome ‘sensitivity, specificity, positive predictive value, negative predictive value’ is very low.
2.4 Ultrasound - tophus vs. MSU crystals
The level of evidence regarding the outcome measures sensitivity, specificity, positive predictive value, negative predictive value started as high, because results were from diagnostic accuracy studies. The level of evidence was downgraded by three levels because of risk of bias (i.e., study design and/or gold standard was not performed in all subjects; -1), inconsistency (-1), and imprecision (wide 95%CI; -1). The level of evidence for the outcome ‘sensitivity, specificity, positive predictive value, negative predictive value’ is very low.
3. Classification criteria vs. MSU crystals
The level of evidence regarding the outcome measures sensitivity, specificity, positive predictive value, negative predictive value started as high, because results were from diagnostic accuracy studies. The level of evidence was downgraded by three levels because of risk of bias (i.e., only one study was included in this analysis; -1), and imprecision (wide 95%CI, not meeting optimal information size; -2). The level of evidence for the outcome ‘sensitivity, specificity, positive predictive value, negative predictive value’ is very low.
A systematic review of the literature was performed to answer the following question:
What is the diagnostic value of performing imaging techniques (ultrasound or DECT) compared primarily to synovial MSU crystals, secondary compared to non-imaging standard (gout calculator (Janssens Jicht Calculator), ACR/gout criteria 2015) in patients with suspected gout?
P: patients with suspected gout
I: ultrasound or DECT
C: ACR/GOUT criteria or gout calculator (Hein Janssens)
R: Puncture for assessment of synovial fluid for the presence of monosodium urate crystals
O: diagnostic values (PPV, NPV, sensitivity, specificity), positive likelihood ratio, negative likelihood ratio
Relevant outcome measures
The guideline development group considered sensitivity, as a critical outcome measure for decision making; and specificity, PPV, NPV, as an important outcome measure for decision making. See Table 1 for an overview to elaborate consequences for patient.
The working group didn’t define a priori outcome measures, but used the definition as defined in the studies.
Table 1. Overview to elaborate consequences for patient.
|
Outcome |
Consequence |
Consequence relevant for patient |
Importance |
|
|
In case of doubt on diagnosis: DECT of echo |
|
|
|
|
|
TP |
Confirmation of diagnosis |
Start urate lowering treatment |
10 |
|
|
TN |
Ruling out diagnosis |
Continuing diagnostic proces |
8 |
|
|
FP |
Wrong diagnosis |
Unjust treatment |
9 |
|
|
FN |
Missing diagnosis |
Delayed start of treatment |
8 |
|
|
Inconclusive to interpret results |
Diagnosis remains unclear |
|
6 |
|
|
Burden of test |
low |
Non-invasive |
5 |
|
|
Seizure of resources (costs) |
Availability and cost of DECT/ultrasound |
Depends on remaining own risk |
5 |
|
|
TP= true positives, TN= true negatives, FP= false positives, FN= false negatives |
||||
Search and select (Methods)
The databases Medline (via OVID) and Embase (via Embase.com) were searched with relevant search terms from May 2011 until November 2022. The detailed search strategy is depicted under the tab Methods. The systematic literature search resulted in 367 hits. Studies were selected based on the following criteria: adult patients, articles in English, no animal research. Four systematic reviews were selected based on title and abstract. After reading the full text, the review with the most recent search date was included.
Thereafter, seven additional studies were initially selected based on title and abstract screening. After reading the full text, two studies were excluded (see the table with reasons for exclusion under the tab Methods), and five additional studies were included.
Results
One systematic review and five additional studies were included in the analysis of the literature. Important study characteristics and results are summarized in the evidence tables. The assessment of the risk of bias is summarized in the risk of bias tables.
- Christiansen SN, Østergaard M, Slot O, Fana V, Terslev L. Ultrasound for the diagnosis of gout-the value of gout lesions as defined by the Outcome Measures in Rheumatology ultrasound group. Rheumatology (Oxford). 2021 Jan 5;60(1):239-249. doi: 10.1093/rheumatology/keaa366. PMID: 32696059.
- Gamala M, Jacobs JWG, Linn-Rasker SF, Nix M, Heggelman BGF, Pasker-de Jong PCM, van Laar JM, Klaasen R. The performance of dual-energy CT in the classification criteria of gout: a prospective study in subjects with unclassified arthritis. Rheumatology (Oxford). 2020 Apr 1;59(4):845-851. doi: 10.1093/rheumatology/kez391. PMID: 31504985.
- Gamala M 2019, Clinical utility of dual energy CT in gout. 978-94-6380-592-6. Proefschrift Utrecht University, the Netherlands.
- Janssens HJ, Fransen J, van de Lisdonk EH, van Riel PL, van Weel C, Janssen M. A diagnostic rule for acute gouty arthritis in primary care without joint fluid analysis. Arch Intern Med. 2010 Jul 12;170(13):1120-6. doi: 10.1001/archinternmed.2010.196. PMID: 20625017.
- Jia E, Zhu J, Huang W, Chen X, Li J. Dual-energy computed tomography has limited diagnostic sensitivity for short-term gout. Clin Rheumatol. 2018 Mar;37(3):773-777. doi: 10.1007/s10067-017-3753-z. Epub 2017 Aug 12. PMID: 28803339; PMCID: PMC5835052.
- Kienhorst LB, Janssens HJ, Fransen J, Janssen M. The validation of a diagnostic rule for gout without joint fluid analysis: a prospective study. Rheumatology (Oxford). 2015 Apr;54(4):609-14. doi: 10.1093/rheumatology/keu378. Epub 2014 Sep 16. PMID: 25231179.
- Neogi T, Jansen TL, Dalbeth N, Fransen J, Schumacher HR, Berendsen D, Brown M, Choi H, Edwards NL, Janssens HJ, Lioté F, Naden RP, Nuki G, Ogdie A, Perez-Ruiz F, Saag K, Singh JA, Sundy JS, Tausche AK, Vazquez-Mellado J, Yarows SA, Taylor WJ. 2015 Gout Classification Criteria: an American College of Rheumatology/European League Against Rheumatism collaborative initiative. Arthritis Rheumatol. 2015 Oct;67(10):2557-68. doi: 10.1002/art.39254. Erratum in: Arthritis Rheumatol. 2016 Feb;68(2):515. Vaquez-Mellado, Janitzia [corrected to Vazquez-Mellado, Janitzia]. PMID: 26352873; PMCID: PMC4566153.
- Richette P, Doherty M, Pascual E, Barskova V, Becce F, Castaneda J, Coyfish M, Guillo S, Jansen T, Janssens H, Lioté F, Mallen CD, Nuki G, Perez-Ruiz F, Pimentao J, Punzi L, Pywell A, So AK, Tausche AK, Uhlig T, Zavada J, Zhang W, Tubach F, Bardin T. 2018 updated European League Against Rheumatism evidence-based recommendations for the diagnosis of gout. Ann Rheum Dis. 2020 Jan;79(1):31-38. doi: 10.1136/annrheumdis-2019-215315. Epub 2019 Jun 5. PMID: 31167758.
- Shang J, Zhou LP, Wang H, Liu B. Diagnostic Performance of Dual-energy CT Versus Ultrasonography in Gout: A Meta-analysis. Acad Radiol. 2022 Jan;29(1):56-68. doi: 10.1016/j.acra.2020.08.030. Epub 2020 Sep 23. PMID: 32980243.
- Singh JA, Budzik JF, Becce F, Pascart T. Dual-energy computed tomography vs ultrasound, alone or combined, for the diagnosis of gout: a prospective study of accuracy. Rheumatology (Oxford). 2021 Oct 2;60(10):4861-4867. doi: 10.1093/rheumatology/keaa923. PMID: 33410491.
- Xie Y, Li L, Luo R, Xu T, Yang L, Xu F, Lin H, Zhang G, Zhang X. Diagnostic efficacy of joint ultrasonography, dual-energy computed tomography and minimally invasive arthroscopy on knee gouty arthritis, a comparative study. Br J Radiol. 2021 May 1;94(1121):20200493. doi: 10.1259/bjr.20200493. Epub 2021 Apr 16. PMID: 33861155; PMCID: PMC8506185.
- Zou Z, Yang M, Wang Y, Zhang B. Gout of ankle and foot: DECT versus US for crystal detection. Clin Rheumatol. 2021 Apr;40(4):1533-1537. doi: 10.1007/s10067-020-05378-9. Epub 2020 Sep 3. PMID: 32880052.
Evidence table for systematic reviews
|
Study reference |
Study characteristics |
Patient characteristics |
Intervention (I) |
Comparison / control (C)
|
Follow-up |
Outcome measures and effect size |
Comments |
|||||||||||||||||||||||||||||||||||||||||||||||||||||||||||||||||||||||||||||||||||||||||||||||||||||||||||||||||||||||||||||||||||||||||||||||||||||||||||||||||||||||||||||||||||||||||||||||||||||||||||||||||||||||||||||||||||||||||||||||||||||||||||||||||||||||||||||||||||||||||
|
Shang, 2022
PS., study characteristics and results are extracted from the SR (unless stated otherwise) |
SR and meta-analysis of case-control and cross-sectional studies (both prospective and retrospective)
Literature search up to [month/year]
A: Di Matteo, 2019 B: Jia, 2018 C: Wang, 2018 D: Ogdie, 2017 E: Pattamapaspong, 2017 F: Ahmad, 2016 G: Das, 2016 H: Elsaman, 216 I: Kiefer, 2016 J: Loffler, 2015 K: Ren, 2015 L: Zhu, 2015 M: Zufferey, 2015 N: Hu, 2014 O: Huppertz, 2014 P: Lamers-Karnebee,2014 Q: Leng, 2014 R: Naredo, 2014 S: Wu, 2014 T: Choi, 2012 U: Ottaviani, 2012 V: Glazebrook, 2011 W: Liu, 2010 X: Filippucci, 209 Y: Thiele, 2007 Z: Nalbant, 2003 AA: Bongartz, 2015 AB: Hu, 2015
Study design: RCT [parallel / cross-over], cohort [prospective / retrospective], case-control
Setting and Country: China (n = 8), USA (n = 6), Germany (n = 4), India (n = 2), The Netherlands (n = 1), Thailand (n = 1), France (n = 1), Switzerland (n = 1), Spain (n = 1), Italy (n = 1)
Source of funding and conflicts of interest: Funding source not reported. No further conflicts of interest.
|
Inclusion criteria SR (spec. meta-analysis): Cross-sectional or case-control studies with patients with suspicious gout as study population, intervention: DECT (dual-energy computed tomography, comparison: US (ultrasound), studies needed when DECT and/or US were used for diagnosis of gout, n other technique. Studies needed to report the number of true-positives, false-positives, false-negatives, and true-negatives.
Exclusion criteria SR: Studies with in vitro anima design or patients with asymptomatic hyperuricemia,
28 studies included.
Important patient characteristics at baseline:
Baseline characteristics are not reported for substantial number of studies. Patients with and without gout have largely the same age and gender ratio.
|
A: US B: DECT C: DECT/US D: US E: US F: DECT G: US H: US I: DECT J: DECT K: DECT L: DECT/US M: US N: DECT/US O: DECT/US P: US Q: US R: US S: DECT T: DECT U: US V: DECT W: DECT X: US Y: US Z: US AA: DECT AB: DECT |
A: EULAR/ACR 2015 B: ACR 1977 C: MSU D: MSU E: MSU F: ACR 1977/MSU G: MSU H: MSU I: ACR 1977 J: MSU K: ACR 1977 L: ACR 1977 M: MSU N: ACR 1977 O: MSU P: MSU Q: ACR 1977 R: MSU S: ACR 1977 T: MSU U: MSU V: MSU W: ACR 1977 X: ACR 1977 Y: MSU Z: MSU AA: MSU AB: ASR 1977 |
Endpoint of follow-up: Not reported
For how many participants were no complete outcome data available? (intervention/control) Not reported
|
Outcome measures: Sensitivity (95%CI), specificity (95%CI), positive likelihood ratio (95%CI), negative likelihoodratio (95%CI)
DECT
US (double contour sign (DCS))
US (tophus)
US (overall consideration)
Positive likelihood ratio DECT: 10.10 [7.39-13.82] US (double contour sign): 12.84 [5.45-30.23] US (tophus): 55.97 [4.60-681.75] US (overall signs): 5.35 [3.79-7.54]
Negative likelihood ratio DECT: 0.12 [0.07-0.22] US (double contour sign): 0.32 [0.22-0.45] US (tophus): 0.44 [0.28-0.67] U (overall signs): 0.19 [0.11-0.33] |
Facultative:
Conclusion of the author: DECT and US show promising accuracy for the diagnosis of gout. ECT has a higher specificity and sensitivity compared to US (overall consideration), although specific DCS and tophus in US performed better than DECT in terms of specificity.
Personal remarks: Study of Wang (2018) included only four controls. Values for I2 are quite high. |
Evidence table for diagnostic test accuracy studies
|
Study reference |
Study characteristics |
Patient characteristics
|
Index test (test of interest) |
Reference test
|
Follow-up |
Outcome measures and effect size |
Comments |
||||||||||||||||||||||||||||||||||||||||||||||||||||||||||||||||||
|
Gamala, 2020 |
Type of study1: Prospective cohort study
Setting and country: Hospital, the Netherlands
Funding and conflicts of interest: None.
|
Inclusion criteria: age >18 years, who presented to the Rheumatology outpatient clinic of Meander Medical Center, Amersfoort, the Netherlands because of mono- or oligoarthritis (one to three swollen joints) with an indication for joint fluid aspiration
Exclusion criteria: MSU proven gout in history or on uric acid lowering therapy
N= 89
Prevalence: 51/89= 57%
Mean age ± SD:
Sex:
Other important characteristics:
|
Describe index test: DECT
Cut-off point(s): Positive or negative, see details article
Comparator test2: ACR-EULAR criteria
Cut-off point(s): Positive or negative, see details article
|
Describe reference test3: MSU crystals in synovial fluid
Cut-off point(s): Positive or negative, see details article
|
Time between the index test en reference test: Not mentioned; only the flow is mentioned 1. EULAR/ACR 3. DECT (assessor blinded)
For how many participants were no complete outcome data available? N (%) none
Reasons for incomplete outcome data described? n.a. |
Outcome measures and effect size (include 95%CI and p-value if available):
Characteristics of DECT; SF as reference
Sensitivity:
Specificity 0.47 (0.31, 0.64)
PPV 0.66 (0.58, 0.73)
NPV 0.60 (0.45, 0.73)
AUC 0.64 (0.53, 0.74)
The performance of the 2015 EULAR/ACR gout classification criteria subsets without and with DECT
AUC1: 0.68 Difference (95%CI): 0.01 (-0.06 to 0.05) |
Limitations: - only patients with mono/oligoarthritis
Overview of classification in figure 2. |
||||||||||||||||||||||||||||||||||||||||||||||||||||||||||||||||||
|
Christiansen, 2021 |
Type of study: Cross-section cohort study.
Setting and country: Hospital, Denmark
Funding and conflicts of interest: The work was supported by research grants from the Danish Rheumatism Association. |
Inclusion criteria: adult patients (>18 years) referred from primary care or other hospital departments with clinical suspicion of gout.
Exclusion criteria: recent (<6 weeks) glucocorticoid injection or oral glucocorticoid.
N= 82
Prevalence: 57/82= 70%
Mean age ± SD:
Sex: +: 93% M -: 68% M
Other important characteristics: n.a.
|
Describe index test: Ultrasound examination
Cut-off point(s): Positive or negative, see details in article.
Comparator test: Fulfilment of classification criteria
Cut-off point(s): Positive or negative, see details in article.
|
Describe reference test: Microscopy for MSU crystals
Cut-off point(s): Positive or negative, see details in article.
|
Time between the index test en reference test: Ultrasound before microscopy findings > assessors also blinded.
For how many participants were no complete outcome data available? None. N (%)
Reasons for incomplete outcome data described? n.a. |
Outcome measures and effect size (include 95%CI and p-value if available):
US findings with MSU
Double contour Sensi 0.81 (0.68 to 0.90) Spec 0.88 (0.69 to 0.97) PPV 0.94 (0.83 to 0.99) NPV 0.67 (0.48 to 0.82)
Tophi Sensi 0.79 Spec 0.92 PPV 0.96 NPV 0.66
US findings with ACR/EULAR
Double contour Sensi 0.80 Spec 0.95 PPV 0.98 NPV 0.64
Tophi Sensi 0.77 Spec 0.95 PPV 0.98 NPV 0.60
|
Ultrasound assessment performed by one assessor. |
||||||||||||||||||||||||||||||||||||||||||||||||||||||||||||||||||
|
Singh, 2021 |
Type of study: prospective cohort study
Setting and country: Hospital, USA
Funding and conflicts of interest: This material is the result of work supported by research funds from the Division of Rheumatology at the University of Alabama at Birmingham and the resources and use of facilities at the Birmingham VA Medical Center, Birmingham, Alabama, USA. The funding body did not play any role in design, in the collection, analysis, and interpretation of data; in the writing of the manuscript; and in the decision to submit the manuscript for publication. The views expressed in this article are those of the authors and do not necessarily reflect the position or policy of the Department of Veterans Affairs or the United States government. |
Inclusion criteria: Not clearly mentioned, patients from the CRYSTALILLE inception Cohort.
Exclusion criteria: inability to undergo both DECT and ultrasound scans within the predefined 1-week time interval
N= 147
Prevalence: 131/147 (89%)
Mean age ± SD: 64.7 (14.3)
Sex: 86% M /14 % F
Other important characteristics: mean symptom duration of 9.2 (9.9) years; 38 (26%) patients had a disease duration <2 years
|
Describe index test: DECT Ultrasound
Cut-off point(s): Positive or negative, see details in article.
Comparator test: ACR-EULAR classification
Cut-off point(s): Positive or negative, see details in article. |
Describe reference test: MSU crystals * only 48 patients
Cut-off point(s): Positive or negative, see details in article. |
Time between the index test en reference test: Within 1 week.
For how many participants were no complete outcome data available? N 99 (67%)
Reasons for incomplete outcome data described? Gold standard not in all patients performed |
Outcome measures and effect size (include 95%CI and p-value if available):
|
Limitations: High prevalence Relative long symptom/disease duration
Relative small sample size.
Gold standard performed in subset. |
||||||||||||||||||||||||||||||||||||||||||||||||||||||||||||||||||
|
Zou, 2021 |
Type of study4: Retrospective cohort study
Setting and country: Hospital, China
Funding and conflicts of interest: This study was partly supported by the grants from the National Science Foundation of Zhejiang (LY19H100002) and 2019 Jiaxing Key Supporting Discipline of Medicine Rheumatology and Autoimmunology (2019-ZC-03). |
Inclusion criteria: patients were diagnosed with gout according to the 1977 American College of Rheumatology standards for the classification of gout [11] with concomitant acute arthritis attacks of the ankle or foot at the time of the clinic visit.
Exclusion criteria: gouty tophi
N= 50
Prevalence: 100%
Mean age ± SD:
Sex: Other important characteristics:
|
Describe index test: DECT Ultrasound
Cut-off point(s): Positive or negative, see details article
Comparator test5: Not reported
Cut-off point(s): x
|
Describe reference test6: MSU crystals in synovial fluid
Cut-off point(s): Positive or negative, see details article
|
Time between the index test en reference test: Within 1 week.
For how many participants were no complete outcome data available? N (%) none
Reasons for incomplete outcome data described? n.a. |
Outcome measures and effect size (include 95%CI and p-value if available):
Characteristics of ultasound; SF as reference
Sensitivity:
Specificity x
PPV 100
NPV x
Characteristics of DECT; SF as reference
Sensitivity:
Specificity x
PPV 100
NPV x
|
Limitations: - only patients with diagnose gout. - small sample size. |
||||||||||||||||||||||||||||||||||||||||||||||||||||||||||||||||||
|
Xie, 2021 |
Type of study7: Cohort study
Setting and country: Hospital, China
Funding and conflicts of interest: Not mentioned.
|
Inclusion criteria: Patients with indications for minimally invasive arthroscopy and underwent pre-operative ultrasonography and DECT assessment for knee MSU deposition. Patients with articular effusion received joint puncture to collect joint fluid for polarized light microscopy examination. All patients received minimally invasive arthroscopy to observe the distribution of MSU deposition in the joint cavity, and tissue samples were collected for pathological examination.
Exclusion criteria: Not mentioned.
N= 121
Prevalence: 44%
Mean age ± SD:
Sex: Other important characteristics:
|
Describe index test: DECT
Cut-off point(s): Positive or negative, see details article
Comparator test8: Not reported
Cut-off point(s): x
|
Describe reference test9: MSU crystals in synovial fluid
Cut-off point(s): Positive or negative, see details article
|
Time between the index test en reference test: Not
For how many participants were no complete outcome data available? N (%) none
Reasons for incomplete outcome data described? n.a. |
Outcome measures and effect size (include 95%CI and p-value if available):
Characteristics of DECT; SF as reference
Sensitivity:
Specificity 88.24
|
Limitations: - diagnose by ACR/EULAR before imaging. - relative small sample size - single centre.
|
||||||||||||||||||||||||||||||||||||||||||||||||||||||||||||||||||
1 In geval van een case-control design moeten de patiëntkarakteristieken per groep (cases en controls) worden uitgewerkt. NB; case control studies zullen de accuratesse overschatten (Lijmer et al., 1999)
2 Comparator test is vergelijkbaar met de C uit de PICO van een interventievraag. Er kunnen ook meerdere tests worden vergeleken. Voeg die toe als comparator test 2 etc. Let op: de comparator test kan nooit de referentiestandaard zijn.
3 De referentiestandaard is de test waarmee definitief wordt aangetoond of iemand al dan niet ziek is. Idealiter is de referentiestandaard de Gouden standaard (100% sensitief en 100% specifiek). Let op! dit is niet de “comparison test/index 2”.
4 In geval van een case-control design moeten de patiëntkarakteristieken per groep (cases en controls) worden uitgewerkt. NB; case control studies zullen de accuratesse overschatten (Lijmer et al., 1999)
5 Comparator test is vergelijkbaar met de C uit de PICO van een interventievraag. Er kunnen ook meerdere tests worden vergeleken. Voeg die toe als comparator test 2 etc. Let op: de comparator test kan nooit de referentiestandaard zijn.
6 De referentiestandaard is de test waarmee definitief wordt aangetoond of iemand al dan niet ziek is. Idealiter is de referentiestandaard de Gouden standaard (100% sensitief en 100% specifiek). Let op! dit is niet de “comparison test/index 2”.
7 In geval van een case-control design moeten de patiëntkarakteristieken per groep (cases en controls) worden uitgewerkt. NB; case control studies zullen de accuratesse overschatten (Lijmer et al., 1999)
8 Comparator test is vergelijkbaar met de C uit de PICO van een interventievraag. Er kunnen ook meerdere tests worden vergeleken. Voeg die toe als comparator test 2 etc. Let op: de comparator test kan nooit de referentiestandaard zijn.
9 De referentiestandaard is de test waarmee definitief wordt aangetoond of iemand al dan niet ziek is. Idealiter is de referentiestandaard de Gouden standaard (100% sensitief en 100% specifiek). Let op! dit is niet de “comparison test/index 2”.
Risk of bias assessment for systematic reviews
Table of quality assessment for systematic reviews of RCTs and observational studies
|
Study
First author, year |
Appropriate and clearly focused question?
Yes/no/unclear |
Comprehensive and systematic literature search?
Yes/no/unclear |
Description of included and excluded studies?
Yes/no/unclear |
Description of relevant characteristics of included studies?
Yes/no/unclear |
Appropriate adjustment for potential confounders in observational studies?
Yes/no/unclear/not applicable |
Assessment of scientific quality of included studies?
Yes/no/unclear |
Enough similarities between studies to make combining them reasonable?
Yes/no/unclear |
Potential risk of publication bias taken into account?
Yes/no/unclear |
Potential conflicts of interest reported?
Yes/no/unclear |
|
Shang, 2022 |
Yes, the aim of the study is clearly explained. |
Yes, search strategy is well explained with clear description of used databases and key words. |
Yes, flow diagram of number of included and excluded studies is reported. |
Yes, the SR reports number of gout patient and control, age, and gender amongst others. |
Unclear, study does not report whether adjustment for potential confounders was performed. |
Yes, with use of Quality Assessment of Diagnostic Accuracy Studies-2 tool |
Yes, although type of scanned joints differs widely among studies. |
Yes, with use of Deek’s test. No significant publication bias was found. |
Yes, none of the authors had any conflict of interest. |
Risk of bias assessment diagnostic accuracy studies (QUADAS II, 2011)
|
Study reference |
Patient selection
|
Index test |
Reference standard |
Flow and timing |
Comments with respect to applicability |
|
Gamala, 2020 |
Was a consecutive or random sample of patients enrolled? Yes
Was a case-control design avoided? Yes
Did the study avoid inappropriate exclusions? Yes
|
Were the index test results interpreted without knowledge of the results of the reference standard? Yes, blinded
If a threshold was used, was it pre-specified? Yes, positive/negative
|
Is the reference standard likely to correctly classify the target condition? Yes
Were the reference standard results interpreted without knowledge of the results of the index test? Yes
|
Was there an appropriate interval between index test(s) and reference standard? Unclear
Did all patients receive a reference standard? Yes
Did patients receive the same reference standard? Yes
Were all patients included in the analysis? Yes
|
Are there concerns that the included patients do not match the review question? No
Are there concerns that the index test, its conduct, or interpretation differ from the review question? No
Are there concerns that the target condition as defined by the reference standard does not match the review question? No |
|
CONCLUSION: Could the selection of patients have introduced bias?
RISK: LOW |
CONCLUSION: Could the conduct or interpretation of the index test have introduced bias?
RISK: LOW |
CONCLUSION: Could the reference standard, its conduct, or its interpretation have introduced bias?
RISK: LOW |
CONCLUSION Could the patient flow have introduced bias?
RISK: LOW |
|
|
|
Christiansen, 2021 |
Was a consecutive or random sample of patients enrolled? Yes
Was a case-control design avoided? Yes
Did the study avoid inappropriate exclusions? Yes
|
Were the index test results interpreted without knowledge of the results of the reference standard? Yes
If a threshold was used, was it pre-specified? Yes
|
Is the reference standard likely to correctly classify the target condition? Yes
Were the reference standard results interpreted without knowledge of the results of the index test? Yes
|
Was there an appropriate interval between index test(s) and reference standard? Yes
Did all patients receive a reference standard? Yes
Did patients receive the same reference standard? Yes
Were all patients included in the analysis? Yes |
Are there concerns that the included patients do not match the review question? No
Are there concerns that the index test, its conduct, or interpretation differ from the review question? No
Are there concerns that the target condition as defined by the reference standard does not match the review question? No |
|
|
CONCLUSION: Could the selection of patients have introduced bias?
RISK: LOW |
CONCLUSION: Could the conduct or interpretation of the index test have introduced bias?
RISK: LOW |
CONCLUSION: Could the reference standard, its conduct, or its interpretation have introduced bias?
RISK: LOW |
CONCLUSION Could the patient flow have introduced bias?
RISK: LOW |
|
|
Singh, 2021 |
Was a consecutive or random sample of patients enrolled? Yes
Was a case-control design avoided? Yes
Did the study avoid inappropriate exclusions? Yes
|
Were the index test results interpreted without knowledge of the results of the reference standard? Yes, blinded
If a threshold was used, was it pre-specified? Yes, positive/negative
|
Is the reference standard likely to correctly classify the target condition? Yes
Were the reference standard results interpreted without knowledge of the results of the index test? Yes
|
Was there an appropriate interval between index test(s) and reference standard? Yes
Did all patients receive a reference standard? no
Did patients receive the same reference standard? Yes
Were all patients included in the analysis? No
|
Are there concerns that the included patients do not match the review question? No
Are there concerns that the index test, its conduct, or interpretation differ from the review question? No
Are there concerns that the target condition as defined by the reference standard does not match the review question? Yes
|
|
|
CONCLUSION: Could the selection of patients have introduced bias?
RISK: LOW |
CONCLUSION: Could the conduct or interpretation of the index test have introduced bias?
RISK: LOW
|
CONCLUSION: Could the reference standard, its conduct, or its interpretation have introduced bias?
RISK: LOW |
CONCLUSION Could the patient flow have introduced bias?
RISK: HIGH |
|
|
Zou, 2020 |
Was a consecutive or random sample of patients enrolled? No
Was a case-control design avoided? Yes
Did the study avoid inappropriate exclusions? No
|
Were the index test results interpreted without knowledge of the results of the reference standard? Yes
If a threshold was used, was it pre-specified? Yes
|
Is the reference standard likely to correctly classify the target condition? Yes
Were the reference standard results interpreted without knowledge of the results of the index test? Yes
|
Was there an appropriate interval between index test(s) and reference standard? Yes
Did all patients receive a reference standard? Yes Did patients receive the same reference standard? Yes
Were all patients included in the analysis? Unclear
|
Are there concerns that the included patients do not match the review question? Yes
Are there concerns that the index test, its conduct, or interpretation differ from the review question? No
Are there concerns that the target condition as defined by the reference standard does not match the review question? No |
|
|
CONCLUSION: Could the selection of patients have introduced bias?
RISK: HIGH |
CONCLUSION: Could the conduct or interpretation of the index test have introduced bias?
RISK: LOW
|
CONCLUSION: Could the reference standard, its conduct, or its interpretation have introduced bias?
RISK: LOW |
CONCLUSION Could the patient flow have introduced bias?
RISK: HIGH |
|
|
Xie, 2021 |
Was a consecutive or random sample of patients enrolled? Yes
Was a case-control design avoided? Yes
Did the study avoid inappropriate exclusions? No
|
Were the index test results interpreted without knowledge of the results of the reference standard? Yes
If a threshold was used, was it pre-specified? Yes
|
Is the reference standard likely to correctly classify the target condition? Yes
Were the reference standard results interpreted without knowledge of the results of the index test? Yes
|
Was there an appropriate interval between index test(s) and reference standard? No
Did all patients receive a reference standard? Yes Did patients receive the same reference standard? Yes
Were all patients included in the analysis? Yes
|
Are there concerns that the included patients do not match the review question? Yes
Are there concerns that the index test, its conduct, or interpretation differ from the review question? No
Are there concerns that the target condition as defined by the reference standard does not match the review question? No |
|
|
CONCLUSION: Could the selection of patients have introduced bias?
RISK: Some |
CONCLUSION: Could the conduct or interpretation of the index test have introduced bias?
RISK: LOW
|
CONCLUSION: Could the reference standard, its conduct, or its interpretation have introduced bias?
RISK: LOW |
CONCLUSION Could the patient flow have introduced bias?
RISK: Some |
|
Table of excluded studies
|
Reference |
Reason for exclusion |
|
Sotniczuk M, Nowakowska-Płaza A, Wroński J, Wisłowska M, Sudoł-Szopińska I. The Clinical Utility of Dual-Energy Computed Tomography in the Diagnosis of Gout-A Cross-Sectional Study. J Clin Med. 2022 Sep 5;11(17):5249. doi: 10.3390/jcm11175249. PMID: 36079179; PMCID: PMC9457243. |
Wrong gold standard. |
|
Huang Z, Li Z, Xiao J, Xie Y, Hu Y, Zhang S, Wang X. Dual-energy Computed Tomography for the Diagnosis of Acute Gouty Arthritis. Curr Med Imaging. 2022;18(3):305-311. doi: 10.2174/1573405617666210707164124. PMID: 34238168. |
Wrong gold standard. |
Beoordelingsdatum en geldigheid
Publicatiedatum : 19-09-2024
Beoordeeld op geldigheid : 16-09-2024
Algemene gegevens
De ontwikkeling van deze richtlijnmodule werd ondersteund door het Kennisinstituut van de Federatie Medisch Specialisten (www.demedischspecialist.nl/kennisinstituut) en werd gefinancierd uit de Kwaliteitsgelden Medisch Specialisten (SKMS).
Samenstelling werkgroep
Voor het ontwikkelen van de richtlijnmodule is in 2022 een multidisciplinaire werkgroep ingesteld, bestaande uit vertegenwoordigers van alle relevante specialismen die betrokken zijn bij de zorg voor patiënten met jicht in de tweede lijn.
Werkgroep
- Dr. C.M.P.G. van Durme (voorzitter), reumatoloog, werkzaam in Maastricht Universitair Medische Centrum, NVR.
- Dr. M. Gerritsen (vicevoorzitter), reumatoloog, werkzaam in Reade, NVR.
- Prof Dr. B.J.F. van den Bemt, apotheker/klinisch farmacoloog, werkzaam in Sint Maartenskliniek/Radboud Universitair Medisch Centrum, NVZA.
- A.C.M.J. van Berkel -de Kort, verpleegkundig specialist AGZ, expertisegebied reumatologie (MANP), V&VN.
- Prof. Dr. J.H. Cornel, cardioloog, werkzaam in Radboud Universitair Medisch Centrum, NVVC.
- Dr. M. Flendrie, reumatoloog, werkzaam in Sint Maartenskliniek, NVR.
- Dr. T.L. Jansen, reumatoloog, werkzaam in VieCuri, NVR.
- Drs. A. de Jong, reumatoloog, werkzaam in Sykehuset Levanger (Noorwegen; sinds juli 2023), NVR.
- Drs. S.C. Mooij, reumatoloog, werkzaam in Medisch Spectrum Twente, NVR.
- Dr. L.G. Schipper, reumatoloog, werkzaam in Elisabeth-TweeSteden Ziekenhuis, NVR.
- Drs. G. Willemsen-de Mey, patiëntvertegenwoordiger, Nationale Vereniging ReumaZorg Nederland.
Klankbordgroep
- M. van Teeffelen-Lourens, verpleegkundig specialist, Ziekenhuis Rivierenland, V&VN.
Met ondersteuning van
- J.M.H. van der Hart MSc, junior adviseur, Kennisinstituut van de Federatie Medische Specialisten.
- Dr. B.H. Stegeman, senior adviseur, Kennisinstituut van de Federatie Medische Specialisten.
- Dr. M.M.A. Verhoeven, adviseur, Kennisinstituut van de Federatie Medisch Specialisten.
Belangenverklaringen
De Code ter voorkoming van oneigenlijke beïnvloeding door belangenverstrengeling is gevolgd. Alle werkgroepleden hebben schriftelijk verklaard of zij in de laatste drie jaar directe financiële belangen (betrekking bij een commercieel bedrijf, persoonlijke financiële belangen, onderzoeksfinanciering) of indirecte belangen (persoonlijke relaties, reputatiemanagement) hebben gehad. Gedurende de ontwikkeling of herziening van een module worden wijzigingen in belangen aan de voorzitter doorgegeven. De belangenverklaring wordt opnieuw bevestigd tijdens de commentaarfase.
Een overzicht van de belangen van werkgroepleden en het oordeel over het omgaan met eventuele belangen vindt u in onderstaande tabel. De ondertekende belangenverklaringen zijn op te vragen bij het secretariaat van het Kennisinstituut van de Federatie Medisch Specialisten.
|
Werkgroeplid |
Functie |
Nevenfuncties |
Gemelde belangen |
Ondernomen actie |
|
Dr. C.M.P.G. van Durme (voorzitter), NVR |
Reumatoloog |
Reumatoloog bij de Centre Hospitalier Chretien, België (betaald)
|
"GO test trial, subinvestigator (gesubsidieerd door overheid) GO-test trial is een strategietrial (geen medicatie) ATTACG trial, subinvestigator (tweede geldstroom) Start deelname aan studie Rasburicase for severe gout in de komende maanden (nu nog niet gestart), lokale onderzoeker (donatie middel gesponsord door Sanofi)" |
Geen |
|
Dr. M. Gerritsen (vice-voorzitter), NVR |
Reumatoloog |
|
werkt mee aan studie waarbij medicatie wordt vergoed door farmaceut. Het betreft sponsering door Horizon Therapeutics. Dat is de fabrikant van pegloticase maar dat kan niet in Europa worden voorgeschreven. Bij dit onderzoek naar effect van urinezuurverlaging op Netosis ben ik de hoofdonderzoeker. Als Reade gaan we nog deelnemen aan dapansutile (een nieuwe orale IL-1 blokker) fase 2 studie van Olatec waarvoor we patienten aanleveren. ik ben lokaal de onderzoeker: ZonMW (Overture jichtstudie naar T2T vs T2S); |
Geen |
|
Prof Dr. B.J.F. van den Bemt, NVZA |
Apotheker en klinisch farmacoloog |
- |
- |
Geen |
|
Verpleegkundig specialist AGZ, expertisegebied reumatologie |
Bestuur NHPR Bestuur Verpleegkundig specialisten Scholingscommissie VS RMT Nederland Lid werkgroep voetzorg NHPR |
werkt mee aan de GO TEST overture trial |
Geen |
|
|
Prof. Dr. J.H. Cornel, NVVC |
Cardioloog |
- |
Lodoco 2; gefinancieerd door overheid; bezig multicentrum trial op te zetten |
Geen |
|
Dr. M. Flendrie, NVR |
Reumatoloog |
NVR werkgroepen eHealth, jicht, taakherschikking; allen onbetaald |
"1. GO TEST FINALE - GOut TrEatment STrategy (GO TEST) FINALE study, a multicentre pragmatic randomized superiority trial of continuation versus cessation of urate lowering therapies in gout in remission. (gesubsidieerd door overheid) 2. Beliefs of general practitioners and rheumatologists on urate lowering therapy, and their effect on the quality of gout care. De tweede studie is een aparte studie die gesponsord is door Grünenthal B.V d.m.v. een unrestricted grant aan de Sint Maartenskliniek. De studie onderzocht de beliefs/attitude van artsen (huisartsen en reumatologen) ten opzichte van jicht medicatie via een gevalideerde vragenlijst en bekeek op dit effect had op medicatie dosering, ziekte uitkomsten en beliefs van patiënten. De studie is reeds afgesloten en wordt op dit moment opgeschreven. Contextueel: Het bedrijf Grünenthal B.V zou enkele jaren terug een jicht medicijn op de markt gaan brengen in Europa (Lesinurad), maar dit is niet doorgegaan." |
Geen |
|
Dr. T.L. Jansen, NVR |
Reumatoloog |
onbezoldigd adviseur Olatec co-editor Clinical Rheumatology |
ZonMW (Overture jichtstudie naar T2T vs T2S); Reuma Nederland |
Geen |
|
Drs. A.H. de Jong, NVR |
Reumatoloog vanaf juli 2023 AIOS reumatologie t/m juni 2023 |
- |
- |
Geen |
|
Drs. S.C. Mooij, NVR |
Reumatoloog |
- |
- |
Geen |
|
Dr. L.G. Schipper, NVR |
Reumatoloog |
- |
GO TEST trial |
Geen |
|
Drs. G. Willemsen-de Mey, ReumaZorg Nederland |
Patiëntvertegenwoordiger |
- |
- |
Geen |
Inbreng patiëntenperspectief
Er werd aandacht besteed aan het patiëntenperspectief door een afgevaardigde van de patiëntenvereniging in de werkgroep. De opzet van de module Organisatie van Zorg is in samenspraak met de patiëntenorganisatie opgezet. De conceptrichtlijn is tevens voor commentaar voorgelegd aan verschillende patiëntenverenigingen (o.a. ReumaNederland en ReumaZorg Nederland) en de eventueel aangeleverde commentaren zijn bekeken en verwerkt.
Wkkgz & Kwalitatieve raming van mogelijke substantiële financiële gevolgen
Kwalitatieve raming van mogelijke financiële gevolgen in het kader van de Wkkgz
Bij de richtlijn is conform de Wet kwaliteit, klachten en geschillen zorg (Wkkgz) een kwalitatieve raming uitgevoerd of de aanbevelingen mogelijk leiden tot substantiële financiële gevolgen. Bij het uitvoeren van deze beoordeling zijn richtlijnmodules op verschillende domeinen getoetst (zie het stroomschema op de Richtlijnendatabase).
Uit de kwalitatieve raming blijkt dat er waarschijnlijk geen substantiële financiële gevolgen zijn, zie onderstaande tabel.
|
Module |
Uitkomst raming |
Toelichting |
|
Module Diagnostiek |
Geen financiële gevolgen |
Hoewel uit de toetsing volgt dat de aanbeveling(en) breed toepasbaar zijn (5.000-40.000 patiënten), volgt ook uit de toetsing dat het geen nieuwe manier van zorgverlening of andere organisatie van zorgverlening betreft. Er worden daarom geen substantiële financiële gevolgen verwacht. |
Methode ontwikkeling
Evidence based
Werkwijze
AGREE
Deze richtlijnmodule is opgesteld conform de eisen vermeld in het rapport Medisch Specialistische Richtlijnen 2.0 van de adviescommissie Richtlijnen van de Raad Kwaliteit. Dit rapport is gebaseerd op het AGREE II instrument (Appraisal of Guidelines for Research & Evaluation II; Brouwers, 2010). Bij deze richtlijn is er sprake van een versnelde adaptatie van een internationale richtlijn naar de Nederlandse praktijk. Daarvoor zijn de stappen gevolgd conform het advies “Adapteren van internationale richtlijnen naar de Nederlandse praktijk” (RK-17.07.07, bijlage bij adviesrapport ‘Adapteren van internationale richtlijnen naar de Nederlandse praktijk. Opgesteld door de adviescommissie richtlijnen, en vastgesteld op 27 juni 2017).
Knelpuntenanalyse en uitgangsvragen
Tijdens de voorbereidende fase inventariseerde de werkgroep de knelpunten in de huidige zorg middels een invitational conference. Bij deze bijeenkomst waren vertegenwoordigers vanuit verschillende organisaties aanwezig. Een verslag hiervan is opgenomen onder aanverwante producten (Bijlage 1).
Op basis van de uitkomsten van de knelpuntenanalyse zijn door de werkgroep concept-uitgangsvragen opgesteld en definitief vastgesteld.
Uitkomstmaten
Na het opstellen van de zoekvraag behorende bij de uitgangsvraag inventariseerde de werkgroep welke uitkomstmaten voor de patiënt relevant zijn, waarbij zowel naar gewenste als ongewenste effecten werd gekeken. Hierbij werd een maximum van acht uitkomstmaten gehanteerd. De werkgroep waardeerde deze uitkomstmaten volgens hun relatieve belang bij de besluitvorming rondom aanbevelingen, als cruciaal (kritiek voor de besluitvorming), belangrijk (maar niet cruciaal) en onbelangrijk. Tevens definieerde de werkgroep tenminste voor de cruciale uitkomstmaten welke verschillen zij klinisch (patiënt) relevant vonden.
Methode literatuursamenvatting
Een uitgebreide beschrijving van de strategie voor zoeken en selecteren van literatuur en de beoordeling van de risk-of-bias van de individuele studies is te vinden onder ‘Search and select’. De beoordeling van de kracht van het wetenschappelijke bewijs wordt hieronder toegelicht.
Beoordelen van de kracht van het wetenschappelijke bewijs
De kracht van het wetenschappelijke bewijs werd bepaald volgens de GRADE-methode. GRADE staat voor ‘Grading Recommendations Assessment, Development and Evaluation’ (zie http://www.gradeworkinggroup.org/). De basisprincipes van de GRADE-methodiek zijn: het benoemen en prioriteren van de klinisch (patiënt) relevante uitkomstmaten, een systematische review per uitkomstmaat, en een beoordeling van de bewijskracht per uitkomstmaat op basis van de acht GRADE-domeinen (domeinen voor downgraden: risk of bias, inconsistentie, indirectheid, imprecisie, en publicatiebias; domeinen voor upgraden: dosis-effect relatie, groot effect, en residuele plausibele confounding).
GRADE onderscheidt vier gradaties voor de kwaliteit van het wetenschappelijk bewijs: hoog, redelijk, laag en zeer laag. Deze gradaties verwijzen naar de mate van zekerheid die er bestaat over de literatuurconclusie, in het bijzonder de mate van zekerheid dat de literatuurconclusie de aanbeveling adequaat ondersteunt (Schünemann, 2013; Hultcrantz, 2017).
|
GRADE |
Definitie |
|
Hoog |
|
|
Redelijk |
|
|
Laag |
|
|
Zeer laag |
|
Bij het beoordelen (graderen) van de kracht van het wetenschappelijk bewijs in richtlijnen volgens de GRADE-methodiek spelen grenzen voor klinische besluitvorming een belangrijke rol (Hultcrantz, 2017). Dit zijn de grenzen die bij overschrijding aanleiding zouden geven tot een aanpassing van de aanbeveling. Om de grenzen voor klinische besluitvorming te bepalen moeten alle relevante uitkomstmaten en overwegingen worden meegewogen. De grenzen voor klinische besluitvorming zijn daarmee niet één op één vergelijkbaar met het minimaal klinisch relevant verschil (Minimal Clinically Important Difference, MCID). Met name in situaties waarin een interventie geen belangrijke nadelen heeft en de kosten relatief laag zijn, kan de grens voor klinische besluitvorming met betrekking tot de effectiviteit van de interventie bij een lagere waarde (dichter bij het nuleffect) liggen dan de MCID (Hultcrantz, 2017).
Overwegingen (van bewijs naar aanbeveling)
Om te komen tot een aanbeveling zijn naast (de kwaliteit van) het wetenschappelijke bewijs ook andere aspecten belangrijk en worden meegewogen, zoals aanvullende argumenten uit bijvoorbeeld de biomechanica of fysiologie, waarden en voorkeuren van patiënten, kosten (middelenbeslag), aanvaardbaarheid, haalbaarheid en implementatie. Deze aspecten zijn systematisch vermeld en beoordeeld (gewogen) onder het kopje ‘Overwegingen’ en kunnen (mede) gebaseerd zijn op expert opinion. Hierbij is gebruik gemaakt van een gestructureerd format gebaseerd op het evidence-to-decision framework van de internationale GRADE Working Group (Alonso-Coello, 2016a; Alonso-Coello 2016b). Dit evidence-to-decision framework is een integraal onderdeel van de GRADE methodiek.
Formuleren van aanbevelingen
De aanbevelingen geven antwoord op de uitgangsvraag en zijn gebaseerd op het beschikbare wetenschappelijke bewijs en de belangrijkste overwegingen, en een weging van de gunstige en ongunstige effecten van de relevante interventies. De kracht van het wetenschappelijk bewijs en het gewicht dat door de werkgroep wordt toegekend aan de overwegingen, bepalen samen de sterkte van de aanbeveling. Conform de GRADE-methodiek sluit een lage bewijskracht van conclusies in de systematische literatuuranalyse een sterke aanbeveling niet a priori uit, en zijn bij een hoge bewijskracht ook zwakke aanbevelingen mogelijk (Agoritsas, 2017; Neumann, 2016). De sterkte van de aanbeveling wordt altijd bepaald door weging van alle relevante argumenten tezamen. De werkgroep heeft bij elke aanbeveling opgenomen hoe zij tot de richting en sterkte van de aanbeveling zijn gekomen.
In de GRADE-methodiek wordt onderscheid gemaakt tussen sterke en zwakke (of conditionele) aanbevelingen. De sterkte van een aanbeveling verwijst naar de mate van zekerheid dat de voordelen van de interventie opwegen tegen de nadelen (of vice versa), gezien over het hele spectrum van patiënten waarvoor de aanbeveling is bedoeld. De sterkte van een aanbeveling heeft duidelijke implicaties voor patiënten, behandelaars en beleidsmakers (zie onderstaande tabel). Een aanbeveling is geen dictaat, zelfs een sterke aanbeveling gebaseerd op bewijs van hoge kwaliteit (GRADE gradering HOOG) zal niet altijd van toepassing zijn, onder alle mogelijke omstandigheden en voor elke individuele patiënt.
|
Implicaties van sterke en zwakke aanbevelingen voor verschillende richtlijngebruikers |
||
|
|
Sterke aanbeveling |
Zwakke (conditionele) aanbeveling |
|
Voor patiënten |
De meeste patiënten zouden de aanbevolen interventie of aanpak kiezen en slechts een klein aantal niet. |
Een aanzienlijk deel van de patiënten zouden de aanbevolen interventie of aanpak kiezen, maar veel patiënten ook niet. |
|
Voor behandelaars |
De meeste patiënten zouden de aanbevolen interventie of aanpak moeten ontvangen. |
Er zijn meerdere geschikte interventies of aanpakken. De patiënt moet worden ondersteund bij de keuze voor de interventie of aanpak die het beste aansluit bij zijn of haar waarden en voorkeuren. |
|
Voor beleidsmakers |
De aanbevolen interventie of aanpak kan worden gezien als standaardbeleid. |
Beleidsbepaling vereist uitvoerige discussie met betrokkenheid van veel stakeholders. Er is een grotere kans op lokale beleidsverschillen. |
Organisatie van zorg
Meer algemene, overkoepelende, of bijkomende aspecten van de organisatie van zorg worden behandeld in de module organisatie van zorg.
Commentaar- en autorisatiefase
De conceptrichtlijnmodule werd aan de betrokken (wetenschappelijke) verenigingen en (patiënt) organisaties voorgelegd ter commentaar. De commentaren werden verzameld en besproken met de werkgroep. Naar aanleiding van de commentaren werd de conceptrichtlijnmodule aangepast en definitief vastgesteld door de werkgroep. De definitieve richtlijnmodule werd aan de deelnemende (wetenschappelijke) verenigingen en (patiënt)organisaties voorgelegd voor autorisatie en door hen geautoriseerd dan wel geaccordeerd.
Literatuur
Agoritsas T, Merglen A, Heen AF, Kristiansen A, Neumann I, Brito JP, Brignardello-Petersen R, Alexander PE, Rind DM, Vandvik PO, Guyatt GH. UpToDate adherence to GRADE criteria for strong recommendations: an analytical survey. BMJ Open. 2017 Nov 16;7(11):e018593. doi: 10.1136/bmjopen-2017-018593. PubMed PMID: 29150475; PubMed Central PMCID: PMC5701989.
Alonso-Coello P, Schünemann HJ, Moberg J, Brignardello-Petersen R, Akl EA, Davoli M, Treweek S, Mustafa RA, Rada G, Rosenbaum S, Morelli A, Guyatt GH, Oxman AD; GRADE Working Group. GRADE Evidence to Decision (EtD) frameworks: a systematic and transparent approach to making well informed healthcare choices. 1: Introduction. BMJ. 2016 Jun 28;353:i2016. doi: 10.1136/bmj.i2016. PubMed PMID: 27353417.
Alonso-Coello P, Oxman AD, Moberg J, Brignardello-Petersen R, Akl EA, Davoli M, Treweek S, Mustafa RA, Vandvik PO, Meerpohl J, Guyatt GH, Schünemann HJ; GRADE Working Group. GRADE Evidence to Decision (EtD) frameworks: a systematic and transparent approach to making well informed healthcare choices. 2: Clinical practice guidelines. BMJ. 2016 Jun 30;353:i2089. doi: 10.1136/bmj.i2089. PubMed PMID: 27365494.
Brouwers MC, Kho ME, Browman GP, Burgers JS, Cluzeau F, Feder G, Fervers B, Graham ID, Grimshaw J, Hanna SE, Littlejohns P, Makarski J, Zitzelsberger L; AGREE Next Steps Consortium. AGREE II: advancing guideline development, reporting and evaluation in health care. CMAJ. 2010 Dec 14;182(18):E839-42. doi: 10.1503/cmaj.090449. Epub 2010 Jul 5. Review. PubMed PMID: 20603348; PubMed Central PMCID: PMC3001530.
Hultcrantz M, Rind D, Akl EA, Treweek S, Mustafa RA, Iorio A, Alper BS, Meerpohl JJ, Murad MH, Ansari MT, Katikireddi SV, Östlund P, Tranæus S, Christensen R, Gartlehner G, Brozek J, Izcovich A, Schünemann H, Guyatt G. The GRADE Working Group clarifies the construct of certainty of evidence. J Clin Epidemiol. 2017 Jul;87:4-13. doi: 10.1016/j.jclinepi.2017.05.006. Epub 2017 May 18. PubMed PMID: 28529184; PubMed Central PMCID: PMC6542664.
Medisch Specialistische Richtlijnen 2.0 (2012). Adviescommissie Richtlijnen van de Raad Kwaliteit. http://richtlijnendatabase.nl/over_deze_site/over_richtlijnontwikkeling.html
Neumann I, Santesso N, Akl EA, Rind DM, Vandvik PO, Alonso-Coello P, Agoritsas T, Mustafa RA, Alexander PE, Schünemann H, Guyatt GH. A guide for health professionals to interpret and use recommendations in guidelines developed with the GRADE approach. J Clin Epidemiol. 2016 Apr;72:45-55. doi: 10.1016/j.jclinepi.2015.11.017. Epub 2016 Jan 6. Review. PubMed PMID: 26772609.
Schünemann H, Brożek J, Guyatt G, et al. GRADE handbook for grading quality of evidence and strength of recommendations. Updated October 2013. The GRADE Working Group, 2013. Available from http://gdt.guidelinedevelopment.org/central_prod/_design/client/handbook/handbook.html.
Zoekverantwoording
Zoekverantwoording
Embase
|
No. |
Query |
Results |
|
#29 |
#19 NOT #28 1 sleutelartikel niet gevonden (overzichtsartikel) |
1 |
|
#28 |
#18 AND #27 sleutelartikelen gevonden |
8 |
|
#27 |
#24 OR #25 OR #26 |
232 |
|
#26 |
#8 AND (#22 OR #23) |
213 |
|
#25 |
#8 AND #21 |
12 |
|
#24 |
#8 AND #20 |
34 |
|
#23 |
'case control study'/de OR 'comparative study'/exp OR 'control group'/de OR 'controlled study'/de OR 'controlled clinical trial'/de OR 'crossover procedure'/de OR 'double blind procedure'/de OR 'phase 2 clinical trial'/de OR 'phase 3 clinical trial'/de OR 'phase 4 clinical trial'/de OR 'pretest posttest design'/de OR 'pretest posttest control group design'/de OR 'quasi experimental study'/de OR 'single blind procedure'/de OR 'triple blind procedure'/de OR (((control OR controlled) NEAR/6 trial):ti,ab,kw) OR (((control OR controlled) NEAR/6 (study OR studies)):ti,ab,kw) OR (((control OR controlled) NEAR/1 active):ti,ab,kw) OR 'open label*':ti,ab,kw OR (((double OR two OR three OR multi OR trial) NEAR/1 (arm OR arms)):ti,ab,kw) OR ((allocat* NEAR/10 (arm OR arms)):ti,ab,kw) OR placebo*:ti,ab,kw OR 'sham-control*':ti,ab,kw OR (((single OR double OR triple OR assessor) NEAR/1 (blind* OR masked)):ti,ab,kw) OR nonrandom*:ti,ab,kw OR 'non-random*':ti,ab,kw OR 'quasi-experiment*':ti,ab,kw OR crossover:ti,ab,kw OR 'cross over':ti,ab,kw OR 'parallel group*':ti,ab,kw OR 'factorial trial':ti,ab,kw OR ((phase NEAR/5 (study OR trial)):ti,ab,kw) OR ((case* NEAR/6 (matched OR control*)):ti,ab,kw) OR ((match* NEAR/6 (pair OR pairs OR cohort* OR control* OR group* OR healthy OR age OR sex OR gender OR patient* OR subject* OR participant*)):ti,ab,kw) OR ((propensity NEAR/6 (scor* OR match*)):ti,ab,kw) OR versus:ti OR vs:ti OR compar*:ti OR ((compar* NEAR/1 study):ti,ab,kw) OR (('major clinical study'/de OR 'clinical study'/de OR 'cohort analysis'/de OR 'observational study'/de OR 'cross-sectional study'/de OR 'multicenter study'/de OR 'correlational study'/de OR 'follow up'/de OR cohort*:ti,ab,kw OR 'follow up':ti,ab,kw OR followup:ti,ab,kw OR longitudinal*:ti,ab,kw OR prospective*:ti,ab,kw OR retrospective*:ti,ab,kw OR observational*:ti,ab,kw OR 'cross sectional*':ti,ab,kw OR cross?ectional*:ti,ab,kw OR multicent*:ti,ab,kw OR 'multi-cent*':ti,ab,kw OR consecutive*:ti,ab,kw) AND (group:ti,ab,kw OR groups:ti,ab,kw OR subgroup*:ti,ab,kw OR versus:ti,ab,kw OR vs:ti,ab,kw OR compar*:ti,ab,kw OR 'odds ratio*':ab OR 'relative odds':ab OR 'risk ratio*':ab OR 'relative risk*':ab OR 'rate ratio':ab OR aor:ab OR arr:ab OR rrr:ab OR ((('or' OR 'rr') NEAR/6 ci):ab))) |
13571461 |
|
#22 |
'major clinical study'/de OR 'clinical study'/de OR 'case control study'/de OR 'family study'/de OR 'longitudinal study'/de OR 'retrospective study'/de OR 'prospective study'/de OR 'comparative study'/de OR 'cohort analysis'/de OR ((cohort NEAR/1 (study OR studies)):ab,ti) OR (('case control' NEAR/1 (study OR studies)):ab,ti) OR (('follow up' NEAR/1 (study OR studies)):ab,ti) OR (observational NEAR/1 (study OR studies)) OR ((epidemiologic NEAR/1 (study OR studies)):ab,ti) OR (('cross sectional' NEAR/1 (study OR studies)):ab,ti) |
6767914 |
|
#21 |
'randomized controlled trial'/exp OR random*:ti,ab OR (((pragmatic OR practical) NEAR/1 'clinical trial*'):ti,ab) OR ((('non inferiority' OR noninferiority OR superiority OR equivalence) NEAR/3 trial*):ti,ab) OR rct:ti,ab,kw |
1839814 |
|
#20 |
'meta analysis'/exp OR 'meta analysis (topic)'/exp OR metaanaly*:ti,ab OR 'meta analy*':ti,ab OR metanaly*:ti,ab OR 'systematic review'/de OR 'cochrane database of systematic reviews'/jt OR prisma:ti,ab OR prospero:ti,ab OR (((systemati* OR scoping OR umbrella OR 'structured literature') NEAR/3 (review* OR overview*)):ti,ab) OR ((systemic* NEAR/1 review*):ti,ab) OR (((systemati* OR literature OR database* OR 'data base*') NEAR/10 search*):ti,ab) OR (((structured OR comprehensive* OR systemic*) NEAR/3 search*):ti,ab) OR (((literature NEAR/3 review*):ti,ab) AND (search*:ti,ab OR database*:ti,ab OR 'data base*':ti,ab)) OR (('data extraction':ti,ab OR 'data source*':ti,ab) AND 'study selection':ti,ab) OR ('search strategy':ti,ab AND 'selection criteria':ti,ab) OR ('data source*':ti,ab AND 'data synthesis':ti,ab) OR medline:ab OR pubmed:ab OR embase:ab OR cochrane:ab OR (((critical OR rapid) NEAR/2 (review* OR overview* OR synthes*)):ti) OR ((((critical* OR rapid*) NEAR/3 (review* OR overview* OR synthes*)):ab) AND (search*:ab OR database*:ab OR 'data base*':ab)) OR metasynthes*:ti,ab OR 'meta synthes*':ti,ab |
733409 |
|
#19 |
#8 AND #18 |
9 |
|
#18 |
#9 OR #10 OR #11 OR #12 OR #13 OR #14 OR #15 OR #16 OR #17 sleutelartikelen |
9 |
|
#17 |
the AND diagnostic AND performance AND of AND dual AND energy AND ct AND for AND diagnosing AND gout AND a AND systematic AND literature AND review AND 'meta analysis' |
1 |
|
#16 |
diagnostic AND value AND clinical, AND laboratory, AND imaging AND findings AND in AND patients AND with AND a AND clinical AND suspicion AND of AND gout AND sivera |
1 |
|
#15 |
ultrasonography AND gout AND utility AND in AND diagnosis AND monitoring AND christiansen |
1 |
|
#14 |
systemic AND staging AND for AND urate AND crystal AND deposits AND 'dual energy' AND ct AND ultrasound AND in AND patients AND with AND suspected AND gout |
1 |
|
#13 |
detection AND of AND uric AND acid AND crystal AND deposition AND by AND ultrasonography AND 'dual energy' AND computed AND tomography AND wang |
1 |
|
#12 |
performance AND ultrasound AND diagnosis AND of AND gout AND in AND a AND multicenter AND study AND comparison AND with AND monosodium AND urate AND monohydrate AND crystal AND analysis AND as AND the AND gold AND standard |
1 |
|
#11 |
imaging AND modalities AND for AND the AND classification AND of AND gout AND systematic AND literature AND review AND 'meta analysis' AND 2015 |
1 |
|
#10 |
diagnostic AND accuracy AND of AND ultrasound AND in AND patients AND with AND gout AND lee AND 2018 |
1 |
|
#9 |
'dual energy' AND computed AND tomography AND has AND additional AND prognostic AND value AND over AND clinical AND measures AND in AND gout AND including AND tophi AND stauder AND 2022 |
1 |
|
#8 |
#7 AND [1-5-2011]/sd NOT ('conference abstract'/it OR 'editorial'/it OR 'letter'/it OR 'note'/it) NOT (('animal'/exp OR 'animal experiment'/exp OR 'animal model'/exp OR 'nonhuman'/exp) NOT 'human'/exp) |
380 |
|
#7 |
#5 AND #6 |
742 |
|
#6 |
'sensitivity and specificity'/de OR sensitiv*:ab,ti OR specific*:ab,ti OR predict*:ab,ti OR 'roc curve':ab,ti OR 'receiver operator':ab,ti OR 'receiver operators':ab,ti OR likelihood:ab,ti OR 'diagnostic error'/exp OR 'diagnostic accuracy'/exp OR 'diagnostic test accuracy study'/exp OR 'inter observer':ab,ti OR 'intra observer':ab,ti OR interobserver:ab,ti OR intraobserver:ab,ti OR validity:ab,ti OR kappa:ab,ti OR reliability:ab,ti OR reproducibility:ab,ti OR ((test NEAR/2 're-test'):ab,ti) OR ((test NEAR/2 'retest'):ab,ti) OR 'reproducibility'/exp OR accuracy:ab,ti OR 'differential diagnosis'/exp OR 'validation study'/de OR 'measurement precision'/exp OR 'diagnostic value'/exp OR 'reliability'/exp OR 'predictive value'/exp OR ppv:ti,ab,kw OR npv:ti,ab,kw |
9455264 |
|
#5 |
#1 AND #4 |
1452 |
|
#4 |
#2 OR #3 |
1320254 |
|
#3 |
'echography'/exp OR 'color doppler flowmetry'/exp OR ultraso*:ab,ti,kw OR sonograph*:ab,ti,kw OR echograph*:ab,ti,kw OR echotomograph*:ab,ti,kw OR ((colo?r NEAR/3 doppler):ti,ab,kw) |
1315126 |
|
#2 |
'dual energy computed tomography'/exp OR 'dual energy ct':ti,ab,kw OR 'dual energy computed tomography':ti,ab,kw OR dect:ti,ab,kw |
5781 |
|
#1 |
'gout'/exp/mj OR 'arthragra':ti,ab,kw OR 'arthritis urica':ti,ab,kw OR 'cheiragra':ti,ab,kw OR 'chiragra':ti,ab,kw OR 'gout*':ti,ab,kw OR 'urate inflammation*':ti,ab,kw OR 'uric arthritis':ti,ab,kw OR toph*:ti,ab,kw OR 'podagra':ti,ab,kw |
29173 |
Ovid/Medline
|
# |
Searches |
Results |
|
17 |
14 or 15 or 16 |
295 |
|
16 |
7 and (12 or 13) OBS |
276 |
|
15 |
9 and 11 RCT |
10 |
|
14 |
9 and 10 SR |
31 |
|
13 |
Case-control Studies/ or clinical trial, phase ii/ or clinical trial, phase iii/ or clinical trial, phase iv/ or comparative study/ or control groups/ or controlled before-after studies/ or controlled clinical trial/ or double-blind method/ or historically controlled study/ or matched-pair analysis/ or single-blind method/ or (((control or controlled) adj6 (study or studies or trial)) or (compar* adj (study or studies)) or ((control or controlled) adj1 active) or "open label*" or ((double or two or three or multi or trial) adj (arm or arms)) or (allocat* adj10 (arm or arms)) or placebo* or "sham-control*" or ((single or double or triple or assessor) adj1 (blind* or masked)) or nonrandom* or "non-random*" or "quasi-experiment*" or "parallel group*" or "factorial trial" or "pretest posttest" or (phase adj5 (study or trial)) or (case* adj6 (matched or control*)) or (match* adj6 (pair or pairs or cohort* or control* or group* or healthy or age or sex or gender or patient* or subject* or participant*)) or (propensity adj6 (scor* or match*))).ti,ab,kf. or (confounding adj6 adjust*).ti,ab. or (versus or vs or compar*).ti. or ((exp cohort studies/ or epidemiologic studies/ or multicenter study/ or observational study/ or seroepidemiologic studies/ or (cohort* or 'follow up' or followup or longitudinal* or prospective* or retrospective* or observational* or multicent* or 'multi-cent*' or consecutive*).ti,ab,kf.) and ((group or groups or subgroup* or versus or vs or compar*).ti,ab,kf. or ('odds ratio*' or 'relative odds' or 'risk ratio*' or 'relative risk*' or aor or arr or rrr).ab. or (("OR" or "RR") adj6 CI).ab.)) |
5153503 |
|
12 |
Epidemiologic studies/ or case control studies/ or exp cohort studies/ or Controlled Before-After Studies/ or Case control.tw. or cohort.tw. or Cohort analy$.tw. or (Follow up adj (study or studies)).tw. or (observational adj (study or studies)).tw. or Longitudinal.tw. or Retrospective*.tw. or prospective*.tw. or consecutive*.tw. or Cross sectional.tw. or Cross-sectional studies/ or historically controlled study/ or interrupted time series analysis/ [Onder exp cohort studies vallen ook longitudinale, prospectieve en retrospectieve studies] |
4144643 |
|
11 |
exp randomized controlled trial/ or randomized controlled trials as topic/ or random*.ti,ab. or rct?.ti,ab. or ((pragmatic or practical) adj "clinical trial*").ti,ab,kf. or ((non-inferiority or noninferiority or superiority or equivalence) adj3 trial*).ti,ab,kf. |
1509942 |
|
10 |
meta-analysis/ or meta-analysis as topic/ or (metaanaly* or meta-analy* or metanaly*).ti,ab,kf. or systematic review/ or cochrane.jw. or (prisma or prospero).ti,ab,kf. or ((systemati* or scoping or umbrella or "structured literature") adj3 (review* or overview*)).ti,ab,kf. or (systemic* adj1 review*).ti,ab,kf. or ((systemati* or literature or database* or data-base*) adj10 search*).ti,ab,kf. or ((structured or comprehensive* or systemic*) adj3 search*).ti,ab,kf. or ((literature adj3 review*) and (search* or database* or data-base*)).ti,ab,kf. or (("data extraction" or "data source*") and "study selection").ti,ab,kf. or ("search strategy" and "selection criteria").ti,ab,kf. or ("data source*" and "data synthesis").ti,ab,kf. or (medline or pubmed or embase or cochrane).ab. or ((critical or rapid) adj2 (review* or overview* or synthes*)).ti. or (((critical* or rapid*) adj3 (review* or overview* or synthes*)) and (search* or database* or data-base*)).ab. or (metasynthes* or meta-synthes*).ti,ab,kf. |
597306 |
|
9 |
7 and 8 |
322 |
|
8 |
exp "Sensitivity and Specificity"/ or (Sensitiv* or Specific*).ti,ab. or (predict* or ROC-curve or receiver-operator*).ti,ab. or (likelihood or LR*).ti,ab. or exp Diagnostic Errors/ or (inter-observer or intra-observer or interobserver or intraobserver or validity or kappa or reliability).ti,ab. or reproducibility.ti,ab. or (test adj2 (re-test or retest)).ti,ab. or "Reproducibility of Results"/ or accuracy.ti,ab. or Diagnosis, Differential/ or Validation Study/ |
7408833 |
|
7 |
6 not ((exp animals/ or exp models, animal/) not humans/) not (letter/ or comment/ or editorial/) |
625 |
|
6 |
limit 5 to dt="20110501-20300101" |
676 |
|
5 |
1 and 4 |
818 |
|
4 |
2 or 3 |
711633 |
|
3 |
(dual energy ct or dual energy computed tomograp* or dect).mp. |
3313 |
|
2 |
exp Ultrasonography/ or ultraso*.ti,ab,kf. or sonograph*.ti,ab,kf. or echograph*.ti,ab,kf. or echotomograph*.ti,ab,kf. or (colo?r adj3 doppler).ti,ab,kf. |
708529 |
|
1 |
exp Gout/ or arthragra.ti,ab,kf. or arthritis urica.ti,ab,kf. or cheiragra.ti,ab,kf. or chiragra.ti,ab,kf. or gout*.ti,ab,kf. or urate inflammation*.ti,ab,kf. or uric arthritis.ti,ab,kf. or toph*.ti,ab,kf. or podagra.ti,ab,kf. |
20843 |