Glucose zelfmanagement bij patiënten met diabetes mellitus (DM) type 1
Uitgangsvraag
Wat is de optimale methode van glucose zelfmanagement voor volwassenen met diabetes mellitus type 1 (DM1) behandeld met basaal-bolus insuline of insulinepomp?
Aanbeveling
Bepaal de keuze voor glucosecontrole en insulinebehandeling bij volwassenen met DM1 in nauwe samenspraak met het diabetesbehandelteam en de patiënt:
- Kies bij start van de behandeling bij voorkeur voor FGM als vorm van glucosecontrole.
- Bepaal samen met de patiënt en het diabetesbehandelteam de individuele behandeldoelen van de patiënt. Let hierbij (ook) op: HbA1c, percentage glucosewaarden binnen streefwaarde (Time in range), frequentie en ernst van hypoglykemieën, verminderde hypoglykemie awareness en kwaliteit van leven.
- Kies welke vorm van glucosecontrole en insulinetoediening het meest geschikt is om de behandeldoelen te bereiken. Bespreek hierbij de voor- en nadelen van verschillende methoden, en hou rekening met persoonlijke voorkeuren en mogelijkheden van de patiënt. Gebruik hierbij de Checklist Glucosecontrole en Insulinetherapie (zie hieronder).
- Maak afspraken met de patiënt over de eigen verantwoordelijkheden en verplichtingen die verbonden zijn aan de keuzes die gemaakt zijn voor insulinetoediening en glucosecontrole.
- Overweeg bij niet halen van behandeldoelen en/of bij zwangerschapswens bij voldoende motivatie en inzet van de patiënt een (semi) gesloten systeem.
- Bespreek regelmatig binnen het diabetesbehandelteam de mate waarin de individuele behandeldoelen worden bereikt. Bespreek regelmatig met de patiënt of alle behandeldoelen naar tevredenheid van patiënt én behandelteam worden bereikt, en waar verbetering nodig is. Stel samen met patiënt vast welk behandeldoel eventueel voorrang krijgt bij de aanpak van de behandeling.
- Evalueer jaarlijks of de geformuleerde behandeldoelen gehaald worden, en indien dit niet het geval is, wat hieraan ten grondslag ligt en of er reden is om de behandeldoelen aan te passen. Overleg met de patiënt of de gekozen therapie de juiste is en, indien nodig, wat de vervolgstappen in het behandeltraject kunnen zijn. Dit kan betekenen dat het gebruik van het hulpmiddel beter gefaciliteerd kan worden, of dat dit niet wordt gecontinueerd.
Checklist Glucosecontrole en Insulinetherapie
Glucosecontrole (CGM, FGM)
FGM is de standaard glucosecontrolevorm. Indien CGM overwogen wordt, stel dan vooraf vast welke behandeldoelen beter gehaald kunnen worden door een switch van FGM naar CGM. Overweeg CGM als aan onderstaande voorwaarden is voldaan:
- De patiënt draagt de FGM tenminste 80% van de tijd of er is een goede reden waarom FGM onvoldoende geschikt is (onder andere intolerantie, allergie). Indien de FGM minder dan 80% van de tijd wordt gedragen wordt onvoldoende van FGM geprofiteerd, en zal dit waarschijnlijk ook gelden voor CGM.
- De patiënt kan omgaan met het tellen van koolhydraten en het berekenen van KH/I ratio’s.
- De patiënt kan omgaan met boluscalculatie of gebruikt een boluscalculator.
- De patiënt kan de benodigde software thuis installeren en gebruiken.
- De patiënt is bereid en in staat om koolhydraat-inname, insulinedoseringen en activiteiten te registreren.
- De patiënt kan omgaan met de alarmen en hier adequaat op reageren.
- De patiënt kan adequaat reageren op storingen en glykemische ontregelingen.
- De patiënt is bereid en in staat om regelmatig de data te delen en te evalueren met de zorgverlener, en houdt zich hierbij aan de gemaakte afspraken.
- De patiënt is akkoord dat na een afgesproken termijn (bijvoorbeeld 6 maanden) wordt geëvalueerd of CGM winst heeft opgeleverd, of de vooraf gestelde behandeldoelen zijn gehaald, en of CGM moet worden gecontinueerd. De patiënt is akkoord dat ook bij tussenevaluaties kan worden besloten om de CGM te staken.
Insulinetherapie (MDI, CSII en (semi)gesloten systeem)
MDI en CSII zijn de standaard toedieningsvormen, de keuze tussen deze opties volgt uit gezamenlijke besluitvorming.
Indien een (semi) closed-loop systeem (koppeling van CSII en CGM) overwogen wordt, stel dan vooraf vast welke behandeldoelen beter gehaald kunnen worden door een switch naar een (semi) closed-loop systeem. Overweeg een (semi) closed-loop systeem als aan onderstaande voorwaarden is voldaan:
- De patiënt voldoet aan de eisen voor inzet van CGM (: zie checklist Glucosecontrole).
- De patiënt beschikt over voldoende kennis van het (semi) closed-loop systeem en is in staat en bereid de glucoseregulatie (deels) over te laten aan het systeem.
Overwegingen
De overwegingen en aanbevelingen in dit document zijn bestemd voor niet-zwangere volwassenen met diabetes mellitus type 1 (DM1). De literatuur die hierbij is gebruikt betreft in het algemeen volwassenen (vanaf 18 jaar) met DM1 zonder comorbiditeit of ernstige complicaties zoals nierinsufficiëntie, micro- en/of macrovasculaire complicaties. Indien er sprake is van nierinsufficiëntie of andere ernstige comorbiditeit dient hiermee rekening te worden gehouden.
Voor- en nadelen van de interventie en de kwaliteit van het bewijs
Tabel 9 geeft een overzicht van de resultaten uit de literatuuranalyse. De belangrijkste uitkomsten waren:
- CGM had een klinisch (patiënt) relevant voordeel ten opzichte van SMBG (vingerprikken) op de uitkomstmaat tijd binnen streefwaarden, en een klein (triviaal) voordeel op de uitkomstmaat HbA1c. De overall bewijskracht (GRADE) voor de vergelijking tussen CGM en SMBG was laag tot zeer laag.
- FGM had een klein (triviaal) voordeel ten opzichte van SMBG op de uitkomstmaat hypoglykemie-frequentie en tijd binnen streefwaarden. Op de uitkomstmaat HbA1c was er daarentegen een klein (triviaal) voordeel voor SMBG. De overall bewijskracht (GRADE) voor de vergelijking tussen FGM en SMBG was laag tot zeer laag.
- CGM had een klein (triviaal) voordeel ten opzichte van FGM op de uitkomstmaat HbA1c. De overall bewijskracht (GRADE) voor de vergelijking tussen CGM en FGM was laag tot zeer laag.
- (semi)gesloten systemen hadden een klinisch (patiënt) relevant voordeel ten opzichte van FGM en CGM (niet-geïntegreerd) op de uitkomstmaten HbA1c en tijd binnen de streefwaarden. De overall bewijskracht (GRADE) voor de vergelijking tussen (semi-)gesloten systemen en FGM of CGM was laag tot zeer laag.
Tabel 9 Overzicht van de resultaten uit de literatuuranalyse (voor details, zie Samenvatting literatuur)
|
Uitkomstmaat |
Vergelijking tussen sensoren (FGM, CGM), vingerprikken (SMBG), en (semi-) gesloten systemen
|
|||
|
CGM versus SMBG (GRADE) |
FGM versus SMBG (GRADE) |
CGM versus FGM (GRADE) |
FGM en CGM versus (semi)gesloten (GRADE) |
|
|
Cruciale uitkomstmaten |
|
|
|
|
|
HbA1c |
Triviaal verschil (Laag) (voordeel CGM) |
Triviaal verschil (Laag) (voordeel SMBG) |
Triviaal verschil (Laag) (voordeel CGM) |
(semi)gesloten beter (Laag) |
|
Hypoglykemie-frequentie |
Onduidelijk (Zeer laag) |
Triviaal verschil (Laag) (voordeel FGM) |
Onduidelijk (Zeer laag) |
Onduidelijk (Zeer laag) |
|
Ernstige hypoglykemie |
Onduidelijk (Zeer laag) |
Onduidelijk (Zeer laag) |
Onduidelijk (Zeer laag) |
Onduidelijk (Zeer laag) |
|
Kwaliteit van leven |
Onduidelijk (Zeer laag) |
Onduidelijk (Zeer laag) |
Onduidelijk (Zeer laag) |
Geen data |
|
Ketoacidose |
Onvoldoende data |
Onvoldoende data |
Geen data |
Onvoldoende data |
|
Hypoglykemie-angst |
Onduidelijk (Zeer laag) |
Onduidelijk (Zeer laag) |
Onduidelijk (Zeer laag) |
Onduidelijk (Zeer laag) |
|
Overige* |
Geen data |
Geen data |
Geen data |
Geen data |
|
Belangrijke uitkomstmaten |
||||
|
Tijd binnen streefwaarden |
CGM beter (Laag) |
Triviaal verschil (Laag) (voordeel FGM) |
Onduidelijk (Zeer laag) |
(semi)gesloten beter (Laag) |
|
Patiënt-tevredenheid |
Onduidelijk (Zeer laag) |
Onduidelijk (Zeer laag) |
Geen data |
Onduidelijk (Zeer laag) |
|
Microvasculaire complicaties |
Onvoldoende data |
Geen data |
Geen data |
Geen data |
|
Complicaties/bijwerkingen |
Onvoldoende data |
Onvoldoende data |
Geen data |
Onvoldoende data |
|
Overige** |
Geen data |
Geen data |
Geen data |
Geen data |
|
Conclusie en overall bewijskracht |
CGM beter dan SMBG op de uitkomstmaat Tijd binnen streefwaarden, en een klein (triviaal) voordeel voor CGM op de uitkomstmaat HbA1c.
Bewijskracht (GRADE): Laag tot Zeer laag |
FGM beter dan SMBG met kleine (triviale) voordelen op hypoglykemie-frequentie en Tijd binnen streefwaarden. SMBG een klein (triviaal) voordeel op de uitkomstmaat HbA1c.
Bewijskracht (GRADE): Laag tot Zeer laag |
CGM beter dan FGM met een klein (triviaal) voordeel op de uitkomstmaat HbA1c.
Bewijskracht (GRADE): Laag tot Zeer laag |
(semi)gesloten systemen beter dan FGM / CGM op de uitkomstmaten HbA1c en Tijd binnen de streefwaarden.
Bewijskracht (GRADE): Laag tot Zeer laag |
*Overige cruciale uitkomstmaten: frequentie bloedglucosemeting (bij vingerprikken of sensor), nachtelijke hypoglykemie, ziekenhuisopname en depressie
**Overige belangrijke (niet cruciale) uitkomstmaten: verzuim (werk, school) en kosten
In het algemeen is er sprake van een lage tot zeer lage bewijskracht op alle relevante uitkomstmaten. De overall bewijskracht op de cruciale uitkomstmaten is in alle gevallen zeer laag.
Extra overwegingen
Het is onwaarschijnlijk dat toekomstig onderzoek de bewijskracht aanzienlijk zal verhogen. Het is, gezien de aard van de onderzochte interventies, niet mogelijk om RCT’s geblindeerd uit te voeren. Ook is de complexiteit van de studies hoog, en daardoor het aantal geïncludeerde proefpersonen relatief laag. Langlopende observationele studies zouden van waarde kunnen zijn maar gaan gepaard met een hoger risico op bias.
De werkgroep stelt vast dat er een discrepantie lijkt te bestaan tussen de uitkomst van de netwerk-analyse van Pease (2020a, 2020b) en de dagelijkse ervaringen bij patiënten en behandelaars op het punt van patiënttevredenheid en kwaliteit van leven. De werkgroep is van mening dat met name de overstap van SMBG naar FGM en CGM in de praktijk leidt tot grotere tevredenheid bij patiënten, omdat ze niet of nauwelijks meer in hun vingers hoeven te prikken. Dit is belangrijke winst voor de patiënt. Daarnaast bieden CGM en semi-gesloten systemen voor de patiënt voordelen op het gebied van controle over de eigen glucosewaarden. Het is onduidelijk waarom de beschreven studies op het punt van patiënttevredenheid en kwaliteit van leven nauwelijks effect laten zien. Mogelijk zijn de gebruikte meetinstrumenten hiervoor onvoldoende geschikt. Hetzelfde zou kunnen gelden voor de uitkomstmaat hypoglykemie-angst. Recent observationeel onderzoek uitgevoerd in samenwerking met Diabetesvereniging Nederland bevestigt de gunstige effecten van FGM op patiënttevredenheid, ervaren ziektelast en kwaliteit van leven, na een jaar gebruik door 1365 patiënten met diabetes mellitus met HbA1c-waardes van 64 mmol/l en hoger (77% type 1, 16% type 2 en 7% andere vormen; Fokkert, 2019). In de recent gepubliceerde ALERTT1 trial hadden de patiënten met DM1 in de CGM groep na zes maanden, bij een iets lager HbA1c, minder frequent ernstige hypoglycemieën en een hoger percentage glucosewaarden binnen streefwaarde, een statistisch significant lagere score op HFS worry subschaal en een statistisch significant hogere score op de Diabetes Treatment Satisfaction Questionnaire, ten opzichte van de FGM groep (Visser, 2021). Deze studie was, zoals alle studies naar de toegevoegde waarde van CGM en FGM, niet geblindeerd.
Na de zoekdatum van huidige literatuuranalyse publiceerde Pease (2020b) een aanvullende systematische review en netwerk meta-analyse specifiek gericht op de uitkomstmaat time in range (TIR). Zoekdatum en methodiek komen overeen met de eerdere systematische review van Pease (Pease, 2020a) die de basis vormt van de huidige literatuuranalyse (zie Samenvatting literatuur) met dien verstande dat studies al vanaf een studieduur van twee weken werden geïncludeerd in plaats van zes weken, en er bij de geïntegreerde systemen onderscheid werd gemaakt tussen 'closed loop', 'nocturnal closed loop' (alleen 's nachts ingezet) en 'low-glucose suspend' systemen. Hierbij werd elk systeem dat bestaat uit een combinatie van CGM met CSII die een automatische aanpassing van insulinetoediening mogelijk maakt, beschouwd als een closed-loop systeem. Studies met geïmplanteerde devices werden geëxcludeerd. Uit de netwerk meta-analyse (10 RCT's met in totaal 710 deelnemers) kwam naar voren dat closed-loop systemen de TIR statistisch significant en klinisch relevant vergroten: gemiddelde toename in percentage TIR met 17.9% in vergelijking met MDI+SMBG (95%BI=(9,3 tot 26,4)), met 13.3% in vergelijking met MDI+FGM (95%BI=(3,9 tot 22,7)), met 12.8% in vergelijking met MDI+CGM (95%BI=(4,9 tot 20,6)), en met 8.8% in vergelijking met CSII+CGM (95%BI=(4,2 tot 13,4)). Ook closed-loop systemen die alleen 's nachts functioneel zijn vergrootten de TIR: met gemiddeld 14,0% in vergelijking met MDI+SMBG (95%BI=(6,0 tot 21,9)), met 8.9% in vergelijking met MDI+CGM (95%BI=(1,7 tot 16,1)), en met 4.9% in vergelijking met CSII+CGM (95%BI=(1,7 tot 8,1)). De interventies kunnen worden gerangschikt op basis van hun SUCRA waarde (surface under the cumulative ranking curve). De SUCRA waarde is gebaseerd op zowel locatie (relatieve effectgrootte) als onzekerheid (variantie) van alle interventies in de netwerk meta-analyse. De top-3 interventies met hoogste SUCRA waardes, en daarmee grootste kans om de meest effectieve interventie te zijn, waren op basis van de uitkomsten voor TIR: closed-loop systemen (SUCRA 98.5%), nocturnal closed-loop systemen (SUCRA 83.9%), en CSII in combinatie met CGM (niet-geïntegreerd; SUCRA 57.7%). Zogenaamde cluster ranking plots geven inzicht in de ranking van de interventies op de belangrijkste uitkomstmaten: HbA1c en ernstige hypoglykemie (figuur 5), HbA1c en kwaliteit van leven (figuur 6), time in range en time above range (figuur 7), en time in range en time below range (figuur 8). Bij alle plots geldt dat de interventies die de grootste kans hebben om de meest effectieve interventie te zijn, zich bevinden in de rechter bovenhoek, en de interventies met de kleinste kans om de meest effectieve interventie te zijn, zich bevinden in de linker onderhoek van de plots. Vanwege de lage zekerheid van het bewijs (GRADE laag of zeer laag) moeten de rankings en ranking plots wel met enige voorzichtigheid worden geïnterpreteerd. Uit de ranking plots (figuur 5 tot 8) kwamen geïntegreerde systemen (‘closed loop’, ‘nocturnal closed loop’) en niet-geïntegreerde combinaties van CGM met CSII of MDI als beste naar voren.
Figuur 5
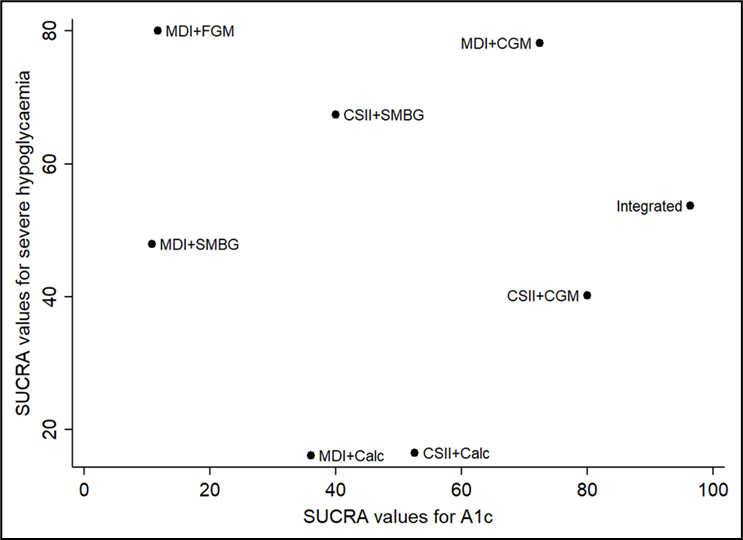
SUCRA rankschikking op basis van reductie in HbA1c en voorkomen van ernstige hypoglykemie (Pease, 2020b). De interventies met de hoogste SUCRA waarde hebben de grootste kans om de meest effectieve interventie te zijn (grootste HbA1c reductie en laagste frequentie ernstige hypoglykemische episodes)
Figuur 6
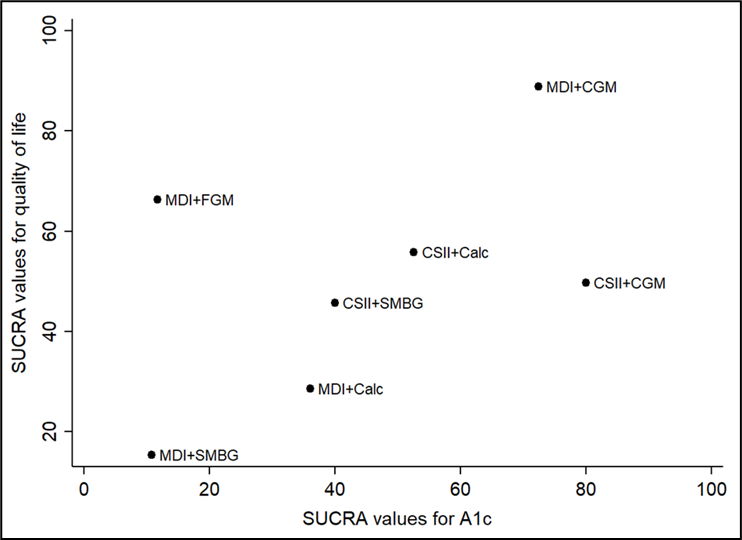
SUCRA rankschikking op basis van reductie in HbA1c en verbetering in kwaliteit van leven (Pease, 2020b). De interventies met de hoogste SUCRA waarde hebben de grootste kans om de meest effectieve interventie te zijn (grootste HbA1c reductie en grootste verbetering in kwaliteit van leven)
Figuur 7
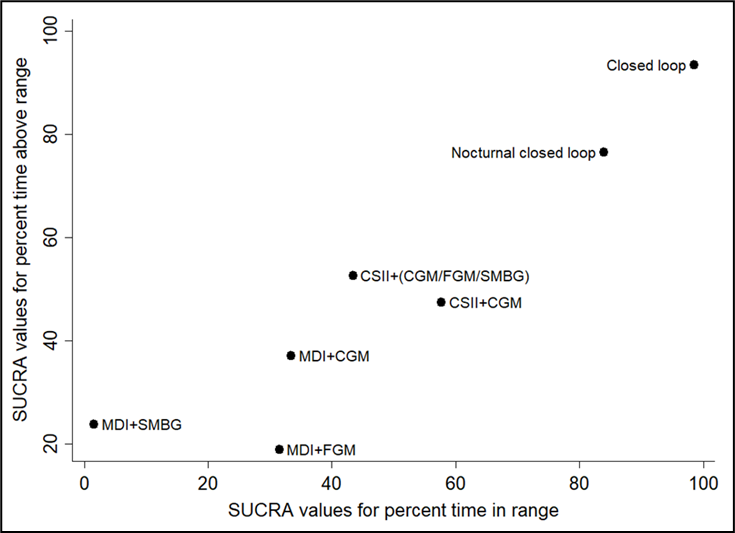
SUCRA rankschikking op basis van time in range (TIR), en time above range (Pease, 2020b). De interventies met de hoogste SUCRA waarde hebben de grootste kans om de meest effectieve interventie te zijn (hoogste time in range en time above range)
Figuur 8
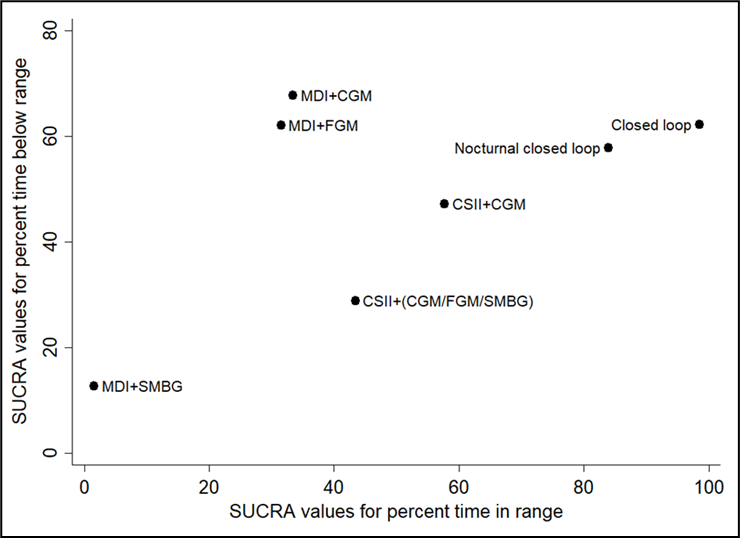
SUCRA rankschikking op basis van time in range (TIR), en time below range (Pease, 2020b). De interventies met de hoogste SUCRA waarde hebben de grootste kans om de meest effectieve interventie te zijn (hoogste time in range en laagste time below range)
Waarden en voorkeuren van patiënten (en eventueel hun verzorgers)
In de aanbeveling wordt benadrukt dat de behandelaar samen met de patiënt kiest (en eventueel met zijn/haar direct betrokkenen) voor een bepaalde manier van glucosecontrole in combinatie met basaal-bolus insuline of voor een (semi) gesloten systeem. Er dient met de patiënt te worden besproken welke behandeldoelen in het individuele geval het belangrijkst zijn (bijvoorbeeld voorkomen van hypoglykemieën, verlaging HbA1c, vermijden late complicaties, zwangerschapswens, sociale participatie, algemene kwaliteit van leven). Er kan sprake zijn van een sterk persoonlijk gekleurde voorkeur van de patiënt, mede op basis van eerdere ervaringen, opleidingsniveau, werk- of privésituatie etc. Sommige patiënten geven aan dat ze relatief veel last hebben van de vingerprik, terwijl anderen juist het permanent dragen van een sensor en/of een insulinepomp op het lichaam als bijzonder onaangenaam ervaren. In sommige beroepen (bijvoorbeeld buschauffeur of verkeersvlieger) kan het extra belangrijk zijn om hypoglykemieën te voorkomen. Bij een zwangerschapswens is een zo laag mogelijk HbA1c en het vermijden van glucosewaarden boven de streefwaarde extra belangrijk. Sensortechnologie biedt de mogelijkheid om de glucosewaarden op afstand te monitoren, hetgeen bij de behandeling van jonge kinderen met DM1 (geen onderdeel van de huidige richtlijnmodule) of volwassenen met DM1 en een verstandelijke beperking een voordeel kan zijn. Dit zijn een aantal voorbeelden om aan te geven dat de uiteindelijke keuze wordt bepaald aan de hand van alle beschikbare informatie over de individuele patiënt, en in nauwe samenspraak met de patiënt. Extra patiënteninformatie en keuzehulpen kunnen hierbij belangrijke hulpmiddelen zijn: zie hiervoor de website van Diabetesvereniging Nederland (https://www.dvn.nl/). De werkgroep adviseert om een keuzekaart te ontwikkelen ter ondersteuning van de keuze tussen FGM, CGM en (semi-) gesloten systemen. Bij algemeen gebruik van FGM en CGM zien behandelaren wat er gebeurt met de dagelijkse glucosewaarden en kunnen zij veel beter de educatie en de behandeling afstemmen op de individu.
Kosten (middelenbeslag)
Een recente systematisch review van kosteneffectiviteitsstudies (Pease 2020c), die literatuur includeert tot april 2019, suggereert dat CGM, FGM en insulinepompen kosteneffectief zijn in vergelijking met SMBG, met name bij groepen met een hoog HbA1c of frequente hypoglykemieën. De kosteneffectiviteit van (semi) gesloten systemen was minder duidelijk. Een belangrijke kanttekening bij deze kosteneffectiviteitsstudies is het gebrek aan betrouwbare gegevens over de lange termijn effecten op cruciale uitkomsten zoals ernstige hypoglykemieën en microvasculaire en macrovasculaire complicaties. Vanwege deze kennislacune is de bewijskracht van de kosteneffectiviteitsstudies (zeer) laag.
In het algemeen zijn de directe kosten (aanschaf en dagelijks gebruik) van nieuwe technologieën zoals FGM, CGM, CSII en (semi) gesloten systemen hoger dan de klassieke behandeling met MDI en SMBG. Omdat sensoren op dit moment duurder zijn dan de SMBG (niet rekening houdend met potentiële lange termijn kostenbesparingen) wordt van patiënten verwacht dat zij bereid en gemotiveerd zijn om optimaal gebruik te maken van de mogelijkheden die sensortherapie biedt. Van de behandelaars wordt gevraagd de inzet van deze sensoren doelmatig voor te schrijven, dat wil zeggen de beschikbare middelen optimaal te benutten. Met dit oogpunt is door de Nederlandse Diabetesfederatie een consensusdocument opgesteld met kwaliteitscriteria voor optimale en doelmatige inzet van FGM en CGM (NDF, 2020). Eerder stelde de NDF kwaliteitscriteria op voor de doelmatig inzet van insulinepomptherapie (NDF, 2015). Uiteindelijk moeten de hogere directe kosten worden afgezet tegen winst op middellange en lange termijn zoals: frequentie van ziekenhuisopname wegens hyper- of hypoglycemische ontregeling, late complicaties zoals nierinsufficiëntie, blindheid, amputaties, cardiovasculaire en andere complicaties, verminderde arbeidsproductiviteit door ziekteverzuim of arbeidsongeschiktheid, en psychische stoornissen zoals depressie of burn-out. Iedere patiënt met DM1 moet worden aangesproken op de eigen verantwoordelijkheid en het verantwoord en doelmatig gebruik van middelen. Essentieel hierbij is om met de patiënt duidelijke afspraken te maken, bijvoorbeeld over het delen en gezamenlijk evalueren van data, het nakomen van controle-afspraken, en het waar nodig aanpassen van gedrag. Door behandelaar en patiënt moet regelmatig worden geëvalueerd wat de meerwaarde van het gebruik van de duurdere technologieën is en of de hogere kosten gerechtvaardigd zijn. Bij onvoldoende winst kan worden besloten om een duurdere behandeling te vervangen door een goedkopere, meer eenvoudige behandeling.
Aanvaardbaarheid, haalbaarheid en implementatie
Behandeling van patiënten met DM1 is teamwork. In de dagelijkse praktijk is de patiënt de eigen behandelaar doordat er steeds weer op basis van diverse factoren moet worden beslist wat er aan insulinedosering en/of koolhydraat-inname moet worden gedaan. Het behandelteam (diabetesverpleegkundige, internist/kinderarts-endocrinoloog, diëtist) dient uiteraard deskundig, betrokken, toegewijd en goed bereikbaar te zijn voor vragen en ondersteuning van de patiënt (zie verder de zorgstandaard diabetes mellitus van de NDF (NDF, 2021;)). Ook goede bereikbaarheid van de leverancier van CGM, FGM en (semi) gesloten systemen is belangrijk bij storingen. Haalbaarheid en implementatie van de richtlijn is dus sterk afhankelijk van de beschikbaarheid van een deskundig diabetesteam. Anno 2021 is het ook essentieel dat patiënt met het team kan overleggen via diverse communicatiemedia, waarbij steeds alle partijen inzage hebben in de gegevens omtrent insulinedoseringen, glucosewaarden etc. In de zorgstandaard diabetes mellitus van de NDF wordt verder ingegaan op de kwaliteitseisen die worden gesteld aan het diabetes-behandelteam (NDF, 2021;). Voor de vergoeding van FGM, CGM en (semi) gesloten systemen zijn in de afgelopen tijd belangrijke stappen gezet. FGM en - in specifieke gevallen - CGM worden sinds kort volledig vergoed, en drukken niet meer op het ziekenhuisbudget. Raadpleeg de website van het Zorgininstituut voor de huidige vergoedingscriteria van FGM en CGM (ZIN, 2021;). Diabeteshulpmiddelen (Zvw) | Verzekerde zorg | Zorginstituut Nederland De beperkte vergoeding van CGM is éen van de aandachtspunten voor de implementatie van de aanbevelingen in de richtlijn. Ook voor de vergoeding van (semi) gesloten systemen zijn inmiddels goede afspraken gemaakt: de vergoeding van CSII is over het algemeen goed geregeld, en de bijbehorende sensortechnologie wordt inmiddels ook buiten het ziekenhuisbudget om gefinancierd. Patiënt en behandelaar lopen nog wel aan tegen het probleem van de voortschrijdende technologie: zo vergoedt de verzekeraar meestal een nieuwe insulinepomp na 4 jaar, terwijl er bijvoorbeeld na 2 jaar al een geavanceerder (semi) gesloten systeem op de markt komt waar de patiënt gebruik van zou willen maken. Zoals al eerder aangegeven is de keuze van een bepaalde vorm van insulinebehandeling in combinatie met een bepaalde vorm van glucosecontrole individueel bepaald. Niet iedere patiënt is even geschikt voor iedere behandelvorm. De complexiteit van de techniek, maar ook het vermogen om te kunnen rekenen met koolhydraten, kunnen beperkende factoren zijn, bijvoorbeeld bij ouderen of mensen met een laag opleidingsniveau. Ook andere factoren zoals taal of cultuur kunnen de communicatie tussen zorgverlener, patiënt en familie bemoeilijken, hetgeen van invloed kan zijn op het maken van een keuze. Mogelijk kan een deel van deze beperkingen worden verminderd door hulpverleners met speciale expertise en/of een migratie-achtergrond.
Rationale van de aanbeveling: weging van argumenten voor en tegen de interventies
Op basis van de literatuuranalyse komt de werkgroep tot de conclusie dat er aanwijzingen zijn dat FGM en CGM voordelen bieden ten opzichte van SMBG, en dat (semi) gesloten systemen voordelen bieden ten opzichte van FGM en CGM. De voordelen zijn het duidelijkst voor HbA1c, TIR (tijd binnen glucose-streefwaarden) en afname van hypoglykemie frequentie. Eerder onderzoek (DCCT, 1993) heeft laten zien dat verlaging van het HbA1c geassocieerd is met minder microvasculaire complicaties. De werkgroep is dan ook van mening dat het op basis van een betere glucosecontrole (HbA1c dichter bij streefwaarde en glucose langer binnen de glucose-streefwaarden), aannemelijk is dat FGM en CGM, en met name (semi) gesloten systemen, belangrijke winst opleveren voor de patiënt. Ook op theoretische gronden bieden FGM, CGM en (semi) gesloten systemen de patiënt een betere controle over de bloedglucose waarden dan SMBG. Daarnaast vormt SMBG (vingerprikken en stripjes) in het algemeen een grotere belasting voor de patiënt. De directe kosten zijn hoger voor CGM dan voor FGM, en het hoogst voor (semi-)gesloten systemen. Tenslotte is het gebruik van FGM eenvoudiger dan het gebruik van CGM of een (semi-)gesloten systeem, een factor die vooral belangrijk is bij behandeling net na de diagnose DM1.
Omdat de waarde die patiënten hechten aan de voordelen en nadelen van genoemde behandelopties zal variëren, en de persoonlijke voorkeuren van patiënten een belangrijke rol spelen in de gezamenlijke behandelbeslissing, komt de werkgroep tot een conditionele aanbeveling. De werkgroep adviseert om de keuze voor glucosecontrole en insulinebehandeling te bepalen in nauwe samenspraak met het diabetesbehandelteam en de patiënt, bij voorkeur te starten met FGM als vorm van glucosecontrole, en vervolgbeleid af te stemmen op de individuele behandeldoelen van de patiënt. Er kunnen redenen zijn om met CGM te starten in plaats van FGM, zo zijn er aanwijzingen dat CGM voordelen biedt ten opzichte van FGM (zonder alarm) bij personen met verminderde hypoglykemie awareness (Reddy, 2018). Onder voorwaarde van voldoende motivatie en inzet van de patiënt, kan een (semi) gesloten systeem worden overwogen als de behandeldoelen niet worden gehaald. Naast individuele behandeldoelen zijn duidelijke afspraken met de patiënt over eigen verantwoordelijkheden en verplichtingen van groot belang, net als het regelmatig evalueren van de behandeling.
Onderbouwing
Zelfmanagement is de hoeksteen van de behandeling van diabetes mellitus type 1 met meermaal daags insuline of een insulinepomp. Een voorwaarde hiervoor is dat men op de hoogte is van de glucosewaarde in het lichaam. Met vingerprikken met meting van glucose in capillair bloed (‘self monitoring of blood glucose’, SMBG) wordt weliswaar een redelijk betrouwbare meting verkregen, maar dit is slechts een momentopname. Bovendien kost vingerprikken tijd en wordt ze als onaangenaam ervaren. Met continue glucose monitoring (CGM) of flash glucose monitoring (FGM) wordt de glucose concentratie in het onderhuids weefsel elke 5 tot 15 minuten bijgehouden. Deze waarden komen goed overeen met de glucose waarden van ongeveer 8 tot maximaal 15 minuten eerder gemeten in het bloed. Hierdoor kan de glucose met minder moeite elk moment worden gecontroleerd en wordt de trend van de glucosewaarden zichtbaar. Dat geeft meer inzicht in de regulatie en zou anticiperen op mogelijke veranderingen eenvoudiger kunnen maken. Op dit moment worden veel patiënten met DM 1 behandeld met een insulinepomp (CSII; continuous subcutaneous insulin infusion) en beschikken zij tevens over een glucosesensor (CGM, FGM). Technologische vooruitgang heeft het mogelijk gemaakt om de glucosesensor te koppelen aan de insulinepomp waardoor de insulinepomp de insulinetoediening kan aanpassen aan de gemeten glucosewaarde. De eerste ontwikkelingen betreffen het staken of verlagen van de insulinetoediening bij een relevante daling van de glucosewaarde om hypo’s te voorkomen. Een tweede ontwikkeling is het ophogen van de insulinetoediening bij een (verwachte) stijging van de glucosewaarde (semi-closed loop systemen). Door deze technologie verwacht men dat bij DM1 patiënten de glucosewaarden minder vaak te laag of te hoog zijn dan voorheen toen patiënten zelf hun insulinedoseringen moesten aanpassen aan gevonden glucosewaarden. Uiteindelijk is de verwachting dat personen met DM1 gebruik zullen kunnen maken van een volledig gesloten systeem, ook wel aangeduid als kunstmatige alvleesklier, waarbij de glucosewaarden zonder interventie van de patiënt door afwisselende toediening van insuline en glucagon binnen het streefgebied blijven.
Een nadeel van de glucosesensoren is dat de glucose niet in bloed wordt gemeten en hierop ongeveer 15 minuten achterloopt. Bovendien zijn CGM en FGM, en semi-closed loop (hybrid closed loop) systemen, duurder dan SMBG. Daarom is het belangrijk dat er een meerwaarde is voor deze apparaten, zowel op het gebied van de glucoseregulatie (HbA1c, hypoglykemie, glucoseschommelingen) als op kwaliteit van leven en overige uitkomsten (bijvoorbeeld arbeidsparticipatie, ziekenhuisopnamen). Gezien de nog beperkte beschikbaarheid van onderzoeksresultaten met betrekking tot volledig gesloten systemen heeft de werkgroep deze systemen niet geïncludeerd in de uitgangsvraag. Ook systemen waarbij patiënten zelf een koppeling maken tussen CGM/FGM en CSII (“do it yourself looping”) zijn niet onderzocht.
Pease (2020a) did not report on the critical outcome measures depression, hospital admission, nocturnal hypoglycemia, hypo-unawareness and frequency of blood glucose measurements nor on the important outcome measures absenteeism and costs. Therefore, no conclusions can be drawn for these outcome measures.
HbA1c (crucial outcome measure)
SMBG versus CGM
|
Low1 GRADE |
Using CGM for glucose monitoring may result in little to no reduction of HbA1c levels, compared to using SMBG, in adults with DM1.
Sources: (Pease, 2020a) |
FGM versus SMBG
|
Low2 GRADE |
Using FGM for glucose monitoring may result in little to no reduction in HbA1c levels, compared to using SMBG, in adults with DM1.
Sources: (Pease, 2020a) |
FGM versus CGM
|
Low3 GRADE |
Using CGM for glucose monitoring may result in little to no reduction of HbA1c levels, compared to using FGM, in adults with DM1.
Sources: (Pease, 2020a) |
CGM/FGM versus integrated
|
Low4 GRADE |
Using an integrated system for glucose monitoring and insulin delivery may result in a greater reduction in HbA1c levels, compared to using CGM or FGM, in adults with DM1.
Sources: (Pease, 2020a) |
Hypoglycemia (crucial outcome measure)
SMBG versus CGM
|
Very low5 GRADE |
The evidence is very uncertain about the effect is of using CGM for glucose monitoring on the outcome measure non-severe hypoglycemia compared to using SMBG, in adults with DM1.
Sources: (Pease, 2020a) |
FGM versus SMBG
|
Low6 GRADE |
Using FGM for glucose monitoring may result in little to no reduction in episodes of non-severe hypoglycemia compared to using SMBG, in adults with DM1.
Sources: (Pease, 2020a) |
FGM versus CGM
|
Very low7 GRADE |
The evidence is very uncertain about the effect of using FGM for glucose monitoring on the outcome measure non-severe hypoglycemia compared to using CGM, in adults with DM1.
Sources: (Pease, 2020a) |
CGM/FGM versus integrated
|
Very low8 GRADE |
The evidence is very uncertain about the effect of using an integrated system for glucose monitoring and insulin delivery on the outcome measure non-severe hypoglycemia compared to using CGM or FGM, in adults with DM1.
Sources: (Pease, 2020a) |
Severe hypoglycemia (crucial outcome measure)
SMBG versus CGM
|
Very low9 GRADE |
The evidence is very uncertain about the effect of using CGM for glucose monitoring on the incidence of severe hypoglycemic events compared to using SMBG, in adults with DM1.
Sources: (Pease, 2020a) |
FGM versus SMBG
|
Very low10 GRADE |
The evidence is very uncertain about the effect of using FGM for glucose monitoring on the incidence of severe hypoglycemic events compared to using SMBG, in adults with DM1.
Sources: (Pease, 2020a) |
FGM versus CGM
|
Very low11 GRADE |
The evidence is very uncertain about the effect of using FGM for glucose monitoring on the incidence of severe hypoglycemic events compared to using CGM, in adults with DM1.
Sources: (Pease, 2020a) |
CGM/FGM versus integrated
|
Very low12 GRADE |
The evidence is very uncertain about the effect of using an integrated system for glucose monitoring and insulin delivery on the incidence of severe hypoglycemic events compared to using CGM or FGM, in adults with DM1.
Sources: (Pease, 2020a) |
Quality of life (crucial outcome measure)
SMBG versus CGM
|
Very low13 GRADE |
The evidence is very uncertain about the effect of using CGM for glucose monitoring on the outcome measure quality of life compared to using SMBG, in adults with DM1.
Sources: (Pease, 2020a) |
FGM versus SMBG
|
Very low14 GRADE |
The evidence is very uncertain about the effect of using FGM for glucose monitoring on the outcome measure quality of life compared to using SMBG, in adults with DM1.
Sources: (Pease, 2020a) |
FGM versus CGM
|
Very low15 GRADE |
The evidence is very uncertain about the effect of using FGM for glucose monitoring on the outcome measure quality of life compared to using CGM, in adults with DM1.
Sources: (Pease, 2020a) |
CGM/FGM versus integrated
|
-16 GRADE |
Due to lack of data, it was not possible to draw a conclusion on the effect of using an integrated system for glucose monitoring and insulin delivery on the outcome measure quality of life compared to using CGM or FGM, in adults with DM1.
Sources: (Pease, 2020a) |
Ketoacidosis (crucial outcome measure)
All comparisons
|
-17 GRADE |
Due to insufficient evidence (lack of statistical power; few events), it was not possible to draw conclusions for the outcome measure episodes of ketoacidosis, comparing SMBG, CGM, FGM and integrated systems, in adults with DM1.
Sources: (Pease, 2020a) |
Fear of hypoglycemia (crucial outcome measure)
SMBG versus CGM
|
Very low18 GRADE |
The evidence is very uncertain about the effect of using CGM for monitoring glucose levels on the outcome measure fear of hypoglycemia compared to using SMBG, in adults with DM1.
Sources: (Pease, 2020a) |
FGM versus SMBG
|
Very low19 GRADE |
The evidence is very uncertain about the effect of using FGM for monitoring glucose levels on the outcome measure fear of hypoglycemia compared to using SMBG, in adults with DM1.
Sources: (Pease, 2020a) |
FGM versus CGM
|
Very low20 GRADE |
The evidence is very uncertain about the effect of using FGM for monitoring glucose levels on the outcome measure fear of hypoglycemia compared to using CGM, in adults with DM1.
Sources: (Pease, 2020a) |
CGM/FGM versus integrated
|
Very low21 GRADE |
The evidence is very uncertain about the effect of using an integrated system for glucose monitoring and insulin delivery on the outcome measure fear of hypoglycemia compared to using CGM or FGM, in adults with DM1.
Sources: (Pease, 2020a) |
Time in target range of blood glucose (crucial outcome measure)
SMBG versus CGM
|
Low22 GRADE |
Using CGM for glucose monitoring may result in more time in target range of blood glucose, compared to using SMBG, in adults with DM1.
Sources: (Pease, 2020a) |
FGM versus SMBG
|
Low23 GRADE |
Using FGM for glucose monitoring may result in little to no increase in time within the target range of blood glucose, compared to using SMBG, in adults with DM1.
Sources: (Pease, 2020a) |
FGM versus CGM
|
Very low24 GRADE |
The evidence is very uncertain about the effect of using FGM for monitoring glucose levels on the outcome measure time within the target range of blood glucose compared to using CGM, in adults with DM1.
Sources: (Pease, 2020a) |
CGM/FGM versus integrated
|
Low25 GRADE |
Using an integrated system for glucose monitoring and insulin delivery may increase the time within the target range of blood glucose compared to using FGM or CGM, in adults with DM1.
Sources: (Pease, 2020a) |
Other crucial outcome measures (depression, hospital admission, nocturnal hypoglycemia, hypo-unawareness and frequency of blood glucose measurements)
All comparisons
|
- GRADE |
The outcome measures depression, hospital admission, nocturnal hypoglycemia, hypo-unawareness and frequency of blood glucose measurements were not reported.
Sources: (Pease, 2020a) |
Patient satisfaction (important outcome measure)
SMBG versus CGM
|
Very low26 GRADE |
The evidence is very uncertain about the effect of using CGM for glucose monitoring on the outcome measure patient satisfaction compared to using SMBG, in adults with DM1.
Sources: (Pease, 2020a) |
FGM versus SMBG
|
Very low27 GRADE |
The evidence is very uncertain about the effect of using FGM for glucose monitoring on the outcome measure patient satisfaction compared to using SMBG, in adults with DM1.
Sources: (Pease, 2020a) |
FGM versus CGM
|
-28 GRADE |
Due to lack of data, it was not possible to draw a conclusion on the effect of using FGM for glucose monitoring on the outcome measure patient satisfaction compared to using CGM in adults with DM1 (no GRADE).
Sources: (Pease, 2020a) |
CGM/FGM versus integrated
|
Very low29 GRADE |
The evidence is very uncertain about the effect of using an integrated system for glucose monitoring and insulin delivery on the outcome measure patient satisfaction compared to using an CGM or FGM, in adults with DM1.
Sources: (Pease, 2020a) |
Microvascular complications (important outcome measure)
SMBG versus CGM
|
-30 GRADE |
Due to few events, it was not possible to draw a conclusion on the effect of using CGM for glucose monitoring on the outcome measure microvascular complications, compared to using SMBG in adults with DM1.
Sources: (Pease, 2020a) |
FGM versus SMBG
|
-31 GRADE |
Due to lack of data, it was not possible to draw a conclusion on the effect of using FGM for glucose monitoring on the outcome measure microvascular complications, compared to using SMBG in adults with DM1.
Sources: (Pease, 2020a) |
FGM versus CGM
|
-32 GRADE |
Due to lack of data, it was not possible to draw a conclusion on the effect of using FGM for glucose monitoring on the outcome measure microvascular complications, compared to CGM in adults with DM1.
Sources: (Pease, 2020a) |
CGM/FGM versus integrated
|
-33 GRADE |
Due to lack of data, it was not possible to draw a conclusion on the effect of using an integrated system for glucose monitoring and insulin delivery on the outcome measure microvascular complications, compared to using CGM or FGM in adults with DM1.
Sources: (Pease, 2020a) |
Adverse events (important outcome measure)
SMBG versus CGM
|
-34 GRADE |
Due to insufficient data (low statistical power; few events), it was not possible to draw a conclusion on the effect of using CGM for glucose monitoring on the outcome measure adverse events compared to using SMBG in adults with DM1.
Sources: (Pease, 2020a) |
FGM versus SMBG
|
-35 GRADE |
Due to insufficient data (low statistical power; few events), it was not possible to draw a conclusion on the effect of using FGM for glucose monitoring on the outcome measure adverse events, compared to using SMBG in adults with DM1.
Sources: (Pease, 2020a) |
FGM versus CGM
|
-36 GRADE |
Due to insufficient data (low statistical power; few events), it was not possible to draw a conclusion on the effect of using FGM for glucose monitoring on the outcome measure adverse events, compared to CGM in adults with DM1.
Sources: (Pease, 2020a) |
CGM/FGM versus integrated
|
-37 GRADE |
Due to insufficient data (low statistical power; few events), it was not possible to draw a conclusion on the effect of using an integrated system for glucose monitoring and insulin delivery on the outcome measure adverse events, compared to using CGM or FGM in adults with DM1.
Sources: (Pease, 2020a) |
Other important outcome measures (absenteeism and costs)
All comparisons
|
- GRADE |
The outcome measures absenteeism and costs were not reported.
Sources: (Pease, 2020a) |
Description of studies
Pease (2020a) performed a systematic review and network meta-analysis on available self-management technologies for management of DM1, including literature up to April 24, 2019. The investigators searched several databases, including Medline, Medline in-process and other non-indexed citations, EMBASE, PubMed, All Evidence-Based Medicine Reviews, Web of Science, PsycINFO, CINAHL, and PROSPERO. Pease (2020a) included trials which had a duration of at least 6 weeks and which included nonpregnant community dwelling adults with DM1. If data from the trials were not complete and additional correspondence with the authors did not result in additional data, the trials were excluded. In total, 52 RCT’s of parallel or crossover design were included in the network meta-analysis or narrative synthesis, with a total of 3,975 patients. Characteristics of the included studies are described in table 1. Most of the studies were performed in Europe (59%), followed by USA (24%), Canada (10%), UK (12%) and Australia (2%). 78% of the trials received funding or material support from industrial parties. Several methods of insulin delivery, blood glucose monitoring and advising on insulin dosing were compared. These methods include: multiple daily injections (MDI), continuous subcutaneous insulin infusion systems (CSII (low glucose suspend feature, semi closed-loop systems, closed-loop systems)), self-monitoring of blood glucose via capillary testing (SMBG), continuous glucose monitoring (CGM), flash glucose monitors (FGM), insulin bolus calculators (calc) and smart device applications. Risk of bias was assessed using the Cochrane risk of bias tool. Most studies were open-label studies, carrying a high risk of performance bias, due to the lack of blinding. In many instances the method of randomisation (sequence generation and allocation concealment) was unclear. In part of the studies risk of detection bias was high with regard to the outcome measures quality of life and (severe) hypoglycemia. More details on the risk of bias assessment of each individual study can be found in the publication of Pease (2020a). The quality of the evidence was assessed using the GRADE methodology. The outcomes HbA1c, severe hypoglycemia, non-severe hypoglycemia and quality of life were analyzed by performing network meta-analysis. Network meta-analysis uses information from both direct and indirect comparisons between interventions. It is however important to consider that results which are (partly) based on indirect comparisons might be less reliable. In their network meta-analysis Pease (2020a) used group-level data and followed a frequentist approach. Random effect models were used to synthesize the data. Potential effect modifiers like age, diabetes duration and HbA1c were considered to assure transitivity. Other outcome measures were presented as a narrative synthesis, in which only direct comparisons were considered.
Table 1 Characteristics of the included studies (n=52 RCTs) in the review of Pease (2020a)
|
Characteristic |
Result |
|
Sample size (mean±SD) |
78±79 participants |
|
Duration of intervention (mean±SD) |
8±7 months |
|
Age (mean±SD) |
40.2±6.2 years |
|
Baseline HbA1c (mean±SD) |
8.4%±0.8% |
|
Duration of DM1 (years±SD) |
19.5±9.7 years |
Results
One study was included in the literature analysis (Pease, 2020a). Pease (2020a) did not report on the critical outcome measures depression, hospital admission, nocturnal hypoglycemia, hypo-unawareness and frequency of blood glucose measurements nor on the important outcome measures absenteeism and costs.
Pease (2020a) performed a network meta-analysis for the outcome measures HbA1c, severe hypoglycemia, non-severe hypoglycemia and quality of life. Narrative synthesis was performed for the outcome measures ketoacidosis, fear of hypoglycemia, time in target range of blood glucose, patient satisfaction, microvascular complications and adverse events. Since we are interested in the comparisons between SMBG versus CGM, FGM versus SMBG, FGM versus CGM and CGM/FGM versus integrated systems, we restricted our analyses to these comparisons (independent of insulin delivery modalities). Bolus calculator was interpreted as SMBG glucose management system. Note that a separate network meta-analysis (Pease, 2020b) was published after the search date of the current guideline module, analyzing time in target range of blood glucose, the results are briefly discussed in the section ‘Overwegingen’.
HbA1c (crucial outcome measure)
Pease (2020a) included 43 studies that reported on the outcome measure HbA1c. The network plots are shown in Figure 1a and 1b.
Figure 1a (top panel) and figure 1b (lower panel)
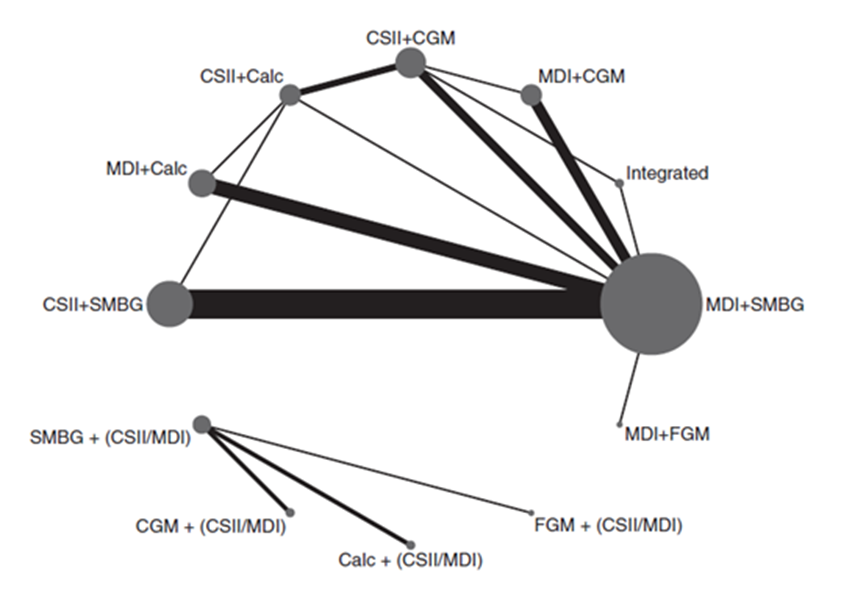
Network plot of diabetes management comparisons comprising the same within-study insulin delivery modalities for the outcome of HbA1c. The network consists of eight interventions (nodes) and 38 RCTS (3,330 participants)
Network plot of diabetes management comparisons comprising the different within-study insulin delivery modalities for the outcome of HbA1c. The network consists of four interventions (nodes) and 5 RCTS (542 participants).
The size of each circle and the width of each line is proportional to respectively the number of participants randomized to each intervention and the number of trials. Calc: bolus calculator; CGM: continuous glucose monitoring; CSII: continuous subcutaneous insulin infusion; FGM: flash glucose monitoring; MDI: multiple daily injections; SMBG: self-monitoring of blood glucose
Results of the network meta-analysis for the outcome measure HbA1c for the different comparison categories (SMBG versus CGM, FGM versus SMBG, FGM versus CGM and CGM/FGM versus integrated systems) are reported in Table 2. Pease (2020a) reported mean differences (95%CI) in HbA1c (%) for several comparisons within the four comparison categories and stratified for studies with same versus different within study group insulin delivery modalities. Since the data on those comparisons are not independent from each other, it was not valid to pool the data.
Most of the included trials had high risk of performance bias because participants and clinicians were not blinded to the intervention. It is however unlikely that this had a relevant influence on the results on the outcome measure HbA1c. However, in part of the trials the method of randomisation (sequence generation and/or allocation concealment) was unclear, which might have led to bias.
SMBG versus CGM
SMBG resulted in higher HbA1c (%) values (smaller HbA1c reductions from baseline) compared to CGM. Mean differences in HbA1c (%) between SMBG and CGM varied between 0.15 and 0.52, in favor of CGM (Table 2a). The difference between MDI+SMBG versus CSII+CGM is statistically significant and clinically relevant (> 0.5%, method of insulin delivery differed also between the treatment groups). None of the other differences reach the threshold for a clinically relevant effect. Assuming that the efficacy of insulin treatment is mainly determined by the quality (timing, frequency) of glucose measurement and not by the method of insulin delivery (MDI or CSII), the results indicate overall that CGM has a consistent advantage over SMBG, although the added value in terms of additional improvement in HbA1c is small and does not reach our threshold for clinical relevance (0.5%).
FGM versus SMBG
SMBG resulted in lower HbA1c (%) values (larger HbA1c reductions from baseline) compared to FGM. Mean differences in HbA1c (%) between SMBG and FGM varied between 0.01 and 0.39, in favor of SMBG (Table 2b). None of these differences reach the threshold for a statistically significant effect or a clinically relevant effect (< 0,5%). Assuming that the efficacy of insulin treatment is mainly determined by the quality (timing, frequency) of glucose measurement and not by the method of insulin delivery (MDI or CSII), the results indicate overall that SMBG has a consistent advantage over FGM, although the added value in terms of additional improvement in HbA1c is small and does not reach our threshold for clinical relevance (0.5%).
FGM versus CGM
FGM resulted in higher HbA1c (%) values (smaller HbA1c reductions from baseline) compared to CGM. Mean differences in HbA1c (%) between FGM and CGM varied between 0.18 and 0.61, in favor of CGM (Table 2c). For the comparisons between MDI+FGM versus MDI+CGM and MDI+FGM versus CSII+CGM those differences are clinically relevant (> 0,5%) and for MDI+FGM versus CSII+CGM also statistically significant. None of the other differences reach the threshold for a clinically relevant effect. Assuming that the efficacy of insulin treatment is mainly determined by the quality (timing, frequency) of glucose measurement and not by the method of insulin delivery (MDI or CSII), the results indicate overall that CGM has a consistent advantage over FGM, although the added value in terms of additional improvement in HbA1c may be relatively small and not reach our threshold for clinical relevance (0.5%).
CGM/FGM versus integrated
CGM or FGM combined with, but not integrated with CSII, or combined with MDI resulted in higher HbA1c (%) values (smaller HbA1c reductions from baseline) compared with integrated systems. Mean differences in HbA1c (%) between FGM or CGM (non-integrated) and integrated systems varied between 0.36 and 0.96, in favor of the integrated system (Table 2d). For the comparison between MDI+FGM versus integrated system this difference was statistically significant and clinically relevant (> 0,5%). None of the other differences reach the threshold for a clinically relevant effect assuming that the efficacy of insulin treatment is mainly determined by the quality (timing, frequency) of glucose measurement and not by the method of insulin delivery (MDI or CSII), the results indicate overall that integrated systems have a consistent advantage over CGM or FGM. The added value of integrated systems in terms of additional improvement in HbA1c might also reach our threshold for clinical relevance (0.5%).
Table 2 Mean difference (network estimate; 95%CI) in the outcome measure HbA1c (%) for different diabetes management comparisons (adapted from Pease (2020a)
|
A) SMBG and CGM |
|||
|
Comparison* |
Mean difference (95%CI) |
Direct comparisons (number of studies) |
Indirect comparisons only |
|
Studies with same within study group insulin delivery modality |
|||
|
CSII+Calc versus CSII+CGM |
0.22 (−0.11 to 0.54) |
2 |
|
|
CSII+SMBG versus CSII+CGM |
0.31 (0.00 to 0.62) |
|
x |
|
MDI+SMBG versus CSII+CGM |
0.52 (0.26 to 0.78) |
4 |
|
|
MDI+Calc versus CSII+CGM |
0.34 (0.01 to 0.66) |
|
x |
|
CSII+Calc versus MDI+CGM |
0.15 (−0.24 to 0.54) |
|
x |
|
CSII+SMBG versus MDI+CGM |
0.25 (−0.04 to 0.53) |
|
x |
|
MDI+Calc versus MDI+CGM |
0.27 (−0.04 to 0.59) |
|
x |
|
MDI+SMBG versus MDI+CGM |
0.45 (0.22 to 0.68) |
3 |
|
|
Studies with different within study group insulin delivery modality |
|||
|
SMBG versus CGM |
0.19 (-0.41 to 0.79) |
2 |
|
|
B) FGM and SMBG |
|||
|
Comparison |
Mean difference (95%CI) |
Direct comparisons (number of studies) |
Indirect comparisons only |
|
Studies with same within study group insulin delivery modality |
|||
|
MDI+FGM versus CSII+Calc |
0.39 (−0.22 to 1.01) |
|
x |
|
MDI+FGM versus CSII+SMBG |
0.29 (−0.25 to 0.84) |
|
x |
|
MDI+FGM versus MDI+SMBG |
0.09 (−0.43 to 0.61) |
1 |
|
|
MDI+FGM versus MDI+Calc |
0.27 (−0.29 to 0.83) |
|
x |
|
Studies with different within study group insulin delivery modality |
|||
|
SMBG versus FGM |
0.01 (-0.65 to 0.67) |
1 |
|
|
C) FGM and CGM |
|||
|
Comparison |
Mean difference (95%CI) |
Direct comparisons (number of studies) |
Indirect comparisons only |
|
Studies with same within study group insulin delivery modality |
|||
|
MDI+FGM versus CSII+CGM |
0.61 (0.03 to 1.19) |
|
x |
|
MDI+FGM versus MDI+CGM |
0.54 (−0.03 to 1.11) |
1 |
|
|
Studies with different within study group insulin delivery modality |
|||
|
FGM versus CGM |
0.18 (-0.71 to 1.07) |
|
x |
|
D) CGM/FGM and integrated |
|||
|
Comparison |
Mean difference (95%CI) |
Direct comparisons (number of studies) |
Indirect comparisons only |
|
Studies with same within study group insulin delivery modality |
|||
|
CSII+CGM versus integrated |
0.36 (−0.19 to 0.90) |
3 |
|
|
MDI+CGM versus integrated |
0.42 (−0.17 to 1.02) |
|
x |
|
MDI+FGM versus integrated |
0.96 (0.20 to 1.72) |
|
x |
CGM: continuous glucose monitoring; CSII: continuous subcutaneous insulin infusion; FGM: flash glucose monitoring; MDI: multiple daily injections; SMBG: self-monitoring of blood glucose.*The intervention which is mentioned secondly is the reference category, for example for the comparison CSII+Calc versus CSII+CGM, CSII+CGM is the reference category. Values in bold are statistically significant (p<0.05)
Ranking of technologies
Network meta-analysis offers the unique possibility to rank the competing interventions. The surface under the cumulative ranking curve (SUCRA) value may be seen as the percentage of effectiveness (or safety) a treatment achieves in relation to an imaginary treatment that is always the best without any uncertainty. The higher the SUCRA value, and the closer to 100%, the higher the likelihood that an intervention is in the top rank or one of the top ranks among the competing interventions. Note that the evidence on which the SUCRA rankings are based is of low certainty and therefore rankings should be interpreted with caution.
Ranking interventions by HbA1c reduction favored integrated systems (SUCRA=96), CSII with standalone CGM (SUCRA=80), MDI with CGM (SUCRA=73), and CSII with bolus calculators (SUCRA=53).
Hypoglycemia (crucial outcome measure)
Pease (2020a) included 19 studies that reported on the outcome measure non-severe hypoglycemia, which was defined as hypoglycemic threshold < 3.9mmol/L (70mg/dL). If multiple thresholds were reported, the highest threshold < 3.9mmol/L (70mg/dL) was used. The presence of hypoglycemic symptoms was not required since this information was often not available in the studies. Note that the hypoglycemic threshold used by Pease (2020a) is considerably higher than the threshold of < 3.0 mmol/L defined by the current guideline committee (also see Ratner, 2018). The network plots are shown in Figure 2.
Figure 2
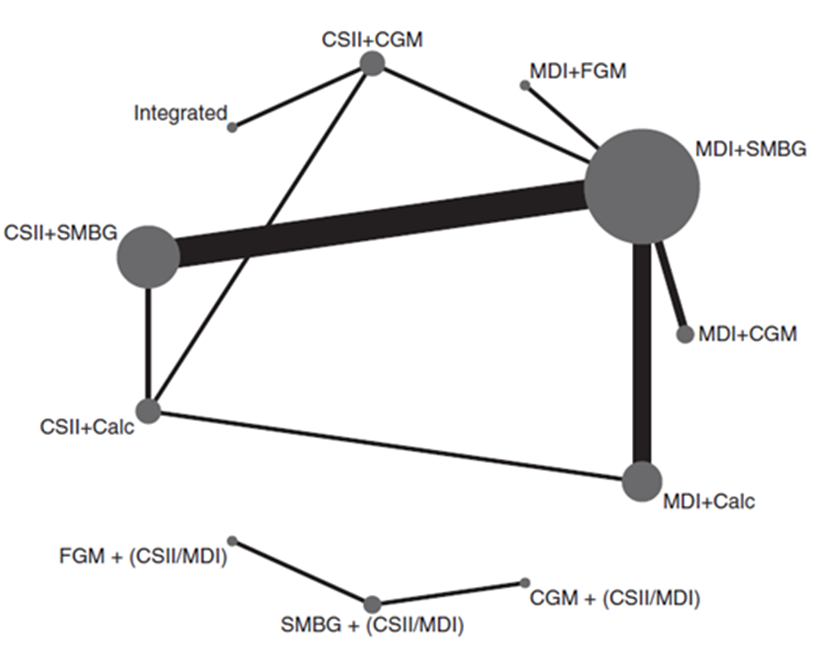
Network plots of diabetes management comparisons for the outcome non-severe hypoglycemia, stratified for studies with same versus different within study group insulin delivery modality (top and lower panel respectively). The networks consist of eight and three interventions (nodes) and 19 RCTS (2,080 participants). Details on number of RCT’s and participants are not reported specifically for the same versus different within-study insulin delivery modalities. The size of each circle and the width of each line is proportional to the number of participants randomized in the intervention and the number of trials. Calc: bolus calculator; CGM: continuous glucose monitoring; CSII: continuous subcutaneous insulin infusion; FGM: flash glucose monitoring; MDI: multiple daily injections; SMBG: self-monitoring of blood glucose
Results of the network meta-analysis for the outcome measure non-severe hypoglycemia for the different comparison categories (SMBG versus CGM, FGM versus SMBG, FGM versus CGM and CGM/FGM versus integrated systems) are reported in Table 3. Pease (2020a) reported mean differences (95%CI) in non-severe hypoglycemic events per patients/week for several comparisons within the four comparison categories and stratified for studies with same versus different within study group insulin delivery modalities. Since those comparisons are not independent from each other, it was not valid to pool the data.
Most studies were open-label studies and therefore carrying a high risk of performance bias, due to the lack of blinding. It is likely that this had a large impact on the results on the outcome measure non-severe hypoglycemia. Besides, in part of the trials the method of randomisation (sequence generation and/or allocation concealment) was unclear, which also might have led to bias. Finally, considerable bias may result from the fact that the network meta-analysis combined results from studies using different hypoglycemic thresholds, including studies with high hypoglycemic thresholds (< 3.9 mmol/l) close to the target range of blood glucose (4 to 10 mmol/l).
SMBG versus CGM
The different comparisons between SMBG and CGM revealed inconsistent results. The mean difference in non-severe hypoglycemic events per patient/week between SMBG and CGM varied between -0.27 and 1.65 (Table 3a). Negative values indicate lower number of hypoglycemic events per patient/week for SMBG. It is important to note that CGM may increase the chance of detecting hypoglycemia and result in an overestimation of hypoglycemic events as compared to SMBG. Assuming that the efficacy of insulin treatment is mainly determined by the quality (timing, frequency) of glucose measurement and not by the method of insulin delivery (MDI or CSII), the results indicate overall that CGM has an advantage over SMBG, although the added value in terms of fewer non-severe hypoglycemic events may be relatively small and not reach the threshold for clinical relevance (1 event per patient/week).
FGM versus SMBG
FGM resulted in lower number of hypoglycemic events per patient/week compared to SMBG. The mean difference in non-severe hypoglycemic events per patients/week between FGM and SMBG varied between -0.27 and -0.96, in favor of FGM (Table 3b). It is however likely that patients using FGM checked their glucose levels more frequently compared to patients in the SMBG group. This could have resulted in higher detection rates of hypoglycemic events in the FGM group, compared to the SMBG group. Therefore, it is likely that the difference in number of hypoglycemic events between FGM and SMBG might be even larger, in favor of FGM. Assuming that the efficacy of insulin treatment is mainly determined by the quality (timing, frequency) of glucose measurement and not by the method of insulin delivery (MDI or CSII), the results indicate overall that FGM has a consistent advantage over SMBG, although the added value in terms of fewer non-severe hypoglycemic events may be relatively small and not reach our threshold for clinical relevance (1 event per patient/week).
FGM versus CGM
The different comparisons between FGM and CGM revealed inconsistent results. The mean differences in non-severe hypoglycemic events per patient/week between FGM and CGM were respectively -0.55 (: in favour of FGM) and 0.69 (: in favour of CGM; see Table 3c). It is important to note that CGM may increase the chance of detecting hypoglycemia and result in a slight overestimation of hypoglycemic events as compared to FGM. Although the effect estimates are broad leading to serious imprecision and it remains unclear whether CGM (slightly) reduces the rate of non-severe hypoglycemic events as compared to FGM, or vice versa, the results suggest that the difference in rate of non-severe hypoglycemic events between FGM and CGM may be relatively small and not reach the threshold for clinical relevance (1 event per patient/week).
CGM/FGM versus integrated
The different comparisons between CGM and FGM revealed inconsistent results. The mean differences in non-severe hypoglycemic events per patient/week between CGM/FGM (non-integrated) and integrated systems and varied between -0.64 to 0.60 (Table 3d). Negative values indicate lower number of hypoglycemic events per patient/week for CGM or FGM. Although the effect estimates are broad leading to serious imprecision and it remains unclear whether integrated systems (slightly) reduce the rate of non-severe hypoglycemic events as compared to non-integrated systems (CGM/FGM), the results suggest that the difference in rate of non-severe hypoglycemic events between integrated systems and non-integrated systems (CGM/FGM) may be relatively small and not reach the threshold for clinical relevance (1 event per patient/week).
Table 3 Mean difference (network estimate; 95%CI) in non-severe hypoglycemic events per patient/week for different diabetes management comparisons (adapted from Pease (2020a))
|
A) SMBG and CGM |
|||
|
Comparison* |
Mean difference (95%CI) |
Direct comparisons (number of studies) |
Indirect comparisons only |
|
Studies with same within study group insulin delivery modality |
|||
|
CSII+Calc versus CSII+CGM |
0.42 (−0.86 to 1.69) |
1 |
|
|
CSII+SMBG versus CSII+CGM |
−0.05 (−1.17 to 1.07) |
|
x |
|
MDI+SMBG versus CSII+CGM |
−0.27 (−1.34 to 0.79) |
1 |
|
|
MDI+Calc versus CSII+CGM |
−0.09 (−1.23 to 1.04) |
|
x |
|
CSII+Calc versus MDI+CGM |
1.65 (0.57 to 2.73) |
|
x |
|
CSII+SMBG versus MDI+CGM |
1.18 (0.43 to 1.94) |
|
x |
|
MDI+Calc versus MDI+CGM |
1.14 (0.32 to 1.97) |
|
x |
|
MDI+SMBG versus MDI+CGM |
0.96 (0.30 to 1.63) |
2 |
|
|
Studies with different within study group insulin delivery modality |
|||
|
SMBG versus CGM |
Not reported |
Not reported |
Not reported |
|
B) FGM and SMBG |
|||
|
Comparison |
Mean difference (95%CI) |
Direct comparisons (number of studies) |
Indirect comparisons only |
|
Studies with same within study group insulin delivery modality |
|||
|
MDI+FGM versus CSII+Calc |
−0.96 (−2.13 to 0.20) |
|
x |
|
MDI+FGM versus CSII+SMBG |
−0.50 (−1.36 to 0.37) |
|
x |
|
MDI+FGM versus MDI+SMBG |
-0.27 (−1.07 to 0.52) |
1 |
|
|
MDI+FGM versus MDI+Calc |
−0.45 (−1.38 to 0.48) |
|
x |
|
Studies with different within study group insulin delivery modality |
|||
|
FGM versus SMBG |
Not reported |
Not reported |
Not reported |
|
C) FGM and CGM |
|||
|
Comparison |
Mean difference (95%CI) |
Direct comparisons (number of studies) |
Indirect comparisons only |
|
Studies with same within study group insulin delivery modality |
|||
|
MDI+FGM versus CSII+CGM |
−0.55 (−1.87 to 0.78) |
|
x |
|
MDI+FGM versus MDI+CGM |
0.69 (−0.34 to 1.72) |
|
x |
|
Studies with different within study group insulin delivery modality |
|
|
|
|
FGM versus CGM |
Not reported |
Not reported |
Not reported |
|
D) CGM/FGM and integrated |
|||
|
Comparison |
Mean difference (95%CI) |
Direct comparisons (number of studies) |
Indirect comparisons only |
|
Studies with same within study group insulin delivery modality |
|||
|
CSII+CGM versus integrated |
0.60 (-0.81 to 2.01) |
1 |
|
|
MDI+CGM versus integrated |
−0.64 (−2.53 to 1.25) |
|
x |
|
MDI+FGM versus integrated |
0.05 (−1.88 to 1.99) |
|
x |
CGM: continuous glucose monitoring; CSII: continuous subcutaneous insulin infusion; FGM: flash glucose monitoring; MDI: multiple daily injections; SMBG: self-monitoring of blood glucose.*The intervention which is mentioned secondly is the reference category, for example of the comparison CSII+Calc versus CSII+CGM, CSII+CGM is the reference category. Values in bold are statistically significant (p<0.05)
Ranking of technologies
Ranking technologies by non-severe hypoglycemia rates favored MDI with CGM (SUCRA=95), MDI with FGM (SUCRA=68), and integrated systems comprising low-glucose suspend or hybrid closed-loop therapy (SUCRA=64).
Severe hypoglycemia (crucial outcome measure)
Pease (2020a) included 40 studies that reported on the outcome measure severe hypoglycemia, which was defined as hypoglycemic events requiring third-party assistance. The network plots are shown in Figure 3a and 3b.
Figure 3a and 3b
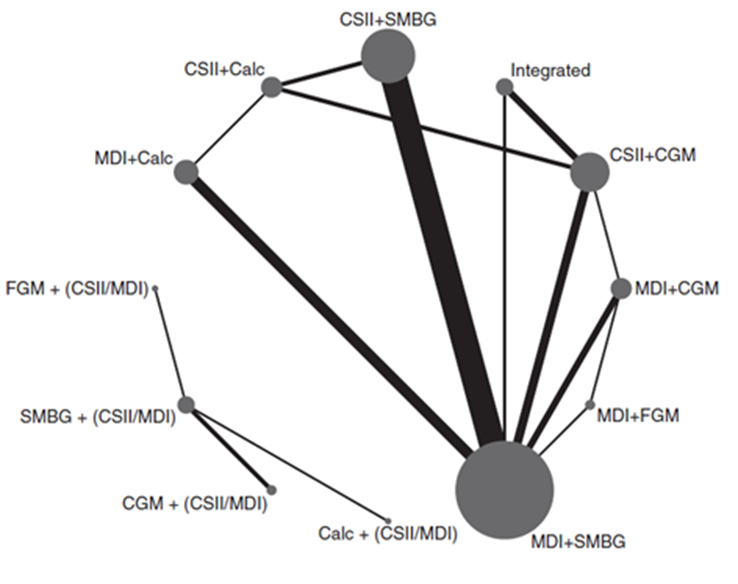
Network plot of diabetes management comparisons comprising the same within-study insulin delivery modalities for the outcome severe hypoglycemia. The network consists of eight interventions (nodes) and 36 RCTs (2,844 person years)
Network plot of diabetes management comparisons comprising different within-study insulin delivery modalities for the outcome severe hypoglycemia. The network consists of four interventions (nodes) and four RCTs (263 person years). The size of the circle is proportional to the number of participants randomised to the intervention and the width of the line is proportional to the number of trials. Calc: bolus calculator; CGM: continuous glucose monitoring; CSII: continuous subcutaneous insulin infusion; FGM: flash glucose monitoring; MDI: multiple daily injections; SMBG: self-monitoring of blood glucose
Results of network meta-analysis for the outcome measure severe hypoglycemia for the different comparison categories (SMBG versus CGM, FGM versus SMBG, FGM versus CGM and CGM/FGM versus integrated systems) are reported in Table 4. Because of the small number of events, a skewed distribution and variation in study length, Pease (2020a) estimated the rate ratio of participants with at least one severe hypoglycemic event per person-year. Pease (2020a) reported the rate ratios (95%CI) for severe hypoglycemia for several comparisons within the four comparison categories and stratified for studies with same versus different within study group insulin delivery modalities. Since those comparisons are not independent from each other, it was not valid to pool the data. Number needed to treat is calculated based on a background risk of 30% on one severe hypoglycemic event per person-year.
In part of the trials the method of randomisation (sequence generation and/or allocation concealment) was unclear, which might have led to bias. In addition, most of the included trials had high risk of performance bias, since blinding of the participants and the clinicians was impossible. It is however unlikely that this had a large influence on the outcome measure severe hypoglycemia.
SMBG versus CGM
The different comparisons between SMBG and CGM revealed inconsistent results. However, the direction of the effect estimates is mainly in favor of CGM. The rate ratio of patients with at least one severe hypoglycemic event per person-year varied between 0.69 and 3.45 (Table 4a). Values < 1 indicate lower rates of patients with at least one severe hypoglycemic event per person-year for SMBG, compared to CGM. Note that the effect estimates are very broad as a result of the low number of severe hypoglycemic events. Assuming that the efficacy of insulin treatment is mainly determined by the quality (timing, frequency) of glucose measurement and not by the method of insulin delivery (MDI or CSII), the overall results might suggest that CGM has an advantage over SMBG. However, all effect estimates are very imprecise and conclusions are very uncertain.
FGM versus SMBG
FGM resulted in lower rates of patients with at least one severe hypoglycemic event per person-year, compared to SMBG. Rate ratios varied between 0.21 and 0.48 (Table 4b), in favor of FGM, but the effect estimates are very broad. Assuming that the efficacy of insulin treatment is mainly determined by the quality (timing, frequency) of glucose measurement and not by the method of insulin delivery (MDI or CSII), the overall results might suggest that FGM has a consistent advantage over SMBG. However, all effect estimates are very imprecise and conclusions are very uncertain.
FGM versus CGM
FGM resulted in lower rates of patients with at least one severe hypoglycemic event per person-year, compared to CGM. Rate ratios were between 0.33 and 0.72 (Table 4c), in favor of FGM, but the effect estimates are very broad. Assuming that the efficacy of insulin treatment is mainly determined by the quality (timing, frequency) of glucose measurement and not by the method of insulin delivery (MDI or CSII), the overall results might suggest that FGM has an advantage over CGM. However, all effect estimates are very imprecise and conclusions are very uncertain.
CGM/FGM versus integrated
The different comparisons between CGM or FGM and integrated systems revealed inconsistent results. The rate ratio of patients with at least one severe hypoglycemic event per person-year varied between 0.43 and 1.32, but the effect estimates are very broad (Table 4d). Values < 1 indicate lower rates of patients with at least one severe hypoglycemic event per person-year for FGM or CGM, compared to integrated systems. Assuming that the efficacy of insulin treatment is mainly determined by the quality (timing, frequency) of glucose measurement and not by the method of insulin delivery (MDI or CSII), the overall results might suggest that FGM or CGM has an advantage over integrated systems. However, all effect estimates are very imprecise and conclusions are very uncertain.
Table 4 Rate Ratios (network estimates; 95%CI) for the outcome measure severe hypoglycemia (per person-year) for different diabetes management comparisons (adapted from Pease (2020a)
|
A) SMBG and CGM |
|||
|
Comparison* |
Rate Ratio (95%CI) |
Direct comparisons (number of studies) |
Indirect comparisons only |
|
Studies with same within study group insulin delivery modality |
|||
|
CSII+Calc versus CSII+CGM |
1.57 (0.57 to 4.33) |
2 |
|
|
CSII+SMBG versus CSII+CGM |
0.69 (0.32 to 1.46) |
|
x |
|
MDI+SMBG versus CSII+CGM |
0.90 (0.48 to 1.67) |
4 |
|
|
MDI+Calc versus CSII+CGM |
1.51 (0.63 to 3.62) |
|
x |
|
CSII+Calc versus MDI+CGM |
3.45 (0.79 to 14.29) |
|
x |
|
CSII+SMBG versus MDI+CGM |
1.52 (0.42 to 5.56) |
|
x |
|
MDI+Calc versus MDI+CGM |
3.33 (0.85 to 12.99) |
|
x |
|
MDI+SMBG versus MDI+CGM |
1.97 (0.59 to 6.58) |
3 |
|
|
Studies with different within study group insulin delivery modality |
|||
|
SMBG versus CGM |
Not reported |
2 |
x |
|
B) FGM and SMBG |
|||
|
Comparison |
Rate Ratio (95%CI) |
Direct comparisons (number of studies) |
Indirect comparisons only |
|
Studies with same within study group insulin delivery modality |
|||
|
MDI+FGM versus CSII+Calc |
0.21 (0.02 to 1.80) |
|
x |
|
MDI+FGM versus CSII+SMBG |
0.48 (0.06 to 3.65) |
|
x |
|
MDI+FGM versus MDI+SMBG |
0.37 (0.05 to 2.63) |
1 |
|
|
MDI+FGM versus MDI+Calc |
0.22 (0.03 to 1.74) |
|
x |
|
Studies with different within study group insulin delivery modality |
|||
|
FGM versus SMBG |
Not reported |
1 |
x |
|
C) FGM and CGM |
|||
|
Comparison |
Rate Ratio (95%CI) |
Direct comparisons (number of studies) |
Indirect comparisons only |
|
Studies with same within study group insulin delivery modality |
|||
|
MDI+FGM versus CSII+CGM |
0.33 (0.04 to 2.61) |
|
x |
|
MDI+FGM versus MDI+CGM |
0.72 (0.08 to 6.25) |
1 |
|
|
Studies with different within study group insulin delivery modality |
|||
|
FGM versus CGM |
Not reported |
|
x |
|
D) CGM/FGM and integrated |
|||
|
Comparison |
Rate Ratio (95%CI) |
Direct comparisons (number of studies) |
Indirect comparisons only |
|
Studies with same within study group insulin delivery modality |
|||
|
CSII+CGM versus integrated |
1.32 (0.23 to 7.69) |
3 |
|
|
MDI+CGM versus integrated |
0.60 (0.07 to 5.03) |
|
x |
|
MDI+FGM versus integrated |
0.43 (0.03 to 6.15) |
Not reported |
Not reported |
CGM: continuous glucose monitoring; CSII: continuous subcutaneous insulin infusion; FGM: flash glucose monitoring; MDI: multiple daily injections; SMBG: self-monitoring of blood glucose. *The intervention which is mentioned secondly is the reference category, for example of the comparison CSII+Calc versus CSII+CGM, CSII+CGM is the reference category. None of the values are statistically significant (p<0.05)
Ranking of technologies
Similar ranking values were found for MDI with FGM or CGM (SUCRA=80 and 78, respectively), CSII with SMBG (SUCRA=67), as well as integrated CSII and CGM systems (SUCRA=53.7).
Quality of life (crucial outcome measure)
Pease (2020a) included 14 studies which reported on health-related quality of life, as measured with a validated tool (for example Diabetes Quality of Life measure (DQOL), SF-36, SF-12). The network plots are shown in Figure 4.
Figure 4
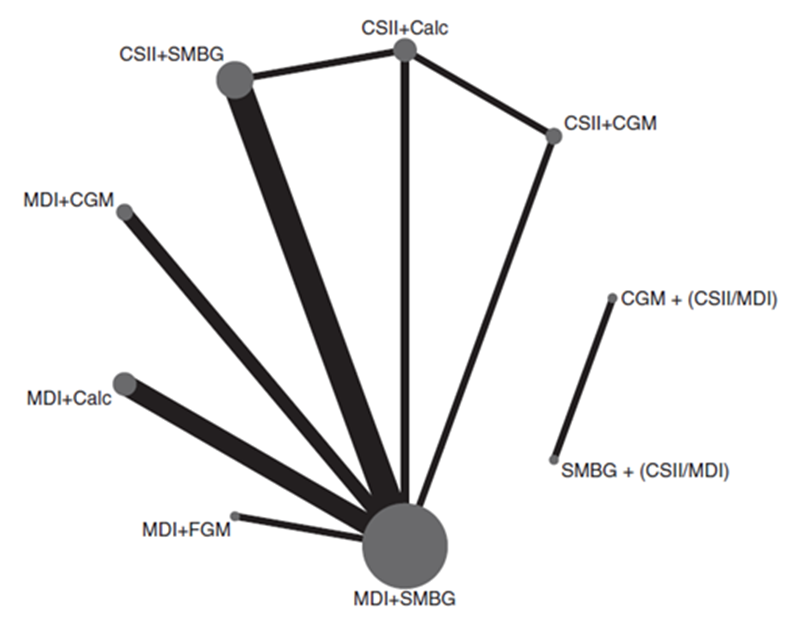
Network plots of diabetes management comparisons for the outcome quality of life, stratified for studies with same versus different within study group insulin delivery modality. The networks consist of seven and two interventions (nodes) respectively, a total of 14 RCTS (1,499 participants). Details on number of RCTs and participants are not reported specifically for the same versus different within-study insulin delivery modalities. The size of each circle and the width of each line is proportional to the number of participants randomized to each intervention and the number of trials. Calc: bolus calculator; CGM: continuous glucose monitoring; CSII: continuous subcutaneous insulin infusion; FGM: flash glucose monitoring; MDI: multiple daily injections; SMBG: self-monitoring of blood glucose
Results of network meta-analysis for the outcome measure quality of life for the different comparison categories (SMBG versus CGM, FGM versus SMBG, FGM versus CGM and CGM/FGM versus integrated systems) are reported in Table 5. Pease (2020a) estimated standardized mean difference, after correction for the direction of the different QoL scoring instruments. Higher scores indicate higher levels of reported quality of life. Pease (2020a) reported standardized mean difference (95%CI) for quality of life for several comparisons within the four comparison categories and stratified for studies with same versus different within study group insulin delivery modalities. Since those comparisons are not independent from each other, it was not valid to pool the data.
Most of the included trials had high risk of performance bias, since blinding of the participants and the clinicians was lacking. This might have had a large impact on the results on the outcome measure quality of life. Besides, in part of the trials the method of randomisation (sequence generation and/or allocation concealment) was unclear. Finally, bias may result from the fact that the network meta-analysis combined results from different QoL instruments. There is no consensus on the most accurate or representative tool to assess QoL, and the quality of life of the participants at the start of the trials is likely to be high i.e. there may be little room for improvement in QoL scores.
SMBG versus CGM
The standardized mean differences in quality of life between SMBG and CGM varied between -0.70 and 0.05 (Table 5a). Negative values indicate lower levels of reported quality of life for SMBG, compared to CGM. For the comparison MDI+SMBG versus MDI+CGM this standardized mean difference is statistically significant and clinically relevant (> 0,5). None of the other differences reach the threshold for a clinically relevant effect. Assuming that the efficacy of insulin treatment is mainly determined by the quality (timing, frequency) of glucose measurement and not by the method of insulin delivery (MDI or CSII), the results indicate overall that CGM has an advantage over SMBG, although the added value in terms of additional improvement in measured health-related quality of life is relatively small and may not reach our threshold for clinical relevance. The results should be interpreted with caution due to high risk of bias in the included trials. The trials were not blinded, which might have led to an overestimation of quality of life in the CGM group as compared to the SMBG group.
FGM versus SMBG
FGM resulted in higher levels of reported quality of life, compared to SMBG. Standardized mean differences in quality of life varied between 0.11 and 0.44, in favor of FGM (Table 5b). None of the differences are statistically significant or reach the threshold for a clinically relevant effect (< 0.5). Assuming that the efficacy of insulin treatment is mainly determined by the quality (timing, frequency) of glucose measurement and not by the method of insulin delivery (MDI or CSII), the results indicate overall that FGM has an advantage over SMBG, although the added value in terms of additional improvement in measured health-related quality of life is relatively small and generally does not reach our threshold for clinical relevance. The results should be interpreted with caution due to high risk of bias in the included trials. The trials were not blinded, which might have led to an overestimation of quality of life in the FGM group as compared to the SMBG group.
FGM versus CGM
The standardized mean differences in reported quality of life between FGM and CGM were respectively 0.16 and -0.26 (Table 5c). Negative values indicate lower levels of reported quality of life for FGM, compared to CGM. None of the differences are statistically significant or reach the threshold for a clinically relevant effect (< 0.5), and the confidence intervals are broad.
CGM/FGM versus integrated
None of the included studies reported on the outcome measure quality of life for the comparison between CGM or FGM and integrated systems.
Table 5 Standardized mean differences (network estimates; 95%CI) for the outcome measure quality of life for different diabetes management comparisons (adapted from Pease (2020a))
|
A) SMBG and CGM |
|||
|
Comparison* |
Standardized mean difference (95%CI) |
Direct comparisons (number of studies) |
Indirect comparisons only |
|
Studies with same within study group insulin delivery modality |
|||
|
CSII+Calc versus CSII+CGM |
0.05 (−0.67 to 0.77) |
1 |
|
|
CSII+SMBG versus CSII+CGM |
−0.05 (−0.76 to 0.65) |
|
x |
|
MDI+SMBG versus CSII+CGM |
−0.28 (−0.90 to 0.35) |
1 |
|
|
MDI+Calc versus CSII+CGM |
−0.21 (−0.99 to 0.57) |
|
x |
|
CSII+Calc versus MDI+CGM |
-0.37 (−1.10 to 0.36) |
|
x |
|
CSII+SMBG versus MDI+CGM |
-0.48 (−1.05 to 0.10) |
|
x |
|
MDI+Calc versus MDI+CGM |
−0.63 (−1.28 to 0.02) |
|
x |
|
MDI+SMBG versus MDI+CGM |
−0.70 (−1.15 to −0.25) |
2 |
|
|
Studies with different within study group insulin delivery modality |
|||
|
SMBG versus CGM |
Not reported |
Not reported |
Not reported |
|
B) FGM and SMBG |
|||
|
Comparison |
Standardized mean difference (95%CI) |
Direct comparisons (number of studies) |
Indirect comparisons only |
|
Studies with same within study group insulin delivery modality |
|||
|
MDI+FGM versus CSII+Calc |
0.11 (−0.75 to 0.98) |
|
x |
|
MDI+FGM versus CSII+SMBG |
0.22 (−0.52 to 0.96) |
|
x |
|
MDI+FGM versus MDI+SMBG |
0.44 (−0.20 to 1.08) |
|
x |
|
MDI+FGM versus MDI+Calc |
0.37 (−0.42 to 1.16) |
|
x |
|
Studies with different within study group insulin delivery modality |
|||
|
FGM versus SMBG |
Not reported |
Not reported |
Not reported |
|
C) FGM and CGM |
|||
|
Comparison |
Standardized mean difference (95%CI) |
Direct comparisons (number of studies) |
Indirect comparisons only |
|
Studies with same within study group insulin delivery modality |
|||
|
MDI+FGM versus CSII+CGM |
0.16 (−0.73 to 1.06) |
|
x |
|
MDI+FGM versus MDI+CGM |
−0.26 (−1.04 to 0.52) |
1 |
|
|
Studies with different within study group insulin delivery modality |
|||
|
FGM versus CGM |
Not reported |
Not reported |
Not reported |
|
D) CGM/FGM and integrated |
|||
|
Comparison |
Standardized mean difference (95%CI) |
Direct comparisons (number of studies) |
Indirect comparisons only |
|
Studies with same within study group insulin delivery modality |
|||
|
CSII+CGM versus integrated |
No data |
No data |
No data |
|
MDI+CGM versus integrated |
No data |
No data |
No data |
|
MDI+FGM versus integrated |
No data |
No data |
No data |
CGM: continuous glucose monitoring; CSII: continuous subcutaneous insulin infusion; FGM: flash glucose monitoring; MDI: multiple daily injections; SMBG: self-monitoring of blood glucose.*The intervention which is mentioned secondly is the reference category, for example of the comparison CSII+Calc versus CSII+CGM, CSII+CGM is the reference category. Values in bold are statistically significant (p<0.05)
Ranking of technologies
Ranking technologies for QoL favored MDI with CGM (SUCRA=89), MDI with FGM (SUCRA=66), CSII with insulin advisors (SUCRA=56), as well as CSII with standalone CGM (SUCRA=50).
Ketoacidosis (crucial outcome measure)
Pease (2020a) performed a narrative synthesis for the outcome measure ketoacidosis (DKA). In most of the studies, DKA was not reported as an outcome measure. Furthermore, most of the studies which reported on DKA did not provide a definition. In the literature analysis, results are stratified for the four comparisons (SMBG versus CGM, FGM versus SMBG, FGM versus CGM and CGM/FGM versus integrated systems) and only evidence from direct comparisons is taken into account.
SMBG versus CGM
Pease (2020a) included twelve studies which reported on the outcome measure ketoacidosis for the comparison between SMBG and CGM (Ajian, 2016; Beck, 2017b; Lind, 2017; van Beers, 2016; JDRF, 2008; Lee, 2007; Peyrot, 2009, Bergenstal, 2010; Hermanides, 2011; Radermecker, 2010; Hirsch, 2008; Tumminia, 2015). In total, there were four episodes of diabetic ketoacidosis in the CGM group, compared to five episodes in the SMBG group. These results indicate that DKA episodes are rare in both intervention groups, but statistical power is insufficient to draw any conclusion on a potential difference in risk of DKA between the interventions.
FGM versus SMBG
Pease (2020a) included two studies which reported on the outcome measure ketoacidosis for the comparison between FGM and SMBG (Bolinder, 2016 and Oskarsson, 2018). In both studies, there were no episodes of DKA reported. Due to lack of data, it is not possible to draw any conclusion on a potential difference in risk of DKA between the interventions.
FGM versus CGM
None of the included studies in Pease (2020a) reported on the outcome measure ketoacidosis for the comparison between FGM and CGM.
CGM/FGM versus integrated
Pease (2020a) included one study which reported on the outcome measure ketoacidosis for the comparison between CGM or FGM and integrated systems (Kropff, 2015). In both groups, there were no episodes of hospital admission for DKA. Due to lack of data, it is not possible to draw any conclusion on a potential difference in risk of DKA between the interventions.
Fear of hypoglycemia (crucial outcome measure)
Pease (2020a) performed a narrative synthesis. In the literature analysis, results are stratified for the four comparison categories and only direct evidence is taken into account. Fear of hypoglycemia was measured using the Hypoglycemia Fear Survey (HFS), with higher scores indicating greater fear of hypoglycemia. The HFS consists of two subscales: 1) worry subscale (18 items, scale 0 to 72) and 2) hypoglycemia avoidant behavior subscale (15 items, scale 0 to 60). It is important to note that some of the studies reported the score on the complete HFS, while other studies reported the scores on one or both of the subscales.
All of the included trials had high risk of performance bias because participants and clinicians were not blinded to the intervention. This might have had a large impact on the results on the outcome measure fear of hypoglycemia. Furthermore, in part of the trials the method of randomisation (sequence generation and/or allocation concealment) was unclear, which might have led to bias.
SMBG versus CGM
Pease (2020a) included eight studies which reported on fear of hypoglycemia for the comparison between SMBG and CGM (Hermanides, 2011; Rubin, 2012; JDRF, 2010b; Markowitz, 2012; van Beers, 2016; Heinemann, 2018; Lind, 2017; Polonsky, 2017). Results of the narrative syntheses are reported in Table 6. Data in most of the studies (5 out of 8 studies) suggest more fear of hypoglycemia in the SMBG group, compared to the CGM group, two studies found no difference and one study reported less fear of hypoglycemia in the SMBG group. Differences in HFS scores were generally small and might not reach the threshold for a clinically relevant effect. Results of these studies should be interpreted with caution due to high risk of bias in the included trials. The trials were not blinded, which might have led to underestimation of anxiety levels in the CGM group.
Table 6 Results of the narrative synthesis on the outcome measure fear of hypoglycemia, for the comparison between CGM and SMBG (Adapted from Pease (2020a))
|
Study |
N |
Outcome measure |
CGM |
SMBG |
Difference between groups/conclusion authors |
In favor of CGM or SMBG* |
|
Hermanides, 2011 |
CGM: 41 SMBG: 36 |
HFS worry-subscale: between group difference in change from baseline |
Not reported |
Not reported |
‘No difference between groups was noted for the HFS scales.’ |
No difference |
|
Rubin, 2012 |
CGM: NR SMBG: NR Total: 334 |
HFS-II (Hypoglycemia 1) worry and hypoglycemia 2) avoidant behavior) |
1) Change -6.36, P<0.001 2) Change -2.30 P<0.001
|
1) Change -1.87 2) Change -0.52
|
1) Between group difference: 4.49 points; P<0.001 2) Between group difference 1.78 points; P<0.01
|
CGM |
|
JDRF, 2010b |
CGM: 52 SMBG: 46 |
HFS |
Not reported |
Not reported |
‘At 26 weeks, there was a slight (P< 0.05) improvement favoring the CGM group for the HFS total score and HFS behavior subscale.’ |
CGM |
|
Markowitz, 2012 |
CGM/SMBG: NR Total: 49 |
HFS (mean (SD))
|
32.0 (8.3)
|
24.8 (12.2)
|
Between group difference was not reported
|
SMBG |
|
Van Beers, 2016 |
CGM: 26 SMBG: 26 |
HFS worry- subscale |
32.5 (transformed to a 0–100 scale) |
38.9 (transformed to a 0–100 scale) |
Mean difference (95%CI): 6.4 points (1.4–11.4); P=0.014). |
CGM |
|
Heinemann, 2018 |
CGM: 75 SMBG: 74 |
HFS: 1) baseline and 2) end of study |
1) 53.0 (37.1 to 69.8) 2) 37.0 (24.0 to 51.0) end
|
1) 55.0 (35.0 to 65.0) 2) 42.2 (24.5 to 59.0)
|
Adjusted between group difference: P=0.0771
|
CGM
|
|
Polonsky, 2017 |
CGM: 105 SMBG: 53 |
HFS worry- subscale 1(baseline and 2) end of study |
1) 15.75 (12.30) 2) 13.48 (10.63) |
1) 17.30 (13.22) 2) 17.73 (14.92) |
‘The worry sub-scale of the HFS-II was not significantly different between groups.’ |
CGM |
|
Lind, 2017 |
CGM: 69 SMBG: 73 |
Hypoglycemic Fear Behavior Scale (mean (95%CI)) |
1.93 (1.83 to 2.03) |
1.91 (1.81 to 2.00)
|
Between group difference P=0.45 |
No difference |
* The results in this column are based on the direction of the effect estimates and does not take into account whether this difference is statistically significant or clinically relevant
FGM versus SMBG
Pease (2020a) included two studies (Bolinder, 2016 and Oskarsson, 2018). Oskarsson (2018) included 81 participants in the FGM group and 80 in the SMBG group. They reported that there were no significant between group differences in adjusted means for the HFS outcomes (no details given). Bolinder (2016) included 42 participants in the CGM group and 77 in the SMBG group. They reported that there was no statistically significant difference in HFS-worry subscale scores between the groups (−1.2±1.48; P=0.4). These results suggest no clinically relevant difference in fear of hypoglycemia between patients using FGM in comparison to SMBG. However, results should be interpreted with caution because of a high risk of bias in the trials. The trials were not blinded, which might have led to underestimation of anxiety levels in the FGM group.
FGM versus CGM
Pease (2020a) included one study (Reddy, 2018). In the CGM group (n=20), the within-group difference (95%CI) in HFS total score was -6.5 (-10.8 to -2.2) compared to -2.0 (-3.8 to 2.8) in the FGM group (n=20). The between group difference was in favor of CGM (details not reported, P=0.02). In the CGM group, the within-group difference (95%CI) in HFS worry subscale score was -4.5 (-7.8 to -0.1), compared to 0.5 (-3.0 to 2.8) in the FGM group. The between group difference was in favor of CGM (details not reported, P=0.02). Overall these data suggest lower fear of hypoglycemia in the CGM group, compared to the FGM group. This difference might also reach the threshold for a clinically relevant effect. However, this conclusion is based on a single and relatively small study.
CGM/FGM versus integrated
Pease (2020a) included one study (Kropff, 2017). Kropff (2017) included 32 participants in their cross-over trial. In the integrated group the HFS total score was 23.5±16.7, compared to 23.5±16.6 in the CGM group. For the HFS worry subscale, this score was 11.7±10.1 in the integrated group and 11.6±9.9 in the CGM group. Neither intervention significantly reduced the fear of hypoglycemia (HFS-II total or worry scale) and there was no difference between groups. Overall these results suggest no clinically relevant difference in fear of hypoglycemia between CGM or FGM and integrated systems. However, this conclusion is based on a single and relatively small study.
Time in target range of blood glucose (crucial outcome measure)
Pease (2020a) performed a narrative synthesis on time in target range of blood glucose. In this literature analysis, results are stratified for the four comparison categories and only direct comparisons taken into account. Pease (2020a) defined time in target range of blood glucose as percentage of blood glucose levels in the range of 3.9 mmol/L (70 mg/dL) to 10.0 mmol/L (180 mg/dL) per unit of time.
All of the included trials had high risk of performance bias because participants and clinicians were not blinded to the intervention. It is however unlikely that this had a large impact on the results on the outcome measure time in target range of blood glucose. However, in part of the trials the method of randomisation (sequence generation and/or allocation concealment) was unclear, which might have led to bias.
SMBG versus CGM
Pease (2020a) included seven studies (Battelino, 2012; Ajjan, 2016; Beck, 2017b; van Beers, 2016; Lind, 2017; Heinemann, 2018; JDRF, 2008). Battelino (2012) and Ajjan (2016) did report on time spent in euglycemia, but this was not specifically reported for the adult sub-group (Battelino, 2012) or for the different intervention groups (Ajjan, 2016). Therefore, those studies were not included in our literature analysis. Results of the narrative syntheses are reported in Table 7. Overall, data from the included studies suggest less time in target range of blood glucose in the SMBG group, compared to the CGM group. In the studies of Beck (2017b), van Beers (2016) and JDRF (2008) the differences in time in target range of blood glucose might reach the threshold for a clinically relevant effect.
Table 7 Results of the narrative synthesis on the outcome measure time in target range of blood glucose, for the comparison between CGM and SMBG (adapted from Pease (2020a))
|
Author, year |
N |
Outcome measure |
CGM |
SMBG |
Difference between groups/conclusion authors |
In favor of CGM or SMBG* |
|
Beck, 2017b |
CGM: 105 SMBG: 53
|
Mean (SD) minutes per day within range at 1) baseline and 2) 12 and 24 weeks (pooled) Defined as: 3.9-10mmol/L |
1) 660±179 2) 736±206 |
1) 650±170 2) 650±194
|
Mean adjusted difference between groups 77 min (99% CI: 6, 147); P=0.005.
|
CGM |
|
Van Beers, 2016
|
CGM: 26 SMBG: 26 |
1) Mean (95% CI) percent of time spent in range. 2) Mean (95% CI) time (hours) spent in range. Defined as: 4.0-10mmol/L |
1) 65.0 (62.8 to 67.3) 2) 15.6 (15.1 to 16.2) |
2) 55.4 (53.1 to 57.7) 2) 13.3 (12.7 to 13.8)
|
1) Mean difference 9.6% (8.0, 11.2); P<0.0001 2) Mean difference 2.3 hours (1.9, 2.7); P<0.0001
|
CGM |
|
Lind, 2017
|
CGM: 69 SMBG: 73 |
Mean (SD) percentage of time with glucose levels Defined as: 3.9-10 mmol/L |
42.28±14.95) Median IQR: 41.7 (8.0, 73.8) |
39.81±12.56 Median IQR: 41.0 (8.4, 65.2) |
n.a. |
CGM |
|
Heinemann, 2018
|
CGM: 75 SMBG: 74 |
Mean (SD) percentage time spent with glucose >3.9 and <10.0mmol/L as measured with 1) CGM and 2) SMBG |
1) 58.5±17.7 2) 54.4±16.6 |
1) 56.5±12.2 2) 53.6±12.7
|
1) Adjusted between group difference (95% CI): 3.1% (0.0 to 6.2); P=0.0535 2) Adjusted between group difference (95% CI): 3.4% (-1.0 to 7.9); P=0.1251
|
CGM |
|
JDRF, 2008 |
CGM: 52 SMBG: 46
|
Mean (SD) minutes per day with glucose in range. Defined as: 71-180mg/dL |
854±986 |
811±840
|
Difference between groups: P<0.001
|
CGM |
*The results in this column are based on the direction of the effect estimates (if provided) and does not take into account whether this difference is statistically significant or clinically relevant
FGM versus SMBG
Pease (2020a) included two studies (Bolinder, 2016 and Oskarsson, 2018). Both studies reported on mean time (hours) spent with glucose within target range, which was defined as glucose levels between 3.9 and 10.0 mmol/L. In the study of Bolinder (2016) patients in the FGM group (n=42) spent 15.0±2.5 hours and 15.8±2.9 hours within target range of blood glucose at respectively the start and the end of the study period, compared to respectively 14.8±2.8 and 14.6±2.9 in the SMBG group (n=77). The difference in adjusted means (SD) was 1.0±0.3 hours (P=0.0006). In the study of Oskarsson (2018) patients in the FGM group (n=81) spent 15.0±2.6 hours and 15.7±2.8 hours within target range of blood glucose at respectively the start and the end of the study period, compared to respectively 14.3±2.9 and 14.3±3.0 in the SMBG group (n=80). The difference in adjusted means (95%CI) was 0.9 hours (0.2 to 1.7), in favor of the FGM group. In summary, data from both studies suggest that more time is spent in the target range of blood glucose in the FGM group, compared to the SMBG group. However, the differences in time in target range of blood glucose are small and might not reach the threshold for a clinically relevant effect.
FGM versus CGM
Pease (2020a) included one study (Reddy, 2018). Reddy (2018) reported on the median (IQR) percentage time in range of blood glucose at follow-up, defined as a blood glucose between 3.9 to 10.0 mmol/L. In the CGM group (n=20), median (IQR) percentage of time in range was 65.9 (53.5 to 74.8), compared to 60 (54.5 to 67.8) in the FGM group (n=20). Median change from baseline was 12.7% (7.2 to 11.7) in the CGM group, compared to 5.3% (1.1 to 11.7) in the SMBG group (P=0.05). Data from this study suggest that less time is spend in target range of blood glucose in the FGM group, compared to the CGM group. This difference in time in target range of blood glucose might reach the threshold for a clinically relevant effect. However, this conclusion is based on a single study with a relatively small number of participants.
Integrated versus CGM/FGM
Pease (2020a) included three studies which reported on time in target range of blood glucose for the comparison between an integrated system and CGM (Kropff, 2015, Thabit, 2015; Tauschman, 2018). Kropff (2015) reported on the median (IQR) percentage of time spent within target range of blood glucose, defined as blood glucose within 3.9 to 10.0 mmol/L. In the integrated system group (n=32), median percentage (IQR) of time spent within glucose target range was 63.7 (60.4 to 70.1), compared to 59.4 (56.7 to 64.3) in the CGM group (n=32). Paired difference was 5.0% (3.0 to 6.8, p<0.0001), in favor of the integrated system group. Thabit (2015) reported mean percentage of time within target range of blood glucose, defined as glucose levels between 70 to 180 mg/dL (day and night). In the integrated system group (n=33), mean (SD) percentage of time spent within glucose target range was 67.7±10.6, compared to 56.8±14.2 in the CGM group (n=33). Paired difference was 11.0% (8.1 to 13.8, P<0.001), in favor of the integrated system group. Tauschmann (2018) reported on the mean (SD) change of time-in-range (sensor glucose) from baseline to the end of the study period within the groups. In the integrated system group (n=46) mean improvement in time-in-range from baseline to end of the study period was 11.6±6.9%, compared to 1.6±5.9% in the CGM group (n=40). Overall, these data suggest that more time is spend in target range of blood glucose in the integrated system group, compared to the CGM group. Those differences in time in target range of blood glucose might also reach the threshold for a clinically relevant effect.
Time above target range of blood glucose (crucial outcome measure)
Pease (2020a) did not report on time above target range of blood glucose.
Time below target range of blood glucose (crucial outcome measure)
Pease (2020a) did not report on time below target range of blood glucose.
Patient satisfaction (important outcome measure)
Pease (2020a) performed a narrative synthesis on patient satisfaction. Results are stratified for the four comparison categories, only direct evidence is taken into account. Studies that reported on patient satisfaction using the Diabetes Treatment Satisfaction Questionnaire (DTSQ) were included, both DTSQ - status and DTSQ - change could be used. DTSQ is composed of two different parts. The first part assesses treatment satisfaction with a total score ranging from 0 to 36. Higher scores indicate higher level of treatment satisfaction. The second part focuses on burden of hyper- and hypoglycemia.
All of the included trials had high risk of performance bias because participants and clinicians were not blinded to the intervention. This might have had a large impact on the results on the outcome measure patient satisfaction. Furthermore, in part of the trials the method of randomisation (sequence generation and/or allocation concealment) was unclear, which might have led to bias.
SMBG versus CGM
Pease (2020a) included three studies which reported on patient satisfaction for the comparison between SMBG and CGM (Hermanides, 2011; Ajjan, 2016 and Lind, 2017).
Hermanides (2011) included 41 participants in the CGM group and 36 in the SMBG group. They reported the between group difference in DTSQ change from baseline (version and part of DTSQ not specified). This difference was 8.6 (6.2 to 11.0, P<0.001), in favor of CGM.
Ajjan (2016) reported on the DTSQs and the DTSQc (part not specified). They concluded that there were no statistically significant differences in reported treatment satisfaction between the CGM group (n=29) and the SMBG group (n=13) with regard to overall satisfaction (respectively 12.69 versus 11.61, P= 0.5765). Further details were not reported.
Lind (2017) reported the scores on the DTSQs and the DTSQc (part not specified) for the CGM (n=69) and the SMBG group (n=73). For the DTSQs, the mean score (95%CI) was 30.21 (29.47 to 30.96) in the CGM group, compared to 26.62 (25.61 to 27.64) in the SMBG group. For the DTSQc the mean score (95%CI) was 13.20 (12.13 to 14.28) in the CGM group, compared to 5.97 (3.64, 8.30) in the SMBG group. The differences between the groups were statistically significant (P<0.001). In summary, these data suggest lower levels of treatment satisfaction in the SMBG group, compared to the CGM group. Except for the study of Ajjan (2016) those differences between the groups were statistically significant and might also reach the threshold for a clinically relevant effect. However, results have to be interpreted with caution due to risk of bias in the trials. The trials were not blinded, which might have led to an overestimation of the potential difference in treatment satisfaction between CGM and SMBG, in favor of CGM.
FGM versus SMBG
Pease (2020a) included two studies which reported on patient satisfaction for the comparison between FGM and SMBG (Bolinder, 2016; Oskarsson, 2018). Both studies reported on the first part of the DTSQ (version of DTSQ not specified).
Bolinder (2016) reported that the total treatment satisfaction score showed a statistically significant increase in the FGM group as compared with the SMBG group (6.1 ±0.84; P<0.0001). Further details are not provided.
Oskarsson (2018) reported mean scores on the first part of the DTSQ for FGM (n=80) and SMBG (n=81) at baseline and follow-up. The mean DTSQ score (SD) for FGM at baseline was 28.3±4.7 and 13.3±5.4 at follow-up, compared to a baseline score of 27.7±5.3 and a follow-up score of 6.8 ±6.2 in the SMBG group. Oskarsson (2018) concluded that both groups were less satisfied at follow-up than at baseline, but that the total treatment satisfaction score favored FGM over SMBG. In summary, these data suggest higher levels of treatment satisfaction in the FGM group, compared to the SMBG group. These differences in treatment satisfaction might reach the threshold for a clinically relevant effect. However, results have to be interpreted with caution due to risk of bias in the trials. The trials were not blinded, which might have led to overestimation of the potential difference in treatment satisfaction between FGM and SMBG, in favor of FGM.
FGM versus CGM
Pease (2020a) did not include studies which reported on patient satisfaction for the comparison between FGM and CGM.
CGM/FGM versus integrated
Pease (2020a) included one study (Kropff, 2017). Kropff (2017) included 32 participants in their cross-over trial. They reported on treatment satisfaction using the first part of the DTSQs and the DTSQc. For the DTSQs the score at follow-up in the group using the integrated system was 28.0±7.1, compared to 28.2±5.2 in the CGM group. For the DTSQc the score at follow-up in the group using the integrated system was 3.3±2.6 compared to 3.6±1.7 in the CGM group. The authors concluded that the average scores were equally positive for the use of the integrated system and CGM compared with baseline. In summary, these data suggest no clinically relevant differences in treatment satisfaction between the integrated system group and the CGM group. However, results have to be interpreted with caution due to the very low number of participants.
Microvascular complications (important outcome measure)
Pease (2020a) performed a narrative synthesis on complications of diabetes, including diabetic retinopathy, peripheral neuropathy, nephropathy/end-stage kidney disease (ESKD), ischaemic heart disease (IHD), cerebrovascular accident (CVA), peripheral vascular disease (PVD), and autonomic neuropathy. Results are stratified for the four comparison categories and only direct evidence is taken into account.
SMBG versus CGM
Two studies reported on complications of diabetes (Bergenstal, 2010 and Heinemann, 2018). In the study of Bergenstal (2010) number of deaths were reported. In the SMBG group (n=not reported), one patient died due to sudden cardiac arrest. This patient had a history of cardiovascular disease. In the CGM group (n=not reported), none of the patients died. In the study of Heinemann (2018) serious adverse events were reported, which was not further defined. In the CGM group (n=75), there were two diabetic foot ulcers and two trauma precipitating fractures, compared to 1 kidney transplantation and 1 myocardial infarction in the SMBG group (n=74). These data do not allow a conclusion on the effect of SMBG on microvascular complications, compared to CGM.
FGM versus SMBG
Pease (2020a) did not include studies which reported on the outcome measure microvascular complications for the comparison between FGM and SMBG.
FGM versus CGM
Pease (2020a) did not include studies which reported on the outcome measure microvascular complications for the comparison between FGM and CGM.
CGM/FGM versus integrated
Pease (2020a) did not include studies which reported on the outcome measure microvascular complications for the comparison between integrated systems and CGM/FGM.
Adverse events (important outcome measure)
Pease (2020a) performed a narrative synthesis on the outcome measure adverse events. In this literature analysis, results are stratified for the four comparison categories (SMBG versus CGM, FGM versus SMBG, FGM versus CGM and CGM/FGM versus integrated systems). Only evidence from direct comparisons is taken into account.
SMBG versus CGM
Pease (2020a) included ten studies (Lee, 2007; Bergenstal, 2010; Hermanides, 2011; Hirsch, 2008; Ajjan, 2016; Beck, 2017b; JDRF, 2008; van Beers, 2016; Heinemann, 2018; Lind, 2017). Results of the narrative synthesis are reported in Table 8. In five studies there were no device related (serious) adverse events reported in both intervention groups (Hirsh, 2008; Beck, 2017b; van Beers, 2016; Heinemann, 2018 and JDRF, 2008). In other studies, the number of reported (serious) adverse events was higher in the CGM group. However, these data are insufficient to draw a conclusion on the effect of SMBG on adverse events, compared to CGM.
Table 8 Results of the narrative synthesis on the outcome measure adverse events, for the comparison between SMBG and CGM (adapted from Pease (2020a))
|
Author, year |
Outcome measure |
CGM |
SMBG |
Remarks/conclusion |
|
Lee, 2007 |
Not reported |
No serious adverse events reported. |
DKA and atypical chest pain. |
n.a. |
|
Bergenstal, 2010 |
Number of hospital admissions |
2
|
1
|
n.a. |
|
Hermanides, 2011 |
Adverse reactions were reported descriptively as numbers of participants and/or numbers of episodes. |
1 episode of DKA related to pump failure per author report.
26 episodes in 20 participants. 17 participants reported sensor or infusion site problems |
|
Other serious adverse events:
|
|
Hirsch, 2008 |
Not reported
|
1 participant (2 episodes) of skin abscess |
0 episodes reported |
No relevant adverse events related to the intervention. |
|
Ajjan, 2016 |
Safety assessment report |
15 participants experienced adverse event |
7 participants experienced adverse event |
‘There were no serious device-related events. Two adverse events were related to the study device and one adverse event was possibly related to the study device. Two adverse events were related to participation in the study and ten were possibly related to participation in the study. Furthermore, 31 (63.3%) had sensor insertion site symptoms.’ |
|
Beck, 2017b |
Serious adverse events (regardless of causality) |
3 events among 2 participants |
0 events |
No adverse events related to study interventions were reported. |
|
Van Beers, 2016
|
Serious, moderate and mild adverse events |
0 device related adverse events |
0 device related adverse events |
n.a. |
|
Lind, 2017
|
Adverse events |
7 participants with 9 serious adverse events (potential relation to intervention was not reported). |
3 participants with 9 serious adverse events (potential relation to control intervention was not reported). |
‘There were no obvious numerical differences for any adverse event between the treatments.’
|
|
Heinemann, 2018
|
Adverse events (serious) |
0 device related adverse events |
0 device related adverse events |
n.a. |
|
JDRF, 2008 |
Unexpected device related events and trial related events |
0 events |
0 events |
n.a. |
* The results in this column are based on the direction of the effect estimates (if provided) and does not take into account whether this difference is statistically significant or clinically relevant
FGM versus SMBG
Pease (2020a) included two studies (Bolinder, 2016; Oskarsson, 2018). Bolinder (2016) reported no cases with serious adverse events related to the intervention in both intervention groups. Thirteen non-serious adverse events were reported in the FGM group, of which ten were categorized as device-related adverse events. Oskarsson (2018) reported eight device-related adverse events in six patients in the FGM group. In both studies, there were no adverse events in the SMBG group. However, data are insufficient to draw a conclusion on the effect of FGM on adverse events, compared to SMBG.
FGM versus CGM
Pease (2020a) did not include studies which reported on the outcome measure adverse events for the comparison between FGM and CGM.
CGM/FGM versus integrated
Pease (2020a) included two studies (Thabit, 2015 and Kropff, 2015). Kropff (2015) reported that there were no cases with serious adverse events in both intervention groups. Furthermore, none of the mild to moderate adverse events were categorized as device-related adverse events. Thabit (2015) reported respectively six events of inflammation at site of sensor insertion (n=2 integrated group, n=4 CGM group), two events of ketonemia related to intercurrent illness (n=1 integrated group, n=1 CGM group) and six hypoglycemic events related to infusion-set occlusion (n=6 integrated group, n=4 CGM group). However, data is insuffient to draw a conclusion on the effect of CGM on adverse events, compared to integrated systems.
Update of Pease (2020a)
The results of the two RCTs (Dicembrini, 2020 and Kovatchev, 2020) that were published after the search date of Pease (2020a) do not affect our conclusions based on Pease (2020a). In the cross-over trial of Dicembrini (2020) the efficacy of CGM+CSII was compared to the efficacy of SMBG+MDI in 28 adults with DM1. They concluded that the CGM group was superior to the SMBG group with respect to change in HbA1c and diabetes treatment satisfaction. Mild skin reactions were mainly reported in the CGM group but were successfully managed with supplemental products. Kovatchev (2020) performed a cross-over trial in 80 adults with DM1, and compared a closed-loop system (CLS, evening and night or 24/7) with CGM+CSII. They concluded that the percentage of time within target range of blood glucose was higher in the CLS groups, compared to the CGM group. These conclusions are in line with the findings of Pease (2020a).
Level of evidence of the literature
The level of evidence of the literature was assessed per comparison and outcome, using the GRADE-methodology. The evidence comes from RCTs and therefore started at HIGH certainty. The level of evidence was subsequently downgraded to MODERATE, LOW or VERY LOW certainty, in case of serious risk of bias, inconsistency, indirectness, imprecision, or publication bias.
Pease (2020a) also assessed the quality of the evidence using GRADE-methodology for the outcome measures HbA1c, hypoglycemia, severe hypoglycemia and quality of life (for details see supplementary data, Pease, 2020a). Because we drew broader conclusions than Pease (2020a), based on the assumption that the efficacy of insulin treatment is mainly determined by the quality (timing, frequency) of glucose measurement and not by the method of insulin delivery (MDI or CSII), we downgraded less often for imprecision, sometimes resulting in higher certainty ratings than those reported in Pease (2020a).
Pease (2020a) did not report on the critical outcome measures depression, hospital admission, nocturnal hypoglycemia, hypo-unawareness and frequency of blood glucose measurements nor on the important outcome measures absenteeism and costs. Therefore, no conclusions could be drawn for these outcome measures.
The level of evidence for each literature conclusion is explained below. The numbers correspond to the superscript numbers in consecutive conclusions:
1-4. The level of evidence is downgraded to low, due to risk of bias (1 level) and imprecision (1 level, low GRADE). There was risk of bias, since in part of the trials the method of randomization was not clear (sequence generation and/or allocation concealment). Furthermore, the 95%CI of the effect estimate crossed the borders for a clinically relevant difference (HbA1c 0.5%) and/or the null effect.
5. The level of evidence is downgraded to very low, due to risk of bias (1 level), inconsistency (1 level) and indirectness (1 level, very low GRADE). There was high risk of performance bias since the trials were not blinded (risk of bias). Pease (2020a) combined studies using different hypoglycemic thresholds, including studies with high hypoglycemic thresholds (< 3.9 mmol/l) close to the target range of blood glucose (4 to 10 mmol/l).
6. The level of evidence is downgraded to low, due to risk of bias (1 level) and indirectness (1 level, low GRADE). There was high risk of performance bias since the trials were not blinded (risk of bias). Pease (2020a) combined studies using different hypoglycemic thresholds, including studies with high hypoglycemic thresholds (<3.9 mmol/l) close to the target range of blood glucose (4 to 10 mmol/l).
7-8. The level of evidence is downgraded to very low, due to risk of bias (1 level), inconsistency (1 level) and indirectness (1 level, very low GRADE). There was high risk of performance bias since the trials were not blinded (risk of bias). Pease (2020a) combined studies using different hypoglycemic thresholds, including studies with high hypoglycemic thresholds (< 3.9 mmol/l) close to the target range of blood glucose (4 to 10 mmol/l).
9-12. The level of evidence is downgraded to very low, due to risk of bias (1 level) and very serious imprecision (2 levels, very low GRADE). There was risk of bias, since in part of the trials the method of randomization was not clear (sequence generation and/or allocation concealment). Furthermore, the 95%CI of the effect estimates crossed the borders for a clinically relevant difference (NNT 20) on both sides (very serious imprecision).
13. The level of evidence is downgraded to very low, due to risk of bias (2 levels) and imprecision (1 level, very low GRADE). There was high risk of performance bias since the trials were not blinded (risk of bias). Furthermore, the 95%CI of the effect estimate crossed the borders for a clinically relevant difference (SMD 0.5, imprecision).
14. The level of evidence is downgraded to very low, due to risk of bias (2 levels) and imprecision (1 level, very low GRADE). There was high risk of performance bias since the trials were not blinded (risk of bias). Furthermore, the 95%CI of the effect estimate crossed the borders for a clinically relevant difference (SMD 0.5) and the null effect (imprecision).
15. The level of evidence is downgraded to very low, due to risk of bias (1 level), inconsistency (1 level) and imprecision (1 level, very low GRADE). There was high risk of performance bias since the trials were not blinded (risk of bias). Furthermore, the 95%CI of the effect estimate crossed the borders for a clinically relevant difference (SMD 0.5) and the null effect (imprecision).
16. Due to lack of data it was not possible to conclude on the effect of using CGM or FGM for glucose monitoring on the outcome measure quality of life, compared to using integrated systems in adults with DM1 (no GRADE).
17. Due to few events for all comparisons, it was not possible to draw conclusions on the effect of SMBG, CGM, FGM and integrated systems, on the outcome measure episodes of ketoacidosis, in adults with DM1 (no GRADE).
18-19. The level of evidence is downgraded to very low, due to risk of bias (2 levels) and imprecision (1 level, very low GRADE). There was very high risk of performance bias since the trials were not blinded (risk of bias). Furthermore, number of participants in the studies was low (imprecision).
20-21. The level of evidence is downgraded to very low, due to risk of bias (1 level) and imprecision (2 levels, very low GRADE). There was risk of performance bias since the trials were not blinded (risk of bias). Furthermore, number of participants in the studies was very low, since only one small study was included (imprecision).
22-23. The level of evidence is downgraded to low, due to risk of bias (1 level) and imprecision (1 level, low GRADE). There was risk of bias, since in part of the trials the method of randomization was not clear (sequence generation and/or allocation concealment). Furthermore, number of participants in the studies was low (imprecision).
24. The level of evidence is downgraded to very low, due to risk of bias (1 level) and imprecision (2 levels, very low GRADE). There was risk of bias, since in part of the trials the method of randomization was not clear (sequence generation and/or allocation concealment). Furthermore, number of participants in the studies was very low, since only one small study was included (imprecision).
25. The level of evidence is downgraded to low, due to risk of bias (1 level) and imprecision (1 level, low GRADE). There was risk of bias, since in part of the trials the method of randomization was not clear (sequence generation and/or allocation concealment). Furthermore, number of participants in the studies was low (imprecision).
26-27. The level of evidence is downgraded to very low, due to risk of bias (2 levels) and imprecision (1 level, very low GRADE). There was very high risk of performance bias since the trials were not blinded (risk of bias). Furthermore, number of participants in the studies was low (imprecision).
28. Due to lack of data for the comparison between FGM and CGM, it was not possible to conclude on the effect of using FGM for glucose monitoring on patient satisfaction, compared to CGM in adults with DM1 (no GRADE).
29. The level of evidence is downgraded to very low, due to risk of bias (1 level) and imprecision (2 levels, very low GRADE). There was risk of performance bias since the trials were not blinded (risk of bias). Furthermore, number of participants in the studies was very low, since only one small study was included (imprecision).
30. Due to few events for the comparison between CGM and SMBG, it was not possible to conclude on the effect of using CGM for glucose monitoring on the outcome measure microvascular complications, compared to SMBG in adults with DM1 (no GRADE).
31. Due to lack of data for the comparison between FGM and SMBG, it was not possible to conclude on the effect of using FGM for glucose monitoring on the outcome measure microvascular complications, compared to SMBG in adults with DM1 (no GRADE).
32. Due to lack of data for the comparison between FGM and CGM, it was not possible to conclude on the effect of using FGM for glucose monitoring on the outcome measure microvascular complications, compared to CGM in adults with DM1 (no GRADE).
33. Due to lack of data for the comparison between integrated systems and CGM/FGM, it was not possible to conclude on the effect of using FGM or CGM for glucose monitoring on the outcome measure microvascular complications, compared to integrated systems in adults with DM1 (no GRADE).
34. Due to very limited data for the comparison between CGM and SMBG, it was not possible to conclude on the effect of using CGM for glucose monitoring on the outcome measure adverse events, compared to SMBG in adults with DM1 (no GRADE).
35. Due to very limited data for the comparison between FGM and SMBG, it was not possible to conclude on the effect of using FGM for glucose monitoring on the outcome measure adverse events, compared to SMBG in adults with DM1 (no GRADE).
36. Due to lack of data for the comparison between FGM and CGM, it was not possible to conclude on the effect of using those different glucose management systems for glucose monitoring on the outcome measure adverse events in adults with DM1 (no GRADE).
37. Due to very limited data for the comparison between CGM/FGM and integrated systems, it was not possible to conclude on the effect of using those different glucose management systems for glucose monitoring on the outcome measure adverse events in adults with DM1 (no GRADE).
A systematic review of the literature was performed to answer the following question:
P: patients with DM1 on basal-bolus regimen (multiple daily injections (MDI) or Continuous Subcutaneous Insulin Infusions (CSII));
I/C: four comparisons:
- Self-monitoring of blood glucose (SMBG) versus continuous glucose monitoring (CGM).
- SMBG versus flash glucose monitoring (FGM).
- CGM versus FGM.
- Semi-closed loop versus CGM or FGM.
O: frequency of blood glucose measurements, HbA1c, hypoglycemia, severe hypoglycemia, nocturnal hypoglycemia, ketoacidosis, hospital admission, hypo-unawareness, fear of hypoglycemia, time within the target range of blood glucose, time above the target range of blood glucose, time below the target range of blood glucose, quality of life, depression, patient satisfaction, absenteeism, microvascular complications, adverse events, costs
Relevant outcome measures
The guideline development group considered frequency of blood glucose measurements (finger pricking or sensor), HbA1c, hypoglycemia (total, severe, nocturnal), ketoacidosis, hospital admission, hypo-unawareness, fear of hypoglycemia, time within the target range of blood glucose, time above the target range of blood glucose, time below the target range of blood glucose, quality of life and depression as critical outcome measures for decision making; and patient satisfaction, absenteeism, microvascular complications, adverse events and costs as important outcome measures for decision making.
The working group defined the outcome measures as follows:
- Target range of blood glucose: blood glucose between 4 to 10 mmol/l (Battelino, 2019).
- Below target range of blood glucose: blood glucose ≤ 3.9 mmol/l (Battelino, 2019).
- Above target range of blood glucose: blood glucose > 10 mmol/l (Battelino, 2019)
- Quality of life (validated instrument).
- Hypoglycemia: blood glucose < 3.0 mmol/L (54 mg/dL; Ratner, 2018). This cut-off point is used to assess hypoglycemia in clinical trials.
- Severe hypoglycemia: hypoglycemic events requiring third-party assistance.
A priori, the working group did not define the other outcome measures listed above but used the definitions used in the studies.
For the outcome measure HbA1c, the working group defined a difference of 5 mmol/mol (0.5%) as the threshold for clinical decision making, and for time in range in blood glucose (TIR) a threshold of 5% was used. For outcome measures severe hypoglycemia and ketoacidosis, the working group defined a number needed to treat of 100 as the threshold for clinical decision making. For non-severe hypoglycemia the threshold was defined as one hypoglycemic event per patient/week. For all other outcome measures, the default thresholds proposed by the international GRADE working group were used: a 25% difference in relative risk (RR) for dichotomous outcomes, and 0.5 standard deviations (SD) for continuous outcomes.
Search and select (Methods)
The databases Medline (via OVID) and Embase (via Embase.com) were searched with relevant search terms until April 23, 2020. Two separate searches were performed: one addressing CGM and FGM in comparison to each other and to SMBG (search 1), and a second (overlapping) search aimed at a comparison between CGM or FGM and (semi-) closed loop systems (search 2). The detailed search strategies are depicted under the tab Methods. The systematic literature searches resulted in 858 and 470 hits, respectively. Studies were selected based on the following criteria: systematic reviews focusing on the comparison between 1) SBMG and CGM, 2) SMBG and FGM, 3) CGM and FGM, and 4) (semi-) closed loop versus CGM or FGM, in patients with DM1. In the first search 5 systematic reviews were initially selected based on title and abstract screening. After reading the full text, 4 studies were excluded (see the table with reasons for exclusion under the tab Methods), and one study was included (Pease, 2020a). Pease (2020a) performed a network meta-analysis which also covered the comparison between CGM/FGM and (semi-) closed loop systems. Therefore, the literature analysis was based on the systematic review of Pease (2020a). In addition, we checked whether relevant RCT’s for the four comparisons had been published after the search date of Pease (2020a). Out of both searches, seven studies were initially selected based on title and abstract screening. After reading the full text, five studies were excluded (see the table with reasons for exclusion under the tab Methods), and two studies were included (Dicembrini, 2020 and Kovatchev, 2020).
Results
Three studies were included in the analysis of the literature: one systematic review (Pease, 2020a) and two supplementary studies (Dicembrini, 2020 and Kovatchev, 2020). The systematic review covers all four relevant comparisons. Risk of bias was determined using the Cochrane tool for assessing risk of bias in randomised trials (Higgins, 2011). Important study characteristics and results are summarized in the evidence tables. The assessment of the risk of bias is summarized in the risk of bias tables. For more detailed patient and study characteristics and results, and risk of bias assessment of the individual studies included in the systematic review we refer to Pease (2020a).
- DCCT (1993). Diabetes Control and Complications Trial Research Group. The effect of intensive treatment of diabetes on the development and progression of long-term complications in insulin-dependent diabetes mellitus. New England journal of medicine, 329(14), 977-986.
- Dicembrini, I., Pala, L., Caliri, M. et al (2020). Combined continuous glucose monitoring and subcutaneous insulin infusion versus self‐monitoring of blood glucose with optimized multiple injections in people with type 1 diabetes: A randomized crossover trial. Diabetes, Obesity and Metabolism.
- FMS (2018). Consultkaart Diabetes type 1 bij volwassenen (>18 jaar): een insulinepen of een insulinepomp. Link: https://consultkaart.nl/wp-content/uploads/2018/03/FMS_ck_Diabetes-type-1-bij-volwassenen_2018.01.pdf (geraadpleegd 8 april 2021).
- Fokkert, M., van Dijk, P., Edens, M., Barents, E., Mollema, J., Slingerland, R.,... & Bilo, H. (2019). Improved well-being and decreased disease burden after 1-year use of flash glucose monitoring (FLARE-NL4). BMJ Open Diabetes Research and Care, 7(1), e000809.
- Higgins, J. P., Altman, D. G., Gøtzsche, P. C., Jüni, P., Moher, D., Oxman, A. D.,... & Sterne, J. A. (2011). The Cochrane Collaboration’s tool for assessing risk of bias in randomised trials. Bmj, 343.
- Kovatchev, B. P., Kollar, L., Anderson, S. M. et al (2020). Evening and overnight closed-loop control versus 24/7 continuous closed-loop control for type 1 diabetes: a randomised crossover trial. The Lancet Digital Health, 2(2), e64-e73.
- NDF (2015). Consensusdocument ‘Kwaliteitscriteria voor optimale en doelmatige inzet insulinepomptherapie en hulpmiddelen’. Nederlandse Diabetes Federatie, Amersfoort. April 2015. Link: https://www.zorgstandaarddiabetes.nl/extrapage/richtlijnen-diabeteszorg-en-preventie/ (geraadpleegd 29 maart 2021).
- NDF (2020). Consensusdocument ‘Kwaliteitscriteria voor optimale en doelmatige inzet FGM en CGM'. Nederlandse Diabetes Federatie, Amersfoort. Juli 2020. Link: https://www.zorgstandaarddiabetes.nl/extrapage/richtlijnen-diabeteszorg-en-preventie/ (geraadpleegd 29 maart 2021).
- NDF (2021). Zorgstandaard Diabetes. Type 1, Verantwoordelijkheden en bevoegdheden. Link: https://www.zorgstandaarddiabetes.nl/type-1/volwassen/organisatie/diabetesspecifiek/verantwoordelijk-en-bevoegdheden/ (geraadpleegd 8 april 2021).
- Pease, A., Lo, C., Earnest, A., Kiriakova, V. et al (2020a). The efficacy of technology in type 1 diabetes: a systematic review, network meta-analysis, and narrative synthesis. Diabetes Technology & Therapeutics, 22(5), 411-421.
- Pease, A., Lo, C., Earnest, A., Kiriakova, V., Liew, D., & Zoungas, S. (2020b). Time in range for multiple technologies in type 1 diabetes: a systematic review and network meta-analysis. Diabetes Care, 43(8), 1967-1975.
- Pease, A. J., Zomer, E., Liew, D., Earnest, A., Soldatos, G., Ademi, Z., & Zoungas, S. (2020c). Cost-effectiveness analysis of a hybrid closed-loop system versus multiple daily injections and capillary glucose testing for adults with type 1 diabetes. Diabetes Technology and Therapeutics, 22(11), 812-821.Pease, A., Lo, C., Earnest, A. et al (2018). Evaluating optimal utilisation of technology in type 1 diabetes mellitus from a clinical and health economic perspective: protocol for a systematic review. Systematic reviews, 7(1), 44.
- Ratner, R. E. (2018). Hypoglycemia: new definitions and regulatory implications. Diabetes technology & therapeutics, 20(S2), S2-50.
- Reddy, M., Jugnee, N., El Laboudi, A., Spanudakis, E., Anantharaja, S., & Oliver, N. (2018). A randomized controlled pilot study of continuous glucose monitoring and flash glucose monitoring in people with type 1 diabetes and impaired awareness of hypoglycaemia. Diabetic Medicine, 35(4), 483-490.
- ZiN (2019). Standpunt Flash Glucose Monitoring bij personen met diabetes mellitus met een intensief insulineschema. Link: https://www.zorginstituutnederland.nl/publicaties/standpunten/2019/12/10/fgm (geraadpleegd 29 maart 2021).
- Visser, M. M., Charleer, S., Fieuws, S. et al (2021). Comparing real-time and intermittently scanned continuous glucose monitoring in adults with type 1 diabetes (ALERTT1): a 6-month, prospective, multicentre, randomised controlled trial. The Lancet.
Evidence table for systematic review of RCTs and observational studies (intervention studies)
Research question: What is the optimal method of glucose self-management in adults and children with diabetes mellitus type 1 (DM1), treated with basal-bolus insulin therapy?
|
Study reference |
Study characteristics |
Patient characteristics |
Intervention (I) |
Comparison / control (C) |
Follow-up |
Outcome measures and effect size |
Comments |
|
Pease, 2020a
|
SR and meta-analysis of RCTs (network meta-analysis)
Literature search up to April 2019.
52 studies in network meta-analysis.
Study design: RCT (parallel or cross-over)
Setting and Country: Community dwelling adults, Europe (59%), USA (24%), Canada (10%), UK (12%) and Australia (2%). For details see appendix Pease, 2020a.
Source of funding and conflicts of interest: Systematic review was not funded, no serious COI which could have influenced the results. 78% of the included trials received funding or material support from industry. For details on individual studies, see appendix Pease (2020a).
|
Inclusion criteria SR: - RCTs of parallel and crossover study design -≥6 weeks duration overall (or each phase of a crossover study) - Included nonpregnant community dwelling adults ≥18 years with type 1 diabetes. - Studies comparing technologies for insulin delivery, glucose monitoring, insulin dosing advice or multiple dosing injections and self-monitoring of blood glucose via capillary testing.
Exclusion criteria SR: - studies on implanted devices or systems that required telemedicine - studies including adult and paediatric participants or a variety of DM types (unless stratified results were available)
52 studies included
Important patient characteristics at baseline:
Total number of patients 3975
Mean sample size (±SD) 78±79 participants
Mean age (years±SD) 40.2±6.2 years
Mean baseline HbA1c (%±SD) 8.4%±0.8%
Mean duration of DM1 (years±SD) 19.5±9.7 years
For details on individual studies see appendix Pease (2020a). |
Several methods of insulin delivery, blood glucose monitoring and advising on insulin doses were compared with each other or as a combination of technology types.
These methods include:
For details on individual studies see appendix Pease (2020a).
|
See I
For details on individual studies see appendix Pease (2020a).
|
End-point of follow-up: Study duration has to be at least 6 weeks. Mean study duration was 8±7 months.
For details on individual studies see appendix Pease (2020a).
For how many participants were no complete outcome data available? For details on individual studies see appendix Pease (2020a).
|
Primary outcomes: HbA1c, hypoglycaemia (severe and non-severe), costs (ICER/QALY)
Secondary outcomes: Hyperglycaemia (frequencies and severity), measured and estimated blood glucose levels, time in target/above or below target blood glucose levels, average fasting and post-prandial glucose levels, average total daily administered insulin dose, episodes of diabetic ketoacidosis, CSII and/or CGM discontinuation apart from trial protocol, health related QoL, health literacy/self-efficacy, engagement with health services, complications of diabetes (retinopathy, peripheral neuropathy, nephropathy/ESKD, IHD, CVA, PVD and autonomic neuropathy), mortality, (co)morbidity index, patient acceptability of testing method/method of insulin delivery, anxiety about hypoglycaemia or hyperglycaemia, adverse events from testing or treatment (false results/treatment errors).
SUCRA ranking HbA1c Integrated systems: 96.4 CSII with standalone CGM: 80.0 MDI with CGM: 72.5 CSII with bolus calculators: 52.6
Severe hypoglycemia MDI with FGM: 80.0 MDI with CGM: 78.2 CSII with SMBG: 67.4 Integrated systems: 53.7
Non-severe hypoglycemia MDI with CGM: 94.6 MDI with FGM: 67.6 Integrated systems: 64.1
Quality of life MDI with CGM: 88.9 MDI with FGM: 66.3 CSII with insulin advisors: 55.8 CSII with standalone CGM: 49.7
For details on outcomes, see study protocol (Pease, 2018).
For details on individual studies see appendix Pease (2020a).
See guideline text for a summary of results from network meta-analysis (frequentist model; random-effects) and results deduced from narrative synthesis (direct comparisons). |
Authors conclusion Integrated systems comprising low-glucose suspend or hybrid closed-loop algorithms appeared best for A1c reduction, composite ranking for A1c and severe hypoglycaemia, and possibly QoL, while interstitial glucose sensors ranked highly for preventing hypoglycaemia or improving QoL independent of other outcomes.
For both outcome A1C as non-severe hypoglycaemia, a second network was created investigating glucose sensing technology, in which the insulin delivery modality was not the same for all participants within each study.
Among integrated systems, additional sensitivity analyses suggested that hybrid closed-loop therapy was the primary driver for significant A1c reductions.
The distribution of potential effect modifiers, including age, diabetes duration, and A1c, satisfied the assumption of transitivity. |
Table of quality assessment for systematic reviews of RCTs and observational studies
Based on AMSTAR checklist (Shea, 2007; BMC Methodol 7: 10; doi:10.1186/1471-2288-7-10) and PRISMA checklist (Moher, 2009; PLoS Med 6: e1000097doi:10.1371/journal.pmed1000097)
|
Study
First author, year |
Appropriate and clearly focused question?
Yes/no/unclear |
Comprehensive and systematic literature search?
Yes/no/unclear |
Description of included and excluded studies?
Yes/no/unclear |
Description of relevant characteristics of included studies?
Yes/no/unclear |
Appropriate adjustment for potential confounders in observational studies?
Yes/no/unclear/notapplicable |
Assessment of scientific quality of included studies?
Yes/no/unclear |
Enough similarities between studies to make combining them reasonable?
Yes/no/unclear |
Potential risk of publication bias taken into account?
Yes/no/unclear |
Potential conflicts of interest reported?
Yes/no/unclear |
|
Pease, 2020a |
Yes |
Yes*
|
Yes* |
Yes*
|
Not applicable |
Yes*
|
Unclear* |
Yes*
|
Yes*
|
*Relevant databases were searched; list of included and excluded studies is provided, also reporting the reason for exclusion (see appendix Pease (2020a)); evidence tables are available for all of the included studies (see appendix Pease, 2020a); Cochrane risk of bias tool was used to assess risk of bias (tables on individual studies available), which indicates high risk of performance bias in most of the studies, unclear sequence generation and allocation concealment in large part of the studies and detection bias with regard to the outcome measures quality of life and hypoglycemia in some of the studies (see appendix Pease (2020a)); network heterogeneity was low to considerable for the different outcome measures; most of the studies did differ in for example insulin delivery modality; publication bias was assessed and was downgraded for if applicable (see appendix Pease, 2020a); no funding for NMA and all authors declared no support from any organization for the submitted work, source of funding was reported for all of the included studies (see appendix Pease, 2020a)
Table of excluded studies
|
Author and year |
Reason for exclusion |
|
Systematic reviews |
|
|
Cowart 2020 |
Restricted to isCGM (FGM), also includes DM2; no added value as compared to Pease (2020a |
|
Ontario Health 2019 |
Restricted to FGM, narrative synthesis (no pooling); no added value as compared to Pease (2020a) |
|
Ontario Health 2018 |
Restricted to CGM, mostly narrative synthesis; no added value as compared to Pease (2020a) |
|
De Ridder 2019 |
Narrative synthesis (no pooling), uses outdated evidence grading system; no added value as compared to Pease (2020a) |
|
RCTs |
|
|
Bosi, 2019 |
Wrong comparison (integrated systems versus SMBG) |
|
Speight, 2019 |
Restricted to outcome patient satisfaction |
|
Little, 2018 |
Published before search date of Pease (2020a) |
|
Brown, 2019 |
Wrong population (one third of the population was <18 years) |
|
Kovatchev, 2020b (Diab Care) |
Wrong population (one third of the population was <18 years) |
Beoordelingsdatum en geldigheid
Publicatiedatum : 20-12-2021
Beoordeeld op geldigheid : 15-11-2021
|
Module |
Regiehouder(s) |
Jaar van autorisatie |
Eerstvolgende beoordeling actualiteit richtlijn |
Frequentie van beoordeling op actualiteit |
Wie houdt er toezicht op actualiteit |
Relevante factoren voor wijzigingen in aanbeveling |
|
Glucose zelfmanagement |
NIV, NVK |
2021 |
2022 |
Jaarlijks |
NIV, NVK |
Lopend onderzoek, nieuwe interventies |
Algemene gegevens
De ontwikkeling/herziening van deze richtlijnmodule werd ondersteund door het Kennisinstituut van de Federatie Medisch Specialisten en werd gefinancierd uit de Stichting Kwaliteitsgelden Medisch Specialisten (SKMS). De financier heeft geen enkele invloed gehad op de inhoud van de richtlijnmodule.
Doel en doelgroep
Doel
Doel is het opstellen van een modulaire evidence-based richtlijn conform de huidige criteria (OMS 2011) naar aanleiding van feedback uit het veld en op basis van actuele wetenschappelijke gegevens. Dit moet leiden tot een nog meer gerichte en uniforme behandelingsstrategie van patiënten met DM1. Daarnaast zal patiënten informatie worden ontwikkeld die zal aansluiten bij de informatie die al beschikbaar is op de website voor publieks- en patiënten informatie Thuisarts.nl.
In de voorbereidende fase zijn de volgende knelpunten geprioriteerd:
- Wat is de waarde van SGLT-2-remmers bij volwassenen met DM1?
- Wat is de optimale methode van glucose zelfmanagement voorvolwassenen met DM1 behandeld met insuline (MDI of CSII): (RT)CGM, FGM of SMBG (vingerprikken)?
- Wat is de meerwaarde van een semi-closed loop systeem (combinatie sensor (CGM) en pomp) voorvolwassen met DM1 behandeld met CSII?
- Wat is de waarde van 2e generatie langwerkende insuline analogen bij kinderen en volwassenen met DM1?
- Wat is de optimale insulinebehandeling voor volwassenen met DM1: CSII of basaal-bolus?
In de huidige conceptrichtlijn (aanvullende modules) zijn adviezen geformuleerd voor de eerste drie uitgangsvragen. Hierbij zijn de knelpunten met betrekking tot de inzet van sensoren en semi-closed loop systemen in een module gecombineerd. Een advies voor de resterende knelpunten wordt momenteel uitgewerkt en de concepttekst naar verwachting in het vierde kwartaal van 2021 ter commentaar aangeboden.
Doelgroep
Deze richtlijn is geschreven voor alle beroepsgroepen die betrokken zijn bij de zorg voor patiënten met DM1. Daarnaast wordt patiënten informatie ontwikkeld en gepubliceerd op de website voor publieks- en patiënten informatie Thuisarts.nl.
Samenstelling werkgroep
Voor het ontwikkelen van de richtlijnmodule is in 2019 een multidisciplinaire werkgroep ingesteld, bestaande uit vertegenwoordigers van alle relevante specialismen die betrokken zijn bij de zorg voor personen met diabetes mellitus type 1.
Werkgroep DM1
- Prof. Dr B.E. (Bastiaan) de Galan, internist, hoogleraar interne geneeskunde-diabetologie, Maastricht UMC+; NIV (voorzitter)
- Dr. P.S. (Sytze) van Dam, internist niet-praktiserend, OLVG, locatie Oost, Amsterdam; NIV (voorzitter)
- Dr. A.C. (Arianne) van Bon, internist-endocrinoloog, Rijnstate, Arnhem; NIV
- Dr. T.C.J. (Theo) Sas, kinderarts-endocrinoloog, Erasmus MC, Sophia Kinderziekenhuis en Diabeter, Rotterdam; NVK
- P.L.M. (Petra) Bouhuijzen, diabetesverpleegkundige, St. Antonius Ziekenhuis, Utrecht, Nieuwegein; V&VN
- T.M. (Ties) Obers, beleidsmedewerker Diabetesvereniging Nederland, Leusden; Diabetesvereniging Nederland, vanaf november 2020.
Klankbordgroep DM1
- Dr. K.A.C. (Kirsten) Berk, diëtist Erasmus MC, Universitair Medisch Centrum, Rotterdam; NVD/ Diabetes and Nutrition Organization
Stuurgroep Modulair onderhoud diabetesrichtlijnen
- Dr. P.S. (Sytze) van Dam, internist niet-praktiserend, OLVG, locatie Oost, Amsterdam; NIV (overkoepelend voorzitter)
- Dr. E.H. (Erik) Serné, Internist-vasculaire geneeskunde/diabetologie, Amsterdam UMC, locatie VUmc, Amsterdam; NIV
- Prof. Dr B.E. (Bastiaan) de Galan, internist, hoogleraar interne geneeskunde-diabetologie, Maastricht UMC+; NIV
Met ondersteuning van
- Dr. K.N.J. (Koert) Burger, epidemioloog, senior-adviseur; Kennisinstituut van de Federatie van Medisch Specialisten (tot april 2021)
- H. (Hanneke) Olthuis-van Essen, adviseur; Kennisinstituut van de Federatie van Medisch Specialisten
- Dr. M.S. (Matthijs) Ruiter, adviseur; Kennisinstituut van de Federatie van Medisch Specialisten;
Belangenverklaringen
De Code ter voorkoming van oneigenlijke beïnvloeding door belangenverstrengeling is gevolgd. Alle werkgroepleden hebben schriftelijk verklaard of zij in de laatste drie jaar directe financiële belangen (betrekking bij een commercieel bedrijf, persoonlijke financiële belangen, onderzoeksfinanciering) of indirecte belangen (persoonlijke relaties, reputatiemanagement) hebben gehad. Gedurende de ontwikkeling of herziening van een module worden wijzigingen in belangen aan de voorzitter doorgegeven. De belangenverklaring wordt opnieuw bevestigd tijdens de commentaarfase.
Een overzicht van de belangen van werkgroepleden en het oordeel over het omgaan met eventuele belangen vindt u in onderstaande tabel. De ondertekende belangenverklaringen zijn op te vragen bij het secretariaat van het Kennisinstituut van de Federatie Medisch Specialisten.
|
Werkgroeplid |
Functie |
Nevenfuncties |
Gemelde belangen |
Ondernomen actie |
|
de Galan (vz) |
Internist, hoogleraar MUMC+ Maastricht en Radboudumc Nijmegen. |
Docent post-academisch onderwijs HAN (betaald; naar Radboudumc); Docent/cursusleider DESG cursus voor aios interne geneeskunde en kindergeneeskunde (betaald; naar Radboudumc); Lid wetenschappelijke adviesraad Diabetes UK (onbetaald); Bestuurslid Diabetes Education Study Group (DESG Nederland; onbetaald); Voorzitter accreditatiecommissie NIV (vacatiegelden); Lid COIG examencommissie NIV (vacatiegelden); Voorzitter J. Terpstraprijs commissie NVDO. Redactieraad Diabetologia (vanaf 2020) |
Adviesraad Novo Nordisk (2018, insulinebehandeling in de toekomst, betaling aan het Radboudumc; adviesraad inmiddels gestopt); Lilly (eenmalig, nasaal glucagon voor behandeling van ernstige hypo's, onbetaald); Onderzoek in het verleden ondersteund met subsidies van het Diabetesfonds, European Foundation for the Study of Diabetes (EFSD), NIH, Astra-Zeneca (unrestricted grant onderzoek naar behandeling hypo-unawareness met GLP-1 agonist; 2017-2018), Sanofì (unrestricted grant naar opname van lactaat in de hersenen, 2017-2018); Huidige onderzoeks-ondersteuning: European Union's Horizon 2020 lnnovative Medicine lnitiative (lMl); Juvenile Diabetes Research Fund; lnternational Diabetes Federation (lDF); The Leona M. and Harry B. Helmsley Charitable Trust, T1D Exchange; ZonMw en Diabetesfonds; Novo Nordisk (investigator-initiated trial naar aanpassing van degludec bij sport; unrestricted grant; geen vergelijking met andere insulines). |
Geen actie (in verleden adviesraden die nu zijn gestopt; toepassing van GLP-1-agonisten bij DM1 valt niet onder huidig modulair onderhoud). |
|
van Dam (vz) |
Internist endocrinoloog OLVG Amsterdam (momenteel onbetaald verlof). |
Ondersteuning Amsterdam Diabetes Centrum (vooralsnog onbetaald). |
Actief betrokken bij de ontwikkeling van een diabetescentrum (vooral type 1) in Amsterdam (samenwerking Amsterdam UMC met OLVG). |
Geen |
|
van Bon |
Internist-endocrinoloog Rijnstate ziekenhuis. |
Laag frequent geven van nascholing over diabetes, met name aan POH-ers en diabetes-verpleegkundigen (deels betaald door Sanofi, Novo Nordisk). |
Geen financieel belang. Nauw betrokken bij de ontwikkeling van kunstalvleesklier van het bedrijf lnreda Diabetic (testen prototypes; onbetaald). |
Geen actie (kunstalvleesklier valt niet onder huidig modulair onderhoud). |
|
Sas |
Kinderarts-endocrinoloog ErasmusMC - Sophia Rotterdam; kinderarts-endocrinoloog Diabeter, Rotterdam. |
Voorzitter Adviesgroep Groeihormoon, sectie Endocrinologie bij kinderen (NVK; onbetaald); commissielid sensor richtlijn NDF (vanuit NVK; onbetaald); secretaris ESPE Working Group on Turner syndrome (onbetaald). Voorzitter werkgroep Groei en Ontwikkeling van NVE - onbetaald |
Geen financieel voordeel; in loondienst bij ErasmusMC (UMS) en Diabeter (AMS). Diabeter is eigendom van Medtronic, die onder andere sensoren en pompen verkopen. Ik heb geen financiële relatie met Medtronic en wordt betaald volgens AMS door Diabeter. Medtronic heeft geen invloed op de zorg of zorgverleners of de producten en materialen die voorgeschreven worden. Ik heb bij mijn aanstelling een "onafhankelijkheidverklaring" getekend waarin ik mij niet laat leiden door enige prikkels van leveranciers, inclusief Medtronic. Medtronic sponsort op dit moment geen onderzoek met Diabeter naar sensoren, maar helpt Diabeter met uitvraag naar Carelink data naar zorg evaluatie van behandeling met pomp en sensor. Adviezen vanuit een richtlijn beïnvloeden niet deze evaluatie of de ondersteuning daarvan. |
Geen trekker bij uitgangsvragen met betrekking tot glucose management. |
|
Bouhuijzen |
Diabetes-verpleegkundige St. Antonius Ziekenhuis |
gastdocent Academie St. Antonius Ziekenhuis (betaald) |
Geen |
Geen |
|
Obers |
Beleidsmedewerker Belangenbehartiging, Diabetes Vereniging Nederland (24 uur/week); freelance adviseur voor Goede Doelen, Groei voor Goed (16 uur/week). |
Lid Cliëntenraad, UMC Utrecht (vrijwilligersvergoeding). |
Boegbeeldfunctie bij patiëntenorganisatie. |
Geen |
|
Klankbord |
||||
|
Berk |
Diëtist Diabetesteam- afdeling Inwendige Geneeskunde Erasmus MC; Postdoc onderzoek - afdeling Diëtetiek Erasmus MC. |
Docent post-HBO voeding bij diabetes - Hogeschool Arnhem en Nijmegen (betaald); spreker diverse nationale congressen over voeding blj diabetes (betaald). |
Geen financiële belangen; onderzoek naar effect flavanolen op mlcro-albumlnurie bij patiënten met type 2-diabetes (FLAVA onderzoek; 100k fundlng vanuit Masqueliers' OPC, bedrijf dat voedingsproduct met flavanolen produceert); onderzoek effectiviteit blended care versie van very-low calorie diet, met behulp van eHealth (E-DIET trial; levering benodigde maaltijd vervangers door Cambridge Weight Plan Benelux). |
Geen (diëten vallen niet onder huidig modulair onderhoud). |
Inbreng patiëntenperspectief
Er werd aandacht besteed aan het patiëntenperspectief door afvaardiging van de patiëntenvereniging (Diabetesvereniging Nederland) in de werkgroep. De verkregen input is meegenomen bij het opstellen van de uitgangsvragen, de keuze voor de uitkomstmaten en bij het opstellen van de overwegingen. De conceptrichtlijn is tevens voor commentaar voorgelegd aan Diabetesvereniging Nederland. De aangeleverde commentaren zijn bekeken en verwerkt.
Bij de richtlijn is conform de Wet kwaliteit, klachten en geschillen zorg (Wkkgz) een kwalitatieve raming uitgevoerd of de aanbevelingen mogelijk leiden tot substantiële financiële gevolgen. Bij het uitvoeren van deze beoordeling zijn richtlijnmodules op verschillende domeinen getoetst.
Uit de kwalitatieve raming blijkt dat er waarschijnlijk geen substantiële financiële gevolgen zijn, zie onderstaande tabel.
|
Module |
Uitkomst kwalitatieve raming |
Toelichting |
|
Module glucose zelfmanagement |
geen substantiële financiële gevolgen |
Hoewel uit de toetsing volgt dat de aanbevelingen breed toepasbaar zijn (>40.000 patiënten), volgt uit de toetsing dat het geen nieuwe manier van zorgverlening of andere organisatie van zorgverlening betreft, het geen toename in het aantal in te zetten voltijdsequivalenten aan zorgverleners betreft en het geen wijziging in het opleidingsniveau van zorgpersoneel betreft. Er worden daarom geen financiële gevolgen verwacht. |
Methode ontwikkeling
Evidence based
Werkwijze
AGREE
Deze richtlijnmodule is opgesteld conform de eisen vermeld in het rapport Medisch Specialistische Richtlijnen 2.0 van de adviescommissie Richtlijnen van de Raad Kwaliteit. Dit rapport is gebaseerd op het AGREE II instrument (Appraisal of Guidelines for Research & Evaluation II; Brouwers, 2010).
Knelpuntenanalyse en uitgangsvragen
Tijdens de voorbereidende fase inventariseerde de stuurgroep van het project Modulair onderhoud diabetesrichtlijnen, en de werkgroep DM1, de knelpunten in de zorg van personen met diabetes mellitus type 1. Het project Modulair onderhoud diabetesrichtlijnen is gestart met een brede algemene analyse van de knelpunten in de zorg voor personen met diabetes: een schriftelijke knelpuntanalyse bij NIV, V&VN, DVN en het NHG, aangevuld met een enquête tijdens de Internistendagen (24 tot 26 april 2019, Maastricht) en een inventarisatie van de belangrijkste knelpunten (top-3) bij de genodigden voor de Invitational conference. In de Invitational conference zijn de uitkomsten van de schriftelijke knelpuntenanalyses besproken en waar nodig aangevuld, en is een eerste prioritering van de meest urgente revisies (bestaande modules) en aanvullingen (nieuwe modules) vastgesteld (zie het verslag van de invitational in de bijlage). De stuurgroep heeft de definitieve prioritering vastgesteld waarna onderwerpen zijn geclusterd en afzonderlijke werkgroepen zijn samengesteld op basis van de benodigde expertise, waaronder een werkgroep DM1. De werkgroep DM1 heeft de knelpunten rondom de zorg voor patiënten met DM1 verder geanalyseerd en concept-uitgangsvragen opgesteld en definitief vastgesteld.
Uitkomstmaten
Na het opstellen van de zoekvraag behorende bij de uitgangsvraag inventariseerde de werkgroep welke uitkomstmaten voor de patiënt relevant zijn, waarbij zowel naar gewenste als ongewenste effecten werd gekeken. Hierbij werd een maximum van acht uitkomstmaten gehanteerd. De werkgroep waardeerde deze uitkomstmaten volgens hun relatieve belang bij de besluitvorming rondom aanbevelingen, als cruciaal (kritiek voor de besluitvorming), belangrijk (maar niet cruciaal) en onbelangrijk. Tevens definieerde de werkgroep tenminste voor de cruciale uitkomstmaten welke verschillen zij klinisch (patiënt) relevant vonden.
Methode literatuursamenvatting
Een uitgebreide beschrijving van de strategie voor zoeken en selecteren van literatuur en de beoordeling van de risk-of-bias van de individuele studies is te vinden onder ‘Zoeken en selecteren’ onder Onderbouwing. De beoordeling van de kracht van het wetenschappelijke bewijs wordt hieronder toegelicht.
Beoordelen van de kracht van het wetenschappelijke bewijs
De kracht van het wetenschappelijke bewijs werd bepaald volgens de GRADE-methode. GRADE staat voor ‘Grading Recommendations Assessment, Development and Evaluation’ (zie http://www.gradeworkinggroup.org/). De basisprincipes van de GRADE-methodiek zijn: het benoemen en prioriteren van de klinisch (patiënt) relevante uitkomstmaten, een systematische review per uitkomstmaat, en een beoordeling van de bewijskracht per uitkomstmaat op basis van de acht GRADE-domeinen (domeinen voor downgraden: risk of bias, inconsistentie, indirectheid, imprecisie, en publicatiebias; domeinen voor upgraden: dosis-effect relatie, groot effect, en residuele plausibele confounding).
GRADE onderscheidt vier gradaties voor de kwaliteit van het wetenschappelijk bewijs: hoog, redelijk, laag en zeer laag. Deze gradaties verwijzen naar de mate van zekerheid die er bestaat over de literatuurconclusie, in het bijzonder de mate van zekerheid dat de literatuurconclusie de aanbeveling adequaat ondersteunt (Schünemann, 2013; Hultcrantz, 2017).
|
GRADE |
Definitie |
|
Hoog |
|
|
Redelijk |
|
|
Laag |
|
|
Zeer laag |
|
Bij het beoordelen (graderen) van de kracht van het wetenschappelijk bewijs in richtlijnen volgens de GRADE-methodiek spelen grenzen voor klinische besluitvorming een belangrijke rol (Hultcrantz, 2017). Dit zijn de grenzen die bij overschrijding aanleiding zouden geven tot een aanpassing van de aanbeveling. Om de grenzen voor klinische besluitvorming te bepalen moeten alle relevante uitkomstmaten en overwegingen worden meegewogen. De grenzen voor klinische besluitvorming zijn daarmee niet één op één vergelijkbaar met het minimaal klinisch relevant verschil (Minimal Clinically Important Difference, MCID). Met name in situaties waarin een interventie geen belangrijke nadelen heeft en de kosten relatief laag zijn, kan de grens voor klinische besluitvorming met betrekking tot de effectiviteit van de interventie bij een lagere waarde (dichter bij het nuleffect) liggen dan de MCID (Hultcrantz, 2017).
Overwegingen (van bewijs naar aanbeveling)
Om te komen tot een aanbeveling zijn naast (de kwaliteit van) het wetenschappelijke bewijs ook andere aspecten belangrijk en worden meegewogen, zoals aanvullende argumenten uit bijvoorbeeld de biomechanica of fysiologie, waarden en voorkeuren van patiënten, kosten (middelenbeslag), aanvaardbaarheid, haalbaarheid en implementatie. Deze aspecten zijn systematisch vermeld en beoordeeld (gewogen) onder het kopje ‘Overwegingen’ en kunnen (mede) gebaseerd zijn op expert opinion. Hierbij is gebruik gemaakt van een gestructureerd format gebaseerd op het evidence-to-decision framework van de internationale GRADE Working Group (Alonso-Coello, 2016a; Alonso-Coello, 2016b). Dit evidence-to-decision framework is een integraal onderdeel van de GRADE-methodiek.
Formuleren van aanbevelingen
De aanbevelingen geven antwoord op de uitgangsvraag en zijn gebaseerd op het beschikbare wetenschappelijke bewijs en de belangrijkste overwegingen, en een weging van de gunstige en ongunstige effecten van de relevante interventies. De kracht van het wetenschappelijk bewijs en het gewicht dat door de werkgroep wordt toegekend aan de overwegingen, bepalen samen de sterkte van de aanbeveling. Conform de GRADE-methodiek sluit een lage bewijskracht van conclusies in de systematische literatuuranalyse een sterke aanbeveling niet a priori uit, en zijn bij een hoge bewijskracht ook zwakke aanbevelingen mogelijk (Agoritsas, 2017; Neumann, 2016). De sterkte van de aanbeveling wordt altijd bepaald door weging van alle relevante argumenten tezamen. De werkgroep heeft bij elke aanbeveling opgenomen hoe zij tot de richting en sterkte van de aanbeveling zijn gekomen.
In de GRADE-methodiek wordt onderscheid gemaakt tussen sterke en zwakke (of conditionele) aanbevelingen. De sterkte van een aanbeveling verwijst naar de mate van zekerheid dat de voordelen van de interventie opwegen tegen de nadelen (of vice versa), gezien over het hele spectrum van patiënten waarvoor de aanbeveling is bedoeld. De sterkte van een aanbeveling heeft duidelijke implicaties voor patiënten, behandelaars en beleidsmakers (zie onderstaande tabel). Een aanbeveling is geen dictaat, zelfs een sterke aanbeveling gebaseerd op bewijs van hoge kwaliteit (GRADE gradering HOOG) zal niet altijd van toepassing zijn, onder alle mogelijke omstandigheden en voor elke individuele patiënt.
|
Implicaties van sterke en zwakke aanbevelingen voor verschillende richtlijngebruikers |
||
|
|
Sterke aanbeveling |
Zwakke (conditionele) aanbeveling |
|
Voor patiënten |
De meeste patiënten zouden de aanbevolen interventie of aanpak kiezen en slechts een klein aantal niet. |
Een aanzienlijk deel van de patiënten zouden de aanbevolen interventie of aanpak kiezen, maar veel patiënten ook niet. |
|
Voor behandelaars |
De meeste patiënten zouden de aanbevolen interventie of aanpak moeten ontvangen. |
Er zijn meerdere geschikte interventies of aanpakken. De patiënt moet worden ondersteund bij de keuze voor de interventie of aanpak die het beste aansluit bij zijn of haar waarden en voorkeuren. |
|
Voor beleidsmakers |
De aanbevolen interventie of aanpak kan worden gezien als standaardbeleid. |
Beleidsbepaling vereist uitvoerige discussie met betrokkenheid van veel stakeholders. Er is een grotere kans op lokale beleidsverschillen. |
Organisatie van zorg
In de knelpuntenanalyse en bij de ontwikkeling van de richtlijnmodule is expliciet aandacht geweest voor de organisatie van zorg: alle aspecten die randvoorwaardelijk zijn voor het verlenen van zorg (zoals coördinatie, communicatie, (financiële) middelen, mankracht en infrastructuur). Randvoorwaarden die relevant zijn voor het beantwoorden van deze specifieke uitgangsvraag zijn genoemd bij de overwegingen. Indien relevant worden algemene, overkoepelende, of bijkomende aspecten van de organisatie van zorg behandeld in de module Organisatie van zorg.
Commentaar- en autorisatiefase
De conceptrichtlijnmodule werd aan de betrokken (wetenschappelijke) verenigingen en (patiënt) organisaties voorgelegd ter commentaar. De commentaren werden verzameld en besproken met de werkgroep. Naar aanleiding van de commentaren werd de conceptrichtlijnmodule aangepast en definitief vastgesteld door de werkgroep. De definitieve richtlijnmodule werd aan de deelnemende (wetenschappelijke) verenigingen en (patiënt) organisaties voorgelegd voor autorisatie en door hen geautoriseerd dan wel geaccordeerd.
Literatuur
Agoritsas, T., Merglen, A., Heen, A. F., Kristiansen, A., Neumann, I., Brito, J. P.,... & Guyatt, G. H. (2017). UpToDate adherence to GRADE criteria for strong recommendations: an analytical survey. BMJ open, 7(11):e018593.
Alonso-Coello, P., Schünemann, H. J., Moberg, J., Brignardello-Petersen, R., Akl, E. A., Davoli, M.,... & GRADE Working Group. (2016). GRADE Evidence to Decision (EtD) frameworks: a systematic and transparent approach to making well informed healthcare choices. 1: Introduction. bmj, 353:i2016.
Alonso-Coello, P., Oxman, A. D., Moberg, J., Brignardello-Petersen, R., Akl, E. A., Davoli, M.,... & GRADE Working Group. (2016). GRADE Evidence to Decision (EtD) frameworks: a systematic and transparent approach to making well informed healthcare choices. 2: Clinical practice guidelines. bmj, 353:i2089.
Brouwers, M. C., Kho, M. E., Browman, G. P., Burgers, J. S., Cluzeau, F., Feder, G.,... & Zitzelsberger, L. (2010). AGREE II: advancing guideline development, reporting and evaluation in health care. Cmaj, 182(18), E839-E842.
Hultcrantz, M., Rind, D., Akl, E. A., Treweek, S., Mustafa, R. A., Iorio, A.,... & Guyatt, G. (2017). The GRADE Working Group clarifies the construct of certainty of evidence. Journal of clinical epidemiology, 87, 4-13.
Medisch Specialistische Richtlijnen 2.0 (2012). Adviescommissie Richtlijnen van de Raad Kwalitieit. https://richtlijnendatabase.nl/over_deze_site/richtlijnontwikkeling.html.
Neumann, I., Santesso, N., Akl, E. A., Rind, D. M., Vandvik, P. O., Alonso-Coello, P.,... & Guyatt, G. H. (2016). A guide for health professionals to interpret and use recommendations in guidelines developed with the GRADE approach. Journal of clinical epidemiology, 72, 45-55.
Schünemann H, Brożek J, Guyatt G, et al. GRADE handbook for grading quality of evidence and strength of recommendations. Updated October 2013. The GRADE Working Group, 2013. Available from http://gdt.guidelinedevelopment.org/central_prod/_design/client/handbook/handbook.html.
Zoekverantwoording
Search 1
Algemene informatie
|
Richtlijn: Diabetes Mellitus 1 |
|
|
Uitgangsvraag: UV4 Wat is de optimale methode van glucose zelfmanagement voor volwassenen met DM1 behandeld met basaal-bolus insuline: (RT)CGM, FGM of SMBG (vingerprikken)? |
|
|
Database(s): Embase, Pubmed |
Datum: 23-04-2020 |
|
Periode: geen limitering |
Talen: geen limitering |
|
Literatuurspecialist: Alies van der Wal |
|
|
Toelichting en opmerkingen: |
|
Zoekopbrengst
|
|
Embase |
Pubmed |
Ontdubbeld |
|
SRs |
84 |
54 |
101 |
|
RCTs |
710 |
246 |
757 |
|
Totaal |
2103 |
1473 |
|
Pubmed
|
Search |
Query |
Items found |
|
#13 |
Search #11 AND #2 |
|
|
#12 |
Search #11 AND #1 |
|
|
#11 |
Search #10 AND #3 NOT ("Comment"(Publication Type) OR "Letter"(Publication Type)) NOT ("Animals"(Mesh) NOT "Humans"(Mesh)) |
|
|
#10 |
Search #7 OR #8 OR #9 |
|
|
#9 |
Search #6 AND #4 |
|
|
#8 |
Search #5 AND #6 |
|
|
#7 |
Search #4 AND #5 |
|
|
#6 |
Search flash glucose monitor*(tiab) OR flash continuous glucose monitor*(tiab) OR Freestyle Libre(tiab) OR FCGM(tiab) OR flash CGM(tiab) OR FLARE-NL4(tiab) |
|
|
#5 |
Search (continuous glucose monitor*(tiab) OR continuous monitoring glucose(tiab) OR CGM(tiab) OR CGMs(tiab) OR isCGM(tiab) OR Freestyle Navigator(tiab) OR dexcom(tiab) OR DG4P(tiab) OR DG5(tiab) OR MiniMed*(tiab) OR 620G(tiab) OR 640G(tiab) OR 670G(tiab) OR Enlite(tiab) OR Eversense(tiab) OR (Vibe(tiab) AND animas(tiab)) OR omnipod(tiab) OR t slim(tiab) OR (tandem(tiab) AND (X2(tiab) OR IQ(tiab) OR pump(tiab))) OR closed loop(tiab) OR "Pancreas, Artificial"(Mesh) OR artificial pancreas(tiab) OR bionic pancreas(tiab)) |
|
|
#4 |
Search ("Blood Glucose Self-Monitoring"(Mesh) OR self-monitoring of blood glucose(tiab) OR self-monitoring blood glucose(tiab) OR self-monitored blood glucose(tiab) OR self-measured blood glucose(tiab) OR SMBG(tiab) OR glucose self-monitoring(tiab) OR blood sugar self-monitoring(tiab) OR home blood glucose monitoring(tiab) OR conventional blood glucose monitoring(tiab) OR finger stick*(tiab) OR fingerstick*(tiab) OR finger prick*(tiab) OR fingerprick*(tiab)) |
|
|
#3 |
Search "Diabetes Mellitus"(Mesh:NoExp) OR "Diabetes Mellitus, Type 1"(Mesh) OR ((diabetes(tiab) OR diabetic*(tiab)) AND (insulin depend*(tiab) OR insulindepend*(tiab) OR insulin treat*(tiab) OR intensive insulin*(tiab))) OR diabetes mellitus type 1(tiab) OR diabetes mellitus type i(tiab) OR diabetes mellitus type one(tiab) OR diabetes type 1(tiab) OR diabetes type i(tiab) OR dm1(tiab) OR iddm(tiab) OR dm 1(tiab) OR t1d*(tiab) OR dm type 1(tiab) OR type 1 dm(tiab) OR type 1 diabet*(tiab) OR type I diabet*(tiab) OR dm type I(tiab) OR type one diabet*(tiab) OR juvenile diabet*(tiab) OR juvenile onset diabet*(tiab) OR early onset diabetes mellitus(tiab) OR ketoacidotic diabet*(tiab) OR labile diabetes mellitus(tiab) OR latent autoimmune diabetes in adults(tiab) OR brittle diabet*(tiab) |
|
|
#2 |
Search ((random*(tiab) AND (controlled(tiab) OR control(tiab) OR placebo(tiab) OR versus(tiab) OR vs(tiab) OR group(tiab) OR groups(tiab) OR comparison(tiab) OR compared(tiab) OR arm(tiab) OR arms(tiab) OR crossover(tiab) OR cross-over(tiab)) AND (trial(tiab) OR study(tiab))) OR ((single(tiab) OR double(tiab) OR triple(tiab)) AND (masked(tiab) OR blind*(tiab)))) |
|
|
#1 |
Search ("Meta-Analysis as Topic"(Mesh) OR “Meta-Analysis”(Publication Type) OR metaanaly*(tiab) OR metanaly*(tiab) OR meta-analy*(tiab) OR meta synthes*(tiab) OR metasynthes*(tiab) OR meta ethnograph*(tiab) OR metaethnograph*(tiab) OR meta summar*(tiab) OR metasummar*(tiab) OR meta-aggregation(tiab) OR metareview(tiab) OR meta-review(tiab) OR overview of reviews(tiab) OR ((systematic*(ti) OR scoping(ti) OR umbrella(ti) OR meta-narrative(ti) OR metanarrative(ti) OR evidence based(ti)) AND (review*(ti) OR overview*(ti))) OR ((evidence(ti) OR narrative(ti) OR metanarrative(ti) OR qualitative(ti)) AND synthesis(ti)) OR systematic review(pt) OR prisma(tiab) OR preferred reporting items(tiab) OR quadas*(tiab) OR systematic review*(tiab) OR systematic literature(tiab) OR structured literature search(tiab) OR systematic overview*(tiab) OR scoping review*(tiab) OR umbrella review*(tiab) OR mapping review*(tiab) OR systematic mapping(tiab) OR evidence synthes*(tiab) OR narrative synthesis(tiab) OR metanarrative synthesis(tiab) OR research synthesis(tiab) OR qualitative synthesis(tiab) OR realist synthesis(tiab) OR realist review(tiab) OR realist evaluation(tiab) OR systematic qualitative review(tiab) OR mixed studies review(tiab) OR mixed methods synthesis(tiab) OR mixed research synthesis(tiab) OR quantitative literature review(tiab) OR systematic evidence review(tiab) OR evidence-based review(tiab) OR comprehensive literature search(tiab) OR integrated review*(tiab) OR integrated literature review(tiab) OR integrative review*(tiab) OR integrative literature review*(tiab) OR structured literature review*(tiab) OR systematic search and review(tiab) OR meta-narrative review*(tiab) OR metanarrative review(tiab) OR systematic narrative review(tiab) OR systemic review(tiab) OR systematized review(tiab) OR systematic research synthesis(tiab) OR bibliographic*(tiab) OR hand-search*(tiab) OR handsearch*(tiab) OR manual search*(tiab) OR searched manually(tiab) OR manually searched(tiab) OR journal database*(tiab) OR review authors independently(tiab) OR reviewers independently(tiab) OR independent reviewers(tiab) OR independent review authors(tiab) OR electronic database search*(tiab) OR (study selection(tiab) AND data extraction(tiab)) OR (selection criteria(tiab) AND data collection(tiab)) OR (selection criteria(tiab) AND data analysis(tiab)) OR (evidence acquisition(tiab) AND evidence synthesis(tiab)) OR (pubmed(tiab) AND embase(tiab)) OR (medline(tiab) AND embase(tiab)) OR (pubmed(tiab) AND cochrane(tiab)) OR (medline(tiab) AND cochrane(tiab)) OR (embase(tiab) AND cochrane(tiab)) OR (pubmed(tiab) AND psycinfo(tiab)) OR (medline(tiab) AND psycinfo(tiab)) OR (embase(tiab) AND psycinfo(tiab)) OR (cochrane(tiab) AND psycinfo(tiab)) OR (pubmed(tiab) AND web of science(tiab)) OR (medline(tiab) AND web of science(tiab)) OR (embase(tiab) AND web of science(tiab)) OR (psycinfo(tiab) AND web of science(tiab)) OR (cochrane(tiab) AND web of science(tiab)) OR ((literature(ti) OR qualitative(ti) OR quantitative(ti) OR integrated(ti) OR integrative(tiab) OR rapid(ti) OR short(ti) OR critical*(ti) OR mixed stud*(ti) OR mixed method*(ti) OR focused(ti) OR focussed(ti) OR structured(ti) OR comparative(ti) OR comparitive(ti) OR evidence(ti) OR comprehensive(ti) OR realist(ti)) AND (review*(ti) OR overview*(ti)) AND (literature search(tiab) OR structured search(tiab) OR electronic search(tiab) OR search strategy(tiab) OR gray literature(tiab) OR grey literature(tiab) OR Review criteria(tiab) OR eligibility criteria(tiab) OR inclusion criteria(tiab) OR exclusion criteria(tiab) OR predetermined criteria(tiab) OR included studies(tiab) OR identified studies(tiab) OR (systematic search(tiab) AND literature(tiab)) OR strength of evidence(tiab) OR citation*(tiab) OR references(tiab) OR database search*(tiab) OR electronic database*(tiab) OR data base search*(tiab) OR electronic data-base*(tiab) OR search criteria(tiab) OR study selection(tiab) OR data extraction(tiab) OR methodological quality(tiab) OR methodological characteristics(tiab) OR methodologic quality(tiab) OR methodologic characteristics(tiab))) OR ((literature review(tiab) OR literature search*(tiab)) AND (structured search(tiab) OR electronic search(tiab) OR Search strategy(tiab) OR gray literature(tiab) OR grey literature(tiab) OR review criteria(tiab) OR eligibility criteria(tiab) OR inclusion criteria(tiab) OR exclusion criteria(tiab) OR predetermined criteria(tiab) OR included studies(tiab) OR identified studies(tiab) OR (systematic search(tiab) AND literature(tiab)) OR strength of evidence(tiab) OR citation*(tiab) OR references(tiab) OR database search*(tiab) OR electronic database*(tiab) OR data base search*(tiab) OR electronic data-base*(tiab) OR search criteria(tiab) OR study selection(tiab) OR data extraction(tiab) OR methodological quality(tiab) OR methodological characteristics(tiab) OR methodologic quality(tiab) OR methodologic characteristics(tiab)))) NOT ("Comment" (Publication Type) OR "Letter" (Publication Type)) |
Embase
|
Search |
Query |
Items found |
|
#13 |
#11 AND #2 |
710 |
|
#12 |
#11 AND #1 |
84 |
|
#11 |
#10 AND #3 NOT ('conference abstract'/it OR 'editorial'/it OR 'letter'/it OR 'note'/it) NOT (('animal experiment'/exp OR 'animal model'/exp OR 'nonhuman'/exp) NOT 'human'/exp) |
2103 |
|
#10 |
#7 OR #8 OR #9 |
6123 |
|
#9 |
#6 AND #4 |
559 |
|
#8 |
#5 AND #6 |
333 |
|
#7 |
#4 AND #5 |
5783 |
|
#6 |
'flash glucose monitor*':ti,ab,kw OR 'flash continuous glucose monitor*':ti,ab,kw OR 'freestyle libre':ti,ab,kw OR freestylelibre:ti,ab,kw OR fcgm:ti,ab,kw OR 'flash cgm':ti,ab,kw OR 'flare-nl4':ti,ab,kw |
682 |
|
#5 |
'continuous glucose monitor*':ti,ab,kw OR 'continuous monitoring glucose':ti,ab,kw OR 'continuous monitoring of glucose':ti,ab,kw OR cgm:ti,ab,kw OR cgms:ti,ab,kw OR iscgm:ti,ab,kw OR 'freestyle navigator':ti,ab,kw OR dexcom:ti,ab,kw OR dg4p:ti,ab,kw OR dg5:ti,ab,kw OR minimed*:ti,ab,kw OR 620g:ti,ab,kw OR 640g:ti,ab,kw OR 670g:ti,ab,kw OR enlite:ti,ab,kw OR eversense:ti,ab,kw OR (vibe:ti,ab,kw AND animas:ti,ab,kw) OR omnipod:ti,ab,kw OR ‘t slim’:ti,ab,kw OR (tandem:ti,ab,kw AND (X2:ti,ab,kw OR IQ:ti,ab,kw OR pump:ti,ab,kw)) OR ‘closed loop’:ti,ab,kw OR 'artificial pancreas'/exp OR ‘artificial pancreas’:ti,ab,kw OR ‘bionic pancreas’:ti,ab,kw |
23385 |
|
#4 |
'blood glucose monitoring'/exp OR 'self-monitoring of blood glucose':ti,ab,kw OR 'self-monitoring blood glucose':ti,ab,kw OR 'self-monitored blood glucose':ti,ab,kw OR 'self-measured blood glucose':ti,ab,kw OR smbg:ti,ab,kw OR 'glucose self-monitoring':ti,ab,kw OR 'blood sugar self-monitoring':ti,ab,kw OR 'home blood glucose monitoring':ti,ab,kw OR 'conventional blood glucose monitoring':ti,ab,kw OR 'finger stick*':ti,ab,kw OR fingerstick*:ti,ab,kw OR 'finger prick*':ti,ab,kw OR fingerprick*:ti,ab,kw |
30900 |
|
#3 |
'insulin dependent diabetes mellitus'/exp OR ((diabetes:ti,ab,kw OR diabetic*:ti,ab,kw) AND ('insulin depend*':ti,ab,kw OR insulindepend*:ti,ab,kw OR 'insulin treat*':ti,ab,kw OR 'intensive insulin*':ti,ab,kw)) OR 'diabetes mellitus type 1':ti,ab,kw OR 'diabetes mellitus type i':ti,ab,kw OR 'diabetes mellitus type one':ti,ab,kw OR 'diabetes type 1':ti,ab,kw OR 'diabetes type i':ti,ab,kw OR 'type 1 diabet*':ti,ab,kw OR 'type i diabet*':ti,ab,kw OR 'type one diabet*':ti,ab,kw OR t1d*:ti,ab,kw OR 'dm type 1':ti,ab,kw OR 'dm type i':ti,ab,kw OR 'type 1 dm':ti,ab,kw OR iddm:ti,ab,kw OR 'juvenile diabet*':ti,ab,kw OR 'juvenile onset diabet*':ti,ab,kw OR 'early onset diabetes mellitus':ti,ab,kw OR 'ketoacidotic diabet*':ti,ab,kw OR 'labile diabetes mellitus':ti,ab,kw OR 'latent autoimmune diabetes in adults':ti,ab,kw OR 'brittle diabet*':ti,ab,kw |
164908 |
|
#2 |
('clinical trial'/exp OR 'randomization'/exp OR 'single blind procedure'/exp OR 'double blind procedure'/exp OR 'crossover procedure'/exp OR 'placebo'/exp OR 'prospective study'/exp OR rct:ab,ti OR random*:ab,ti OR 'single blind':ab,ti OR 'randomised controlled trial':ab,ti OR 'randomized controlled trial'/exp OR placebo*:ab,ti) NOT 'conference abstract':it |
2378435 |
|
#1 |
'meta-analysis'/exp OR 'meta-analysis' OR cochrane:ab OR embase:ab OR psycinfo:ab OR cinahl:ab OR medline:ab OR ((systematic NEAR/1 (review OR overview)):ab,ti) OR ((meta NEAR/1 analy*):ab,ti) OR metaanalys*:ab,ti OR 'data extraction':ab OR cochrane:jt OR 'systematic review'/exp OR 'systematic review' |
528222 |
Search 2
Algemene informatie
|
Richtlijn: Diabetes Mellitus 1 |
|
|
Uitgangsvraag: UV 5 Wat is de meerwaarde van een semi-closed loop systeem (combinatie sensor en pomp) voor volwassen met DM1 behandeld met CSII |
|
|
Database(s): Embase, Pubmed |
Datum: 23-04-2020 |
|
Periode: geen limitering |
Talen: geen limitering |
|
Literatuurspecialist: Alies van der Wal |
|
|
Toelichting en opmerkingen: Sleutelartikel PMID 31540557 ontbreekt in de set met SRs en RCTs omdat het een ander type publicaties is (review/ expert opinion). |
|
Zoekopbrengst
|
|
Embase |
Pubmed |
Ontdubbeld |
|
SRs |
43 |
29 |
49 |
|
RCTs |
413 |
194 |
421 |
|
Totaal |
1701 |
1644 |
|
Pubmed
|
Search |
Query |
Items found |
|
#7 |
#5 AND #2 |
|
|
#6 |
#5 AND #1 |
|
|
#5 |
#3 AND #4 NOT ("Comment"(Publication Type) OR "Letter"(Publication Type)) NOT ("Animals"(Mesh) NOT "Humans"(Mesh)) |
|
|
#4 |
(closed loop(tiab) OR MiniMed*(tiab) OR 640G(tiab) OR 670G(tiab) OR "Pancreas, Artificial"(Mesh) OR artificial pancreas(tiab) OR bionic pancreas(tiab) OR automated insulin delivery(tiab) OR t slim(tiab) OR (tandem(tiab) AND (X2(tiab) OR IQ(tiab) OR pump(tiab)))) |
|
|
#3 |
Search "Diabetes Mellitus"(Mesh:NoExp) OR "Diabetes Mellitus, Type 1"(Mesh) OR ((diabetes(tiab) OR diabetic*(tiab)) AND (insulin depend*(tiab) OR insulindepend*(tiab) OR insulin treat*(tiab) OR intensive insulin*(tiab))) OR diabetes mellitus type 1(tiab) OR diabetes mellitus type i(tiab) OR diabetes mellitus type one(tiab) OR diabetes type 1(tiab) OR diabetes type i(tiab) OR dm1(tiab) OR iddm(tiab) OR dm 1(tiab) OR t1d*(tiab) OR dm type 1(tiab) OR type 1 dm(tiab) OR type 1 diabet*(tiab) OR type I diabet*(tiab) OR dm type I(tiab) OR type one diabet*(tiab) OR juvenile diabet*(tiab) OR juvenile onset diabet*(tiab) OR early onset diabetes mellitus(tiab) OR ketoacidotic diabet*(tiab) OR labile diabetes mellitus(tiab) OR latent autoimmune diabetes in adults(tiab) OR brittle diabet*(tiab) |
|
|
#2 |
Search ((random*(tiab) AND (controlled(tiab) OR control(tiab) OR placebo(tiab) OR versus(tiab) OR vs(tiab) OR group(tiab) OR groups(tiab) OR comparison(tiab) OR compared(tiab) OR arm(tiab) OR arms(tiab) OR crossover(tiab) OR cross-over(tiab)) AND (trial(tiab) OR study(tiab))) OR ((single(tiab) OR double(tiab) OR triple(tiab)) AND (masked(tiab) OR blind*(tiab)))) |
|
|
#1 |
Search ("Meta-Analysis as Topic"(Mesh) OR “Meta-Analysis”(Publication Type) OR metaanaly*(tiab) OR metanaly*(tiab) OR meta-analy*(tiab) OR meta synthes*(tiab) OR metasynthes*(tiab) OR meta ethnograph*(tiab) OR metaethnograph*(tiab) OR meta summar*(tiab) OR metasummar*(tiab) OR meta-aggregation(tiab) OR metareview(tiab) OR meta-review(tiab) OR overview of reviews(tiab) OR ((systematic*(ti) OR scoping(ti) OR umbrella(ti) OR meta-narrative(ti) OR metanarrative(ti) OR evidence based(ti)) AND (review*(ti) OR overview*(ti))) OR ((evidence(ti) OR narrative(ti) OR metanarrative(ti) OR qualitative(ti)) AND synthesis(ti)) OR systematic review(pt) OR prisma(tiab) OR preferred reporting items(tiab) OR quadas*(tiab) OR systematic review*(tiab) OR systematic literature(tiab) OR structured literature search(tiab) OR systematic overview*(tiab) OR scoping review*(tiab) OR umbrella review*(tiab) OR mapping review*(tiab) OR systematic mapping(tiab) OR evidence synthes*(tiab) OR narrative synthesis(tiab) OR metanarrative synthesis(tiab) OR research synthesis(tiab) OR qualitative synthesis(tiab) OR realist synthesis(tiab) OR realist review(tiab) OR realist evaluation(tiab) OR systematic qualitative review(tiab) OR mixed studies review(tiab) OR mixed methods synthesis(tiab) OR mixed research synthesis(tiab) OR quantitative literature review(tiab) OR systematic evidence review(tiab) OR evidence-based review(tiab) OR comprehensive literature search(tiab) OR integrated review*(tiab) OR integrated literature review(tiab) OR integrative review*(tiab) OR integrative literature review*(tiab) OR structured literature review*(tiab) OR systematic search and review(tiab) OR meta-narrative review*(tiab) OR metanarrative review(tiab) OR systematic narrative review(tiab) OR systemic review(tiab) OR systematized review(tiab) OR systematic research synthesis(tiab) OR bibliographic*(tiab) OR hand-search*(tiab) OR handsearch*(tiab) OR manual search*(tiab) OR searched manually(tiab) OR manually searched(tiab) OR journal database*(tiab) OR review authors independently(tiab) OR reviewers independently(tiab) OR independent reviewers(tiab) OR independent review authors(tiab) OR electronic database search*(tiab) OR (study selection(tiab) AND data extraction(tiab)) OR (selection criteria(tiab) AND data collection(tiab)) OR (selection criteria(tiab) AND data analysis(tiab)) OR (evidence acquisition(tiab) AND evidence synthesis(tiab)) OR (pubmed(tiab) AND embase(tiab)) OR (medline(tiab) AND embase(tiab)) OR (pubmed(tiab) AND cochrane(tiab)) OR (medline(tiab) AND cochrane(tiab)) OR (embase(tiab) AND cochrane(tiab)) OR (pubmed(tiab) AND psycinfo(tiab)) OR (medline(tiab) AND psycinfo(tiab)) OR (embase(tiab) AND psycinfo(tiab)) OR (cochrane(tiab) AND psycinfo(tiab)) OR (pubmed(tiab) AND web of science(tiab)) OR (medline(tiab) AND web of science(tiab)) OR (embase(tiab) AND web of science(tiab)) OR (psycinfo(tiab) AND web of science(tiab)) OR (cochrane(tiab) AND web of science(tiab)) OR ((literature(ti) OR qualitative(ti) OR quantitative(ti) OR integrated(ti) OR integrative(tiab) OR rapid(ti) OR short(ti) OR critical*(ti) OR mixed stud*(ti) OR mixed method*(ti) OR focused(ti) OR focussed(ti) OR structured(ti) OR comparative(ti) OR comparitive(ti) OR evidence(ti) OR comprehensive(ti) OR realist(ti)) AND (review*(ti) OR overview*(ti)) AND (literature search(tiab) OR structured search(tiab) OR electronic search(tiab) OR search strategy(tiab) OR gray literature(tiab) OR grey literature(tiab) OR Review criteria(tiab) OR eligibility criteria(tiab) OR inclusion criteria(tiab) OR exclusion criteria(tiab) OR predetermined criteria(tiab) OR included studies(tiab) OR identified studies(tiab) OR (systematic search(tiab) AND literature(tiab)) OR strength of evidence(tiab) OR citation*(tiab) OR references(tiab) OR database search*(tiab) OR electronic database*(tiab) OR data base search*(tiab) OR electronic data-base*(tiab) OR search criteria(tiab) OR study selection(tiab) OR data extraction(tiab) OR methodological quality(tiab) OR methodological characteristics(tiab) OR methodologic quality(tiab) OR methodologic characteristics(tiab))) OR ((literature review(tiab) OR literature search*(tiab)) AND (structured search(tiab) OR electronic search(tiab) OR Search strategy(tiab) OR gray literature(tiab) OR grey literature(tiab) OR review criteria(tiab) OR eligibility criteria(tiab) OR inclusion criteria(tiab) OR exclusion criteria(tiab) OR predetermined criteria(tiab) OR included studies(tiab) OR identified studies(tiab) OR (systematic search(tiab) AND literature(tiab)) OR strength of evidence(tiab) OR citation*(tiab) OR references(tiab) OR database search*(tiab) OR electronic database*(tiab) OR data base search*(tiab) OR electronic data-base*(tiab) OR search criteria(tiab) OR study selection(tiab) OR data extraction(tiab) OR methodological quality(tiab) OR methodological characteristics(tiab) OR methodologic quality(tiab) OR methodologic characteristics(tiab)))) NOT ("Comment" (Publication Type) OR "Letter" (Publication Type)) |
Embase
|
Search |
Query |
Items found |
|
#7 |
#5 AND #2 |
413 |
|
#6 |
#5 AND #1 |
43 |
|
#5 |
#3 AND #4 NOT ('conference abstract'/it OR 'editorial'/it OR 'letter'/it OR 'note'/it) NOT (('animal experiment'/exp OR 'animal model'/exp OR 'nonhuman'/exp) NOT 'human'/exp) |
1701 |
|
#4 |
‘closed loop’:ti,ab,kw OR MiniMed*:ti,ab,kw OR 640G:ti,ab,kw OR 670G:ti,ab,kw OR 'artificial pancreas'/exp OR ‘artificial pancreas’:ti,ab,kw OR ‘bionic pancreas’:ti,ab,kw OR ‘automated insulin delivery’:ti,ab,kw OR ‘t slim’:ti,ab,kw OR (tandem:ti,ab,kw AND (X2:ti,ab,kw OR IQ:ti,ab,kw OR pump:ti,ab,kw)) |
15373 |
|
#3 |
'insulin dependent diabetes mellitus'/exp OR ((diabetes:ti,ab,kw OR diabetic*:ti,ab,kw) AND ('insulin depend*':ti,ab,kw OR insulindepend*:ti,ab,kw OR 'insulin treat*':ti,ab,kw OR 'intensive insulin*':ti,ab,kw)) OR 'diabetes mellitus type 1':ti,ab,kw OR 'diabetes mellitus type i':ti,ab,kw OR 'diabetes mellitus type one':ti,ab,kw OR 'diabetes type 1':ti,ab,kw OR 'diabetes type i':ti,ab,kw OR 'type 1 diabet*':ti,ab,kw OR 'type i diabet*':ti,ab,kw OR 'type one diabet*':ti,ab,kw OR t1d*:ti,ab,kw OR 'dm type 1':ti,ab,kw OR 'dm type i':ti,ab,kw OR 'type 1 dm':ti,ab,kw OR iddm:ti,ab,kw OR 'juvenile diabet*':ti,ab,kw OR 'juvenile onset diabet*':ti,ab,kw OR 'early onset diabetes mellitus':ti,ab,kw OR 'ketoacidotic diabet*':ti,ab,kw OR 'labile diabetes mellitus':ti,ab,kw OR 'latent autoimmune diabetes in adults':ti,ab,kw OR 'brittle diabet*':ti,ab,kw |
164908 |
|
#2 |
('clinical trial'/exp OR 'randomization'/exp OR 'single blind procedure'/exp OR 'double blind procedure'/exp OR 'crossover procedure'/exp OR 'placebo'/exp OR 'prospective study'/exp OR rct:ab,ti OR random*:ab,ti OR 'single blind':ab,ti OR 'randomised controlled trial':ab,ti OR 'randomized controlled trial'/exp OR placebo*:ab,ti) NOT 'conference abstract':it |
2377774 |
|
#1 |
'meta-analysis'/exp OR 'meta-analysis' OR cochrane:ab OR embase:ab OR psycinfo:ab OR cinahl:ab OR medline:ab OR ((systematic NEAR/1 (review OR overview)):ab,ti) OR ((meta NEAR/1 analy*):ab,ti) OR metaanalys*:ab,ti OR 'data extraction':ab OR cochrane:jt OR 'systematic review'/exp OR 'systematic review' |
528003 |
- Achtergrond en definities
- Toepassen
- Onderzoek
- Overige