Diagnostiek 0 tot 9 maanden
Uitgangsvraag
Welke audiologische diagnostiek moet verricht worden om de gehoordrempels vast te stellen, bij kinderen met een ontwikkelingsleeftijd tot 9 maanden?
Aanbeveling
- Gebruik frequentie-specifieke ABR-stimuli, overweeg hierbij chirps, voor het bepalen van gehoordrempels bij kinderen met een ontwikkelingsleeftijd van 0-9 maanden.
- Meet de frequenties 4, 1 en 2 kHz in deze volgorde van prioriteit.
- Overweeg aanvullend de frequentie 0.5 kHz te meten.
- Meet bij een gevonden gehoorverlies een bovendrempelige klik-ABR om de latentietijden met normwaarden te vergelijken om de neurale integriteit te beoordelen. Voer in geval van vlakke responsen bij 80 dB nHL een controle op ANSD uit.
Overwegingen
We willen de gehoordrempels van kinderen 0-9 maanden in kaart brengen middels ABR-onderzoek. Het probleem is dat we bij het bepalen van de betrouwbaarheid/correctheid van deze drempel niet gebruik kunnen maken van een gouden standaard. De gouden standaard voor het bepalen van gehoordrempels is toonaudiometrie. Bij kinderen van 0-9 maanden is het niet mogelijk toonaudiometrie te verrichten. Als vergelijk gebruiken we daarom diagnostiek op latere leeftijd en we beperken ons daarbij tot kinderen met een vermoedelijk stabiel gehoor zonder middenoorproblemen. Een uitzondering op het vergelijken met de gouden standaard is de ABR-meting tussen 6-9 maanden, waarbij niet vergeleken wordt met de gouden standaard maar met de VRA waarbij de meetonzekerheid in het algemeen wat groter is.
Voor deze module is een systematische literatuursearch uitgevoerd. Er zijn 12 artikelen die voldoen aan de PICO. Mede door de heterogeniteit in de studie opzet en studie populaties, zijn de resultaten van de studies niet gepoold en is afgewaardeerd voor risk of bias. In 9 van de geïncludeerde studies is de Pearson correlatiecoëfficiënt gerapporteerd. Over het algemeen vallen de correlatiecoëfficiënten hoog uit in al deze studies. Dit zegt echter alleen iets over de mate van samenhang van de testuitkomsten, en niet over de nauwkeurigheid en/of correctheid van de uitkomsten. Bij deze literatuursearch is er geen betere statistische methode voorhanden dan de correlatiecoëfficiënt. Hierdoor kan geen uitspraak worden gedaan over de betrouwbaarheid van de ASSR, ABR of audiometrie. Wel is uit de resultaten te zien dat de ASSR en ABR beide met gelijkwaardige accuratesse gebruikt kunnen worden als voorspellers voor toonaudiometrische drempels die op latere leeftijd gemeten kunnen worden. In de GRADE-beoordeling is afgewaardeerd voor indirectheid, om bovenstaande redenen. De GRADE-beoordeling is daarom voor de vergelijking tussen ASSR en audiometrie (Pearson correlatie), en tussen ABR en audiometrie (Pearson correlatie) uitgekomen op Laag.
Er zijn 2 studies die een intraclass correlation coefficient (ICC) rapporteren (Delaroche, 2006; Rodrigues, 2010a). Delaroche rapporteert een ICC van ABR en audiometrie op latere leeftijd van 0.92, 0.95, 0.96 en 0.96 voor 0.5, 1, 2, en 4 kHz. Dit betekent een hele hoge correlatie. Delaroche (2006) rapporteert ook een ICC van 0.74 voor ABR en audiometrie op dezelfde leeftijd. Rodrigues (2010a) rapporteert een ICC van 0.70, 0.64, 0.49, 0.69, 0.63 en 0.68 voor 1, 2, 4, 1-2, 2-4, en 1-2-4 kHz, voor ABR en ASSR op dezelfde leeftijd gemeten. Omdat er helaas maar 1 studie per vergelijking is gevonden, kan geen GRADE-beoordeling worden uitgevoerd.
Waarden en voorkeuren van patiënten (en evt. hun verzorgers)
Het doel van het onderzoek is om de gehoordrempel nauwkeurig in kaart te brengen om ten eerste te bepalen of audiologische zorg nodig is, ten tweede om de meest passende interventie te selecteren en ten derde om die goed in te kunnen zetten. Nadeel van heel nauwkeurig willen meten is dat het tijd kost, omdat er soms een herhaling nodig is als het kind niet goed meetbaar is.
Kosten (middelenbeslag)
In de analyse van de literatuur is geen kosteneffectiviteit meegenomen. De kosten voor de patiënt zijn minimaal, gezien het onderzoek en de hoorhulpmiddelen uit de basisverzekering worden vergoed.
Volgens een rapport van de WHO (World Report on Hearing 2021) levert elke geïnvesteerde dollar in audiologische zorg 16 dollar op. De hier onderzochte diagnostiek wordt verricht bij kinderen die uitvallen op de neonatale gehoorscreening. Bij deze kinderen is er een risico gevonden op gehoorverlies.
De kosten van multi-frequentie onderzoek versus enkelvoudig breedbandig onderzoek bij deze groep kinderen is verwaarloosbaar als het gaat om extra materiaal-benodigdheden (hoogstens een extra licentie op de huidige software). Het multi-frequentie onderzoek kost hoogstens extra tijd. Wij schatten dat de kosten hiervan niet opwegen tegen de kosten van gemist gehoorverlies door de enkelvoudige breedbandige test, wat leidt tot complexere diagnostiek op latere leeftijd en (gedeeltelijke) uitval op één of meerdere aspecten zoals taal-/spraakontwikkeling en/of sociaal-emotionele ontwikkeling van het kind.
Aanvaardbaarheid, haalbaarheid en implementatie
Het inzetten van ABR-onderzoek is een interventie die al jarenlang routinematig wordt gebruikt bij kinderen die niet slagen voor de neonatale gehoorscreening. Ook het gebruik van frequentie-specifiek ABR-onderzoek wordt al jarenlang succesvol ingezet.
Een overweging om frequentie-specifiek ABR-onderzoek te verrichten in plaats van middels klik-ABR-onderzoek is om het risico op fouten in de drempelbepaling per frequentie te minimaliseren.
We zien praktische voordelen van ABR boven ASSR, omdat je bij ABR tijdens de meting al inzicht verkrijgt over de uitkomsten. Ook is achteraf herbeoordeling bij ABR mogelijk, bij ASSR niet; het is een black box. Daarnaast is ABR nodig voor het beoordelen van de neurale integriteit. Er zou dus 1 softwaremodule gebruikt kunnen worden voor zowel beoordeling van neurale integriteit als voor drempelbepaling. Overweeg daarom het gebruik van ABR boven ASSR.
Rationale van de aanbeveling
De literatuur voor de huidige zoekvraag laat geen significant verschil zien tussen de verschillende typen ABR-onderzoek (klik ABR, frequentie specifieke ABR, ASSR) voor luchtgeleiding als het gaat om het bepalen van de gehoordrempels bij kinderen van 0-9 maanden.
Er is echter literatuur die laat zien dat frequentie-specifiek ABR-onderzoek meer betrouwbare, correcte en volledige informatie geeft over het gehoorverlies (Ferm 2013; Ferm & Lightfoot 2015; Stevens 2013) dan niet-frequentie-specifiek ABR-onderzoek. Deze literatuur komt niet terug uit de literatuursearch voor deze zoekvraag omdat in deze literatuur geen directe vergelijking wordt gemaakt met de door ons gekozen gouden standaard.
Op basis van de gevonden literatuur zijn binnen het voor het auditief functioneren de frequenties 0.5, 1, 2, en 4 kHz relevant en bruikbaar voor het verrichten van ABR-onderzoek bij kinderen van 0-9 maanden (Delaroche, 2006; Rodrigues, 2010a). Uit de klinische praktijk blijkt het meten van 0.5 kHz een minder scherp piekenpatroon op te leveren, en daarmee een beperkte signaal-ruisverhouding. Daarmee is de betrouwbaarheid van de drempelschatting bij de lage frequenties matig. Er wordt daarom aanbevolen om ABR-onderzoek bij 0.5 kHz alleen selectief in te zetten. Op basis van literatuur adviseren we het gebruik van chirps als frequentie-specifieke stimulus vanwege kort benodigde meettijd en hoge signaal-ruisverhouding (Ferm 2013; Ferm & Lightfoot 2015). We bevelen aan om te meten in de volgorde van frequentie van 4, 1 en 2 kHz.
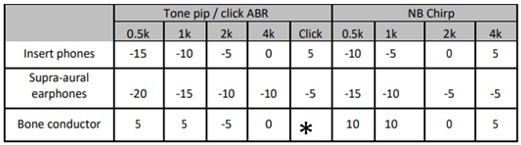
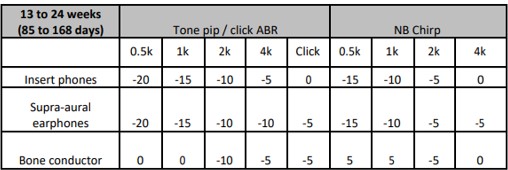
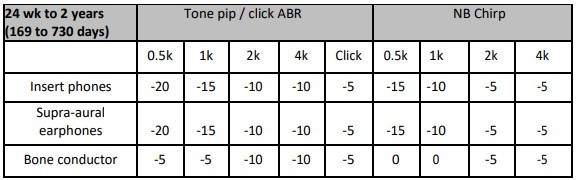
De responsdrempels worden middels ABR gemeten in dB nHL. Deze drempels moeten omgerekend worden naar geschatte toondrempels in dB eHL. Zie hiervoor onderstaande tabellen 1, 2 en 3 voor correctiewaarden van de CE NB-Chirps, afkomstig uit de British Society of Audiology-richtlijn (British Society of Audiology, 2021). Check de door de fabrikant aangegeven correctiewaarden indien er andere Chirps dan de CE NB-Chirps gebruikt worden. Vervolgens dient beoordeeld te worden of er op basis van de gevonden drempels (in eHL) sprake is van een gehoorverlies waarvoor interventie (hoorhulpmiddel en/of begeleiding) nodig is.
Tabel 1 Correctiewaarden - ABR onderzoek t/m 12 weken (84 dagen) gecorrigeerde leeftijd. Correctiewaarden moet bij de gevonden responsdrempel opgeteld worden. De cel met een asterisk (*) bevat in de oorspronkelijke tabel een verwijzing naar een andere tabel uit de bron, die niet van toepassing is in deze richtlijn
Tabel 2 Correctiewaarden - ABR onderzoek tussen 12 en 24 weken (85 tot 168 dagen) gecorrigeerde leeftijd. Correctiewaarden moet bij de gevonden responsdrempel opgeteld worden
Tabel 3 Correctiewaarden - ABR onderzoek tussen 24 weken en 2 jaar (169 tot 730 dagen) gecorrigeerde leeftijd. Correctiewaarden moet bij de gevonden responsdrempel opgeteld worden
Wanneer middels frequentie-specifiek ABR-onderzoek een gehoorverlies wordt gevonden, wordt aanbevolen om de meting aan te vullen met een bovendrempelige respons op of rond 80 dB nHL met klikstimulus om de neurale integriteit van de gehoorzenuw te kunnen beoordelen. Daarnaast wordt aanbevolen om bij vlakke responsies te bepalen of er aanwijzingen zijn voor auditieve neuropathie (ANSD). Dit wordt gedaan middels een 80 dB nHL klikstimulus, waarbij in de analyse het condensatie en rarefactiesignaal wordt gesplitst, zodat eventueel aanwezige cochleaire microfonie kan worden vastgesteld. Een controlerun met dicht geknepen transducerslang is hierbij nodig om een stimulusartefact uit te sluiten.
Om de aard van het gehoorverlies vast te stellen is het aanbevolen om de frequentie-specifieke ABR-meting via luchtgeleiding aan te vullen met impedantiemetrie, OAE-meting en/of ABR-meting via beengeleiding.
Ondanks de lage tot zeer lage bewijskracht van de GRADE is onze aanbeveling sterk geformuleerd vanwege de klinisch ervaren relevantie.
Onderbouwing
Achtergrond
Gehoorverlies kan een negatief effect hebben op de ontwikkeling van kinderen. Hoorrevalidatie is een van de manieren om het risico op negatieve effecten en de mate waarin deze optreden te beperken. Om tot een adequate hoorrevalidatie te komen is het vroegtijdig en betrouwbaar bepalen van de gehoordrempels nodig. De gouden standaard voor het bepalen van de gehoordrempels is toonaudiometrie. Deze testmethode is echter niet haalbaar bij baby’s en jonge kinderen. Daarom wordt voor kinderen met een ontwikkelingsleeftijd tot 9 maanden van oudsher, naast impedantiemetrie en oto-akoestische emissies (OAE)meting, auditory brainstem response (ABR) onderzoek met een klikstimulus gebruikt (Drift 1988) om de aard en ernst van gehoorverlies te bepalen. Recenter zijn nieuwe elektrofysiologische meetmethoden mogelijk geworden, bijvoorbeeld de mogelijkheid om frequentie-specifiek te stimuleren. Tevens is er de auditory steady state response (ASSR) waarbij niet de reactie op de stimulus zelf gemeten wordt (zoals bij ABR) maar de detectie van de amplitudemodulatie- en/of de frequentiemodulatie van de stimulus. Binnen deze uitgangsvraag onderzoeken we de verschillen tussen ABR en ASSR. We onderzoeken of er tussen ABR en ASSR een verschil is in voorspellende waarde voor toonaudiometrische drempels op dezelfde/latere leeftijd.
De uitvoering van een OAE-meting en impedantiemetrie worden buiten beschouwing gelaten daar deze in een diagnostisch traject naar de gehoordrempels niet sensitief/specifiek genoeg zijn. Ook de ABR en ASSR via beengeleiding wordt buiten beschouwing gelaten. Het uitvoeren/toevoegen van deze metingen moet uiteraard wel overwogen worden om de aard van het gehoorverlies vast te kunnen stellen.
In het veld is er veel praktijkvariatie. Deze zoekvraag leidt tot aanbevelingen m.b.t. welke diagnostiek het best de aard en omvang van gehoorverlies kan bepalen bij kinderen met een ontwikkelingsleeftijd van 0-9 maanden.
Conclusies / Summary of Findings
1. ASSR vs audiometry
Pearson correlation coefficients
|
Low GRADE |
ASSR may have similar diagnostic accuracy when compared with audiometry in children with hearing loss aged 0-9 months.
Sources: Chou, 2012; Rodrigues, 2010b; Savio, 2006; Rance, 2002a; Rance, 2002b |
2. ABR vs audiometry
Pearson correlation coefficients
|
Low GRADE |
ABR may have similar diagnostic accuracy when compared with audiometry in children with hearing loss aged 0-9 months.
Sources: Chou, 2012; Rodrigues, 2010b; Savio, 2006; Stevens, 2013; Xu, 2014 |
Intraclass correlation coefficients
|
No GRADE |
Due to the absence of multiple comparative studies, no GRADE could be performed on ABR when compared with audiometry in children with hearing loss aged 0-9 months.
Sources: Delaroche, 2006 |
3. ABR vs ASSR
Pearson correlation coefficients
|
No GRADE |
Due to the absence of multiple comparative studies, no GRADE could be performed on ABR when compared with ASSR in children with hearing loss aged 0-9 months.
Sources: Nunez-Batalla, 2016; Rodrigues, 2010b |
Intraclass correlation coefficients
|
No GRADE |
Due to the absence of multiple comparative studies, no GRADE could be performed on ABR when compared with ASSR in children with hearing loss aged 0-9 months.
Sources: Rodrigues, 2010a |
Samenvatting literatuur
Abbreviations used in the summary of literature
(c)ABR: (click) auditory brainstem responses
ASSR: auditory steady-state responses
AUC: area under the curve
BA behavioural audiometry
BERA: brainstem evoked auditory responses
BOA behavioural observation audiometry
ICC: intraclass correlation coefficient
MSSR: multiple auditory steady state responses
NPV: negative predictive value
PCHI permanent childhood hearing impairment
PPV: positive predictive value
PTA: pure tone audiometry
VRA: visual reinforcement audiometry
Description of studies
The used primary outcome measures per study are shown in the evidence table and summarized in Table 1. Of note, none of the studies reported diagnostic accuracy with PPV, NPV or AUC.
Table 1: Overview of study characteristics included in this analysis
|
Study |
Comparison |
|
|
Outcome measure |
|
|
ASSR |
ABR |
Audiometry |
|
|
Baldwin (2013) |
|
Click-ABR |
PTA |
Pearson correlation coefficients (r) |
|
Chou (2012) |
Multi-stimulus ASSR |
|
Play audiometry, PTA |
Pearson correlation coefficients (r) |
|
Delaroche (2006) |
|
ABR |
Behavioral audiometry |
ICC |
|
Lu (2017) |
|
Click-ABR |
PTA |
Pearson correlation coefficients (r) |
|
Nunez-Batalla (2016) |
ASSR |
ABR |
|
Pearson correlation coefficients (r) |
|
Rance (2002a) |
ASSR |
|
Behavioral audiometry |
Pearson correlation coefficients (r) |
|
Rance (2002b) |
ASSR |
|
Behavioral audiometry |
Pearson correlation coefficients (r) |
|
Rodrigues (2010a) |
ASSR |
BERA / click-ABR |
|
ICC+McNemar test |
|
Rodrigues (2010b) |
ASSR |
Tone-evoked BERA |
PTA, behavioral threshold, VRA |
Pearson correlation coefficients (r) |
|
Savio (2006) |
Multiple ASSR |
Click-ABR |
Behavioral audiometry, PTA |
Pearson correlation coefficients (r) |
|
Stevens (2013) |
|
Tone-pip ABR Click-ABR |
Behavioral audiometry |
Pearson correlation coefficients (r) |
|
Xu (2014) |
|
Chirp-ABR |
VRA |
Pearson correlation coefficients (r) |
1. ASSR vs audiometry
Chou (2012) conducted a retrospective chart review to investigate whether multi-stimulus ASSR were capable of estimating hearing thresholds in high-risk infants. Three tertiary care centers in Taiwan participated. Infants born between January 2004 and December 2006 and aged <13 months were enrolled in the study if they met the inclusion criteria, which included risk factors for congenital hearing loss. Subjects with mental retardation and otitis media were excluded by pediatric psychiatrists and otolaryngologists. Subjects received multi-stimulus ASSR measurements at infancy and audiometry at a later age. The maximum stimulation level for ASSR was 120 dB HL, and the volume was increased in steps of 10 dB. The inter-electrode impedance was less than 10 kOhm at 260 Hz. The multi-stimulus stimuli consisted of four carrier frequencies (0.5, 1, 2 and 4 kHz) with amplitude modulation at a rate of 77, 85, 93 and 101 Hz for the left ear stimuli and 79, 87, 95, and 103 for the right ear stimuli. Play audiometry was performed to obtain tone thresholds. A pure tone threshold measurement was obtained at age 23-48 months for each ear in all subjects using a clinical audiometer (GSI, Grason-Stadler, G1 clinical audiometer, Madison, WI, USA). Pure tone thresholds were obtained at 0.5, 1, 2 and 4 kHz via insertion-phones or headphones and the employment of a standard threshold searching procedure using a 5 dB up and 10 dB down technique. The maximum stimulation intensity was 120 dB HL with intensity steps of 5 dB. In total, 249 high-risk infants were enrolled, of which 33 were lost to follow-up. Pearson’s correlation linear correlation was reported as outcome measure.
Rodrigues (2010b) performed a prospective study to compare ASSRs to tone-evoked ABR and to behavioral thresholds obtained on follow-up audiometry at 0.5, 1, 2 and 4 kHz in infants and young children. The study included 17 infants and young children ages between 2 months and 3 years old (average 11 months), with sensorineural hearing loss. The ASSRs thresholds were compared with the tone-evoked ABR thresholds, and with the behavioral thresholds obtained on follow-up audiometry. Pearson correlation coefficients were reported as outcome measure.
Savio (2006) conducted a diagnostic study to determine the test accuracy and prognostic validity of Multiple Auditory Steady State Responses (MSSR) and click Auditory Brainstem Responses (cABR) when compared within the context of a targeted screening protocol. A sample of 508 high-risk babies were selected. All babies included in the study were born between February 1999 and January 2001. At the corrected age of 3 months, babies received MSSR and cABR tests. All babies screened were called back between three and four years of age for behavioral audiometric testing and psychological assessment. At the first test, children received cABR and MSSR and pass/fail criteria were set at 40 dB nHL for both methods (equivalent to 75 dB pSPL for the click and 62 dB SPL RMS for the multiple frequency stimuli). At the first follow up, children again received cABR and MSSR (0.5, 1, 2 and 4 kHz). Pearson correlation and diagnostic accuracy were reported as outcome measure.
Rance (2002a) studied the evoked potential and behavioral hearing test findings for 200 infants and young children 1 to 8 months in whom permanent, moderate to profound hearing loss was diagnosed with the auditory steady-state response (ASSR) procedure. Findings at the time of the ASSR evaluation (mean age 3 months) are presented in this study. The subjects were all referred for ASSR testing after failure on a click-evoked ABR screening assessment (ABR threshold of >40 dB nHL in both ears). Inclusion criteria were "elevated" ASSR thresholds (>60 dB HL) at any test frequency, and no evidence of middle ear disease. All children had at least one of the following risk factors: prematurity with hypoxia, a family history of hearing loss, jaundice, maternal infection, meningitis, malformation, other. 184 of the 200 children appeared to have sensorineural hearing loss. The most common risk factor in this group was prematurity with hypoxia and a family history of hearing loss. The remaining 16 children suffered from a neural transmission disorder, and their most common risk factor was jaundice. These two groups of children were analyzed separately in this study. For this document, the group of children with a neural transmission disorder was not included. ASSR testing was performed in a sound-treated room with the child in natural sleep. The test stimuli were 500-Hz, I-kHz, 2-kHz, and 4-kHz tones that were amplitude and frequency modulated at a rate of 90 Hz. ASSR thresholds were obtained by increasing the presentation level in IO-dB steps from a starting point around 60 dB HL until a statistically significant, phase-locked response could be obtained. The stimulus level was then decreased in 5-dB steps until the distribution of phase angles became random. Behavioral audiograms were obtained for each ear (monaural stimulation) under headphones or insert earphones for all subjects by means of conditioned audiometric techniques (visual response audiometry). Threshold levels were determined by a 10-dB-down, 5-dB-up search procedure. The test stimuli were warble tones at octave frequencies from 500 Hz to 4 kHz. Pearson correlation coefficients were reported as outcome measure.
Rance (2002b) conducted another study (in the same case series reported by Rance 2002a) to examine the relationship between ASSR thresholds determined in infancy and subsequently obtained behavioral hearing levels in children with normal hearing or varying degrees of sensorineural hearing loss. In total, 211 infants were included (age 1-8 months, mean age 3.2 months). ASSR procedures were similar to Rance (2002a). Pearson correlation coefficients were reported as outcome measure.
2. ABR vs audiometry
Baldwin (2013) performed a study to investigate the accuracy of the cABR when undertaken below the age of 6 months (from expected date of delivery) in predicting the pure-tone thresholds subsequently found to be present in children with a congenital permanent childhood hearing impairment. Subjects were selected if they had a bilateral PCHI of mild or worse degree and had received both a cABR undertaken below the age of 6 months (from the expected date of delivery), and subsequent reliable ear-specific PTA. Those with a temporary external or middle ear blockage present at either test were excluded. During the 14-year period there were 92 (44 female and 48 male) participants who fulfilled these criteria. Subjects received cABR before the age of 6 months and received PTA at 2.6 to 12.8 years, with a mean age of 5.2 years (SD = 2.2). Pearson correlation coefficients (r) were reported as outcome measure.
Delaroche (2006) performed a study to investigate the validity of a specific audiometric protocol (the Delaroche protocol) for assessing hearing in infants with bilateral sensorineural hearing loss. The study involved infants aged 4 to 18 months who had been diagnosed with bilateral sensorineural hearing loss. A total of 105 infants were included in the study (of which 51 boys and 54 girls). In the cross-sectional study, 78 babies were included (36 boys, 42 girls; median age 11 months at ABR and 12 months at BA). 50 infants were included in the longitudinal study. For all these children age at first behavioral audiometric test ranged between 4 and 18 months (median = 12 months, mean = 10 months, standard deviation = 3.27 months) and follow-up demonstrated a stable hearing loss until the age of 3 or 4 years (median age at last examination for this report = 39 months, mean = 40 months, standard deviation = 6.46 months) Delaroche Protocol: The Delaroche protocol involves a series of auditory tests designed to assess various aspects of hearing, such as sound localization, discrimination, and threshold detection. Behavioral Responses: During the audiometric assessment, the infants' behavioral responses to auditory stimuli were observed, including head-turning and attention to sound sources. ABR was compared to behavioral audiometry. Interclass correlation (ICC) and sensitivity were reported as outcome measure.
Lu (2017) conducted a study to examine whether behavioral pure-tone audiometry (PTA) thresholds in children can be accurately estimated from the corresponding infants' click-evoked auditory brainstem response (ABR). 104 children (82, both ears; 22, one ear; total, 186 ears) received regular follow-up and were recruited as subjects. The PTA machine, GSI 61, was used for behavioral hearing assessment. BOA or VRA was performed in babies were aged 6-36 months and PTA (to determine thresholds at frequencies of 0.5, 1, 2, and 4 KHz) in those older than 3 years. Click ABR was performed using the following parameters: stimulus sound type, click; transducer, earphone; stimulus sound duration, 100 ms; repetition rate (RR), 27.7/s; and number of sweeps, 1500 times/s; additional settings were click-stimulus with rarefaction polarity, 16-ms time window of analysis, and filter settings of 100-1500 Hz. Pearson correlation coefficients (r) were reported as outcome measure.
Rodrigues (2010b) also reported on ABR vs audiometry. For a summary of the article, see above.
Savio (2006) also reported on ABR vs audiometry. For a summary of the article, see above.
Stevens (2013) conducted a study to investigate the predictive value of hearing assessment by the ABR following universal newborn hearing screening. All babies (N=94) born between January 2002 and September 2007 referred from the Sheffield, UK universal newborn hearing screen who, following assessment, were considered to have significant hearing impairment in at least one ear were included in the study. Click-ABR was performed on all 160 ears and a tone-pip-ABR was recorded at 4 kHz in 34 left and 37 right ears, and for 1 kHz in 19 left and 18 right ears. For the 160 ears included, with an ABR threshold, good ear and frequency specific thresholds from follow up were available in 94 ears. All available hearing tests carried out following the ABR hearing assessment were examined and used to determine the true hearing level in each ear of the infants. The age at which a satisfactory ear and frequency specific threshold could be obtained varied, depending in part of the child ’ s ability to perform the test. The mean age for the follow up test results used was 3.86 years, with a SD of 1.55 years. Two thirds of the tests were PTA or play audiometry, and one third insert VRA. A linear regression analysis was carried out between the ABR thresholds, and the behavioral thresholds found on follow up as well as calculating the correlation between the two thresholds.
Xu (2014) conducted a study to investigate the clinical usefulness of the LS-chirp auditory brainstem response for estimation of behavioral thresholds in young children aged 6–12 months with mild to severe hearing losses. 68 infants (mean age = 9.2 months) with bilateral mild to severe hearing losses were included. In all cases, the children were referred for chirp-ABR and VRA measurements following failure on a click-evoked ABR screen assessment. All ABR thresholds were >40 dB nHL and ≤ 90 dB nHL in both ears. The VRA thresholds were measured at 0.25, 0.5, 1, 2, and 4 kHz in 136 ears of 68 infants, whereas the LS-chirp ABR thresholds were also performed in 136 ears of 68 infants at the LFchirp (0.1–0.85 kHz) and the HF-chirp (1–10 kHz). Pearson correlation coefficients were reported as outcome measure.
3. ABR vs ASSR
Nunez-Batalla (2016) conducted a cohort study to assess auditory-steady-state response reliability in the audiological diagnosis after neonatal hearing screening. Inclusion criteria were a) that auditory brainstem and auditory steady-state response had been performed with no methodological problems, with clear results (b) that behavioral audiometry had been carried out until results considered definitive had been obtained. No exclusion criteria were mentioned. In total, 35 infants were included. ABR and ASSR were performed at a mean age of 4 months. Impedance remained below 6 kOhm and inter-electrode impedance higher than 4 kOhm. The auditory evoked potential recordings were obtained after they were amplified using an external preamplifier. The adjustments made to the equipment were as recommended by the Nottingham group to optimize ABR recording in neonates and lactating infants: click-type stimuli repeated 49.1 times per second with alternate polarity and low pass filters of 1500 Hz and high pass filters of 50 Hz. The minimum intensity at which the stimuli were presented was 30 dB through insert earphones. Recording of steady-state evoked auditory potentials enabled the 2 ears to be assessed at the same time and up to 4 frequencies to be used per ear. The filters used are high pass between 40 Hz and 90 Hz and low pass between 320 Hz and 720 Hz, with slopes of 6 dB per octave and a gain of 10000. The infant audiometry was performed at the age of 6-12 months and was undertaken in the regional program’s hearing aid office in accordance with the current protocol. Pearson regression coefficients were reported as outcome measures.
Rodrigues (2010a) conducted a cross-sectional cohort study to investigate the agreement level between results obtained from ASSR and click-ABR in a group of children aged between 2 and 36 months with sensorineural hearing loss, to study the clinical applicability of this technique to evaluate the hearing status in young children. 15 children with a diagnosis of sensorineural hearing loss were included. The outcome measure was correlation between the responses of the two tests and was evaluated by intraclass correlation coefficient and McNemar test comparing the probability of responses in both tests.
Rodrigues (2010b) also reported on ABR vs ASSR. For a summary of the article, see above.
Results
1. ASSR vs audiometry
Pearson correlation coefficients
Chou (2012) reported that the Pearson correlation coefficients (r) between the ASSR levels and pure tone thresholds were 0.88, 0.94, 0.94 and 0.97 at 0.5, 1, 2 and 4 kHz, respectively.
Rodrigues (2010b) reported that the Pearson correlation coefficients (r) between the ASSR levels and pure tone thresholds were 0.94, 0.97, 0.96, and 0.94 at 0.5, 1, 2 and 4 kHz, respectively.
Savio (2006) reported that the Pearson correlation coefficient between ASSR and audiometry were 0.88, 0.93, 0.98, and 0.95 at 0.5, 1, 2 and 4 kHz respectively.
Rance (2002a) reported that the Pearson correlation coefficients (r) between the ASSR levels and behavioral audiometry were 0.86, 0.81, 0.93, and 0.89 for 0.5, 1, 2 and 4 kHz, respectively.
Rance (2002b) reported that the Pearson correlation coefficients (r) between the ASSR levels and behavioral audiometry were 0.96, 0.97, 0.98, and 0.97 for 0.5, 1, 2 and 4 kHz, respectively. See Table 2 for a summary of results.
Table 2: Overview of results studies comparing ASSR and audiometry
|
|
Chou (2012) |
Rodrigues (2010b) |
Savio (2006) |
Rance (2002a) |
Rance (2002b) |
|
0.5 kHz |
0.88 |
0.94 |
0.88 |
0.86 |
0.96 |
|
1 kHz |
0.94 |
0.97 |
0.93 |
0.81 |
0.97 |
|
2 kHz |
0.94 |
0.96 |
0.98 |
0.93 |
0.98 |
|
4 kHz |
0.97 |
0.94 |
0.95 |
0.89 |
0.97 |
2. ABR vs audiometry
Pearson correlation coefficients
Baldwin (2013) reported that the Pearson correlation coefficients between ABR and PTA were 0.81, 0.85, 0.87, and 0.89 at 0.5, 1, 2 and 4 kHz respectively.
Lu (2017) reported that the Pearson correlation coefficients between ABR and PTA were 0.69, 0.69, 0.73, and 0.76 at 0.5, 1, 2 and 4 kHz respectively.
Rodrigues (2010b) reported that the Pearson correlation coefficients between ABR and PTA were 0.94, 0.81, 0.90, and 0.87 at 0.5, 1, 2 and 4 kHz respectively.
Savio (2006) reported that the Pearson correlation coefficient between ABR and behavioral audiometry was 0.88 (ABR was performed using non-frequency specific click stimuli).
Stevens (2013) reported that the Pearson correlation coefficients between ABR and PTA were 0.74, 0.74, 0.74, and 0.73 at 0.5, 1, 2 and 4 kHz respectively.
Xu (2014) reported that the best correlations between LS-chirp ABR thresholds and VRA thresholds were obtained at VRA frequency of 0.25 kHz/LF-chirp-ABR (r = 0.98) and VRA frequency of 1 kHz/HFchirp-ABR (r = 0.98). See Table 3 for a summary of results.
Table 3: Overview of results studies comparing ABR and audiometry
|
|
Baldwin (2013) |
Lu (2017) |
Rodrigues (2010b) |
Savio (2006) |
Stevens (2013) |
Xu (2014) |
|
0.25 kHz |
- |
- |
- |
0.88 |
- |
0.98 |
|
0.5 kHz |
0.81 |
0.69 |
0.94 |
0.74 |
- |
|
|
1 kHz |
0.85 |
0.69 |
0.81 |
0.74 |
0.98 |
|
|
2 kHz |
0.87 |
0.73 |
0.90 |
0.74 |
- |
|
|
4 kHz |
0.89 |
0.76 |
0.87 |
0.73 |
- |
Intraclass correlation coefficients
Delaroche (2006) reported intraclass correlation coefficients of 0.92, 0.95, 0.96 and 0.96 at 0.5, 1, 2 and 4 kHz respectively (ABR measured at 4-18 months and audiometry measured at 3-4 years). Delaroche (2006) reported that when thresholds were obtained with ABR and BA, the agreement between both methods measured by an intraclass correlation coefficient was good (0.74).
3. ABR vs ASSR
Nunez-Batalla (2016) reported the following:
- Correlation between the ASSR threshold in the right ear at 0.5 kHz and audiometric threshold of the right ear at 0.5 kHz. Mean difference 9.5 ± 12. Pearson’s correlation: 0.80 (significance=0.000).
- Correlation between the ASSR threshold in the right ear at 1 kHz and audiometric threshold of the right ear at 1 kHz. Mean difference 9.8 ± 12. Pearson’s correlation: 0.84 (significance=0.000).
- Correlation between the ASSR threshold in the right ear at 2 kHz and audiometric threshold of the right ear at 2 kHz. Mean difference 19.4 ± 24. Pearson’s correlation: 0.85 (significance=0.000).
- Correlation between the ASSR threshold in the right ear at 4 kHz and audiometric threshold of the right ear at 4 kHz. Mean difference 10.9 ± 11. Pearson’s correlation: 0.83 (significance=0.000).
- Correlation between the ASSR threshold in the left ear at 0.5 kHz and audiometric threshold of the right (left) ear at 0.5kHz. Mean difference 7.2 ± 8. Pearson’s correlation: 0.91 (significance=0.000).
- Correlation between the ASSR threshold in the left ear at 1 kHz and audiometric threshold of the left ear at 1 kHz. Mean difference 11.4 ± 12. Pearson’s correlation: 0.82 (significance=0.000).
- Correlation between the ASSR threshold in the left ear at 2 kHz and audiometric threshold of the left ear at 2 kHz. Mean difference 9.1 ± 12. Pearson’s correlation: 0.84 (significance=0.000).
- Correlation between the ASSR threshold in the left ear at 4 kHz and audiometric threshold of the left ear at 4 kHz. Mean difference 10.1 ± 11. Pearson’s correlation: 0.82 (significance=0.000)
Rodrigues (2010b) reported that the correlation of tone-evoked ABR and ASSRs thresholds at 0.5, 1, 2 and 4 kHz was 0.91, 0.76, 0.81, 0.89, respectively. See Table 4 for an overview of the results.
Table 4: Overview of results studies comparing ASSR and ABR
|
|
Nunez-Batalla (2016) RIGHT |
Nunez-Batalla (2016) LEFT |
Rodrigues (2010b) |
|
0.5 kHz |
0.80 |
0.91 |
0.91 |
|
1 kHz |
0.84 |
0.82 |
0.76 |
|
2 kHz |
0.85 |
0.84 |
0.81 |
|
4 kHz |
0.83 |
0.82 |
0.89 |
Intraclass correlation coefficients
Rodrigues (2010a) reported that the intraclass correlation coefficients between click-BERA and ASSR were 0.70, 0.64, 0.49, 0.69, 0.63 and 0.68 for 1, 2, 4, 1-2, 2-4, and 1-2-4 kHz, respectively.
Level of evidence of the literature
Summary
Most observational studies do suggest a similar effect in diagnostic accuracy for the various tests used. The level of evidence (GRADE method) is determined per comparison and outcome measure and is based on results from 12 observational studies and starts at level “HIGH” (diagnostic studies). Subsequently, the level of evidence was downgraded if there were relevant shortcomings in one of the several GRADE domains: risk of bias, inconsistency, indirectness, imprecision, and publication bias. The level of evidence was downgraded by two levels because of risk of bias (-1) due to heterogeneity in study population, and indirectness (-1) due to the outcome measure not being diagnostic accuracy but correlation coefficients (Pearson’s or intraclass). Furthermore, due to heterogeneity in study population, pooling of data was not feasible.
Zoeken en selecteren
Welke type ABR-onderzoek kan het best gebruikt worden om de gehoordrempels vast te stellen bij kinderen van 0-9 maanden?
A systematic review of the literature was performed to answer the following question: Which stimulus is best to use with ABR to determine the hearing thresholds in children aged 0-9 months?
| P: | Children aged 0-9 months with hearing loss |
| I: | ABR, BERA, ASSR, audiometry |
| C/R: | ABR, BERA, ASSR, audiometry |
| O: | Diagnostic accuracy (sensitivity, specificity, PPV, NPV), or other means of correlation (including Pearson correlation, intraclass coefficient, McNemar test) |
Relevant outcome measures
The guideline development group considered diagnostic accuracy a critical outcome measure for decision making.
A priori, the working group did not define the outcome measures listed above but used the definitions used in the studies.
Search and select (Methods)
The databases Medline (via OVID) and Embase (via Embase.com) were searched with relevant search terms from 2007 until April 5th, 2023. The detailed search strategy is depicted under the tab Methods. The systematic literature search resulted in 1562 hits. Studies were selected based on the following criteria:
- Systematic review (detailed search strategy, risk of bias assessment, and results of individual comparative studies available), randomized control trial or observational comparative study;
- Research question includes all elements of the PICO;
- Full text available;
- Full text written in English or Dutch.
58 studies were initially selected based on title and abstract screening. After reading the full text, 46 studies were excluded (see the table with reasons for exclusion under the tab Methods), and 12 studies were included. None of the included studies were randomized or pseudorandomized studies.
Results
Twelve observational studies were included in the analysis of the literature. Important study characteristics and results are summarized in the evidence tables. The assessment of the risk of bias is summarized in the risk of bias tables. Studies were divided into three comparisons: ASSR vs audiometry, ABR vs audiometry and ABR vs ASSR. Due to heterogeneity between study design, exposures and outcome definitions, it was decided to not pool the results.
Referenties
- Baldwin M, Watkin P. Predicting the degree of hearing loss using click auditory brainstem response in babies referred from newborn hearing screening. Ear Hear. 2013 May-Jun;34(3):361-9. doi: 10.1097/AUD.0b013e3182728b88. PMID: 23340456.
- Baldwin M, Watkin P. Predicting the type of hearing loss using click auditory brainstem response in babies referred from newborn hearing screening. Ear Hear. 2014 Jan-Feb;35(1):1-9. doi: 10.1097/AUD.0b013e31829e0718. PMID: 24105268.
- British Society of Audiology. Guidelines for the early audiological assessment and management of babies referred from the newborn hearing screening programma; Dec 2021. Available from: OD104-98-BSA-Practice-Guidance-Early-Assessment-Management.pdf (thebsa.org.uk)
- Chou YF, Chen PR, Yu SH, Wen YH, Wu HP. Using multi-stimulus auditory steady state response to predict hearing thresholds in high-risk infants. Eur Arch Otorhinolaryngol. 2012 Jan;269(1):73-9. doi: 10.1007/s00405-011-1604-0. Epub 2011 Apr 22. PMID: 21512805.
- Delaroche M, Thiébaut R, Dauman R. Behavioral audiometry: validity of audiometric measurements obtained using the "Delaroche protocol" in babies aged 4--18 months suffering from bilateral sensorineural hearing loss. Int J Pediatr Otorhinolaryngol. 2006 Jun;70(6):993-1002. doi: 10.1016/j.ijporl.2005.10.010. PMID: 16324753.
- Drift JFC van der. Brainstem response audiometry in the determination of hearing loss. Doctoral dissertation, Erasmus Universiteit Rotterdam. 1988. p.1-2. https://repub.eur.nl/pub/40264/880624_DRIFT,%20Jacob%20Frank%20Christiaan%20van%20der.pdf
- Ferm I, Lightfoot G, Stevens J. Comparison of ABR response amplitude, test time, and estimation of hearing threshold using frequency specific chirp and tone pip stimuli in newborns. Int J Audiol. 2013 Jun;52(6):419-23. doi: 10.3109/14992027.2013.769280.
- Ferm I, Lightfoot G. Further comparisonbs of ABR response amplitudes, test time, and estimation of hearing threshold using frequency-specific chirp and tone pip stimuli in newborns: Findings at 0.5 and 2 kHz. Int J Audiol. 2015;54(10):745-50. doi: 10.3109/14992027.2015.1058978.
- Lu TM, Wu FW, Chang H, Lin HC. Using click-evoked auditory brainstem response thresholds in infants to estimate the corresponding pure-tone audiometry thresholds in children referred from UNHS. Int J Pediatr Otorhinolaryngol. 2017 Apr;95:57-62. doi: 10.1016/j.ijporl.2017.02.004. Epub 2017 Feb 7. PMID: 28576534.
- Norton SJ, Gorga MP, Widen JE, Folsom RC, Sininger Y, Cone-Wesson B, Vohr BR, Mascher K, Fletcher K. Identification of neonatal hearing impairment: evaluation of transient evoked otoacoustic emission, distortion product otoacoustic emission, and auditory brain stem response test performance. Ear Hear. 2000 Oct;21(5):508-28. doi: 10.1097/00003446-200010000-00013. PMID: 11059707.
- Núñez-Batalla F, Noriega-Iglesias S, Guntín-García M, Carro-Fernández P, Llorente-Pendás JL. Auditory-steady-state response reliability in the audiological diagnosis after neonatal hearing screening. Acta Otorrinolaringol Esp. 2016 Jul-Aug;67(4):193-200. English, Spanish. doi: 10.1016/j.otorri.2015.06.003. Epub 2015 Oct 9. PMID: 26454645.
- Rance G, Briggs RJ. Assessment of hearing in infants with moderate to profound impairment: the Melbourne experience with auditory steady-state evoked potential testing. Ann Otol Rhinol Laryngol Suppl. 2002a May;189:22-8. doi: 10.1177/00034894021110s505. PMID: 12018343.
- Rance G, Rickards F. Prediction of hearing threshold in infants using auditory steady-state evoked potentials. J Am Acad Audiol. 2002b May;13(5):236-45. PMID: 12120716.
- Rance G, Roper R, Symons L, Moody LJ, Poulis C, Dourlay M, Kelly T. Hearing threshold estimation in infants using auditory steady-state responses. J Am Acad Audiol. 2005 May;16(5):291-300. doi: 10.3766/jaaa.16.5.4. PMID: 16119256.
- Rodrigues GR, Lewis DR, Fichino SN. Steady-state auditory evoked responses in audiological diagnosis in children: a comparison with brainstem evoked auditory responses. Braz J Otorhinolaryngol. 2010 Jan-Feb;76(1):96-101. doi: 10.1590/S1808-86942010000100016. PMID: 20339696; PMCID: PMC9446048. A.
- Rodrigues GR, Lewis DR. Threshold prediction in children with sensorioneural hearing loss using the auditory steady-state responses and tone-evoked auditory brain stem response. Int J Pediatr Otorhinolaryngol. 2010 May;74(5):540-6. doi: 10.1016/j.ijporl.2010.02.017. Epub 2010 Mar 29. PMID: 20303185. B.
- Savio G, Perez-Abalo MC, Gaya J, Hernandez O, Mijares E. Test accuracy and prognostic validity of multiple auditory steady state responses for targeted hearing screening. Int J Audiol. 2006 Feb;45(2):109-20. doi: 10.1080/14992020500377980. PMID: 16566249.
- Stevens J, Boul A, Lear S, Parker G, Ashall-Kelly K, Gratton D. Predicitive value of hearing assessment by the auditory brainstem response following universal newborn hearing screening. Int J Audiol. 2013;52:500-6. doi:10.3109/14992027.2013.776180.
- Stroebel D, Swanepoel de W, Groenewald E. Aided auditory steady-state responses in infants. Int J Audiol. 2007 Jun;46(6):287-92. doi: 10.1080/14992020701212630. PMID: 17530513.
- World report on hearing. Geneva: World Health Organization; 2021. Licence: CCBY-NC-SA 3.0 IGO.
- Xu ZM, Cheng WX, Yao ZH. Prediction of frequency-specific hearing threshold using chirp auditory brainstem response in infants with hearing losses. Int J Pediatr Otorhinolaryngol. 2014 May;78(5):812-6. doi: 10.1016/j.ijporl.2014.02.020. Epub 2014 Feb 26. PMID: 24630052.
Verantwoording
Beoordelingsdatum en geldigheid
Publicatiedatum : 22-01-2025
Beoordeeld op geldigheid : 15-01-2025
Algemene gegevens
De ontwikkeling/herziening van deze richtlijnmodule werd ondersteund door het Kennisinstituut van de Federatie Medisch Specialisten (www.demedischspecialist.nl/kennisinstituut) en werd gefinancierd uit de Kwaliteitsgelden Medisch Specialisten (SKMS). De financier heeft geen enkele invloed gehad op de inhoud van de richtlijnmodule.
Samenstelling werkgroep
Voor het ontwikkelen van de richtlijnmodule is in 2021 een multidisciplinaire werkgroep ingesteld, bestaande uit vertegenwoordigers van alle relevante specialismen (zie hiervoor de Samenstelling van de werkgroep) die betrokken zijn bij de audiologische zorg voor slechthorende kinderen van 0 tot 4 jaar.
Werkgroep
- Dr. Y.J.W. Simis, voorzitter, klinisch fysicus audioloog, Nederlandse Vereniging voor Klinische Fysica (NVKF)
- Ir. M.S. Toll, klinisch fysicus audioloog, Nederlandse Vereniging voor Klinische Fysica (NVKF)
- Dr. Ir. W.J.A. Koopmans, klinisch fysicus audioloog, Nederlandse Vereniging voor Klinische Fysica (NVKF)
- Ir. J.G. Kleinhuis, klinisch fysicus audioloog, Nederlandse Vereniging voor Klinische Fysica (NVKF)
- Dr. D.C.P.B.M. Breukels, klinisch fysicus audioloog, Nederlandse Vereniging voor Klinische Fysica (NVKF)
- Dr. Ir. R.A. Boerboom, klinisch fysicus audioloog, Nederlandse Vereniging voor Klinische Fysica (NVKF)
- Dr. R.J.H. Ensink, KNO-arts, Nederlandse Vereniging voor Keel-Neus-Oorheelkunde en Heelkunde van het Hoofd-Halsgebied (NVKNO)
- Dr. E. Huysmans, klinisch-linguïst/master in audiologie, Vereniging voor Klinische Linguïstiek (VKL)
- Dr. E. Dirks, psycholoog, Nederlands Instituut van Psychologen (NIP)
- M.P. van der Heijden, audiologisch maatschappelijk werker, Landelijk Werkverband Maatschappelijk werkers in de Audiologie (LWMA)
Klankbordgroep
- C.P.W.M. van Daelen-Swinkels, logopedist, Nederlandse vereniging voor Logopedie en Foniatrie (NVLF)
- Dr. A.S. Smeijers, kinderarts, Nederlandse Vereniging voor Kindergeneeskunde (NVK)
- R. Glijsteen, huisarts, persoonlijke titel
- Dr. Ir. P. Brienesse, klinisch fysicus audioloog, Nederlandse Vereniging voor Klinische Fysica (NVKF)
- C. ter Huurne, klinisch fysicus audioloog, Nederlandse Vereniging voor Klinische Fysica (NVKF)
- J. Hoogeveen, Federatie van Ouders van Dove Kinderen (FODOK)
- L. Zwemmer, audioloog, Master Audiologen actief in Nederland (MAaN)
- B. van Malcot, audioloog, Master Audiologen actief in Nederland (MAaN)
Met ondersteuning van
- L.W.M. Boerboom, literatuurspecialist, Kennisinstituut van Federatie Medisch Specialisten
- L.H.M. Niesink-Boerboom, literatuurspecialist, Kennisinstituut van Federatie Medisch Specialisten
- Dr. N. van der Zwaluw, senior adviseur, Kennisinstituut van Federatie Medisch Specialisten
- Drs. A.E. Sussenbach, adviseur, Kennisinstituut van Federatie Medisch Specialisten
- Dr. W. Lijfering, senior adviseur, Kennisinstituut van Federatie Medisch Specialisten
Belangenverklaringen
De Code ter voorkoming van oneigenlijke beïnvloeding door belangenverstrengeling is gevolgd. Alle werkgroepleden hebben schriftelijk verklaard of zij in de laatste drie jaar directe financiële belangen (betrekking bij een commercieel bedrijf, persoonlijke financiële belangen, onderzoeksfinanciering) of indirecte belangen (persoonlijke relaties, reputatiemanagement) hebben gehad. Gedurende de ontwikkeling of herziening van een module worden wijzigingen in belangen aan de voorzitter doorgegeven. De belangenverklaring wordt opnieuw bevestigd tijdens de commentaarfase.
Een overzicht van de belangen van werkgroepleden en het oordeel over het omgaan met eventuele belangen vindt u in onderstaande tabel. De ondertekende belangenverklaringen zijn op te vragen bij het secretariaat van het Kennisinstituut van de Federatie Medisch Specialisten.
|
Werkgroeplid |
Functie |
Nevenfuncties |
Gemelde belangen |
Ondernomen actie |
|
Dr. Y.J.W. Simis |
klinisch fysicus -audioloog, Amsterdam UMC |
Extern lid van de klachtencommissie voor medewerkers, MOC 't Kabouterhuis, Amsterdam |
Geen |
Geen restricties |
|
Ir. M.S. Toll |
klinisch fysicus -audioloog, ErasmusMC |
Lid programmacommissie neonatale gehoorscreening |
Geen |
Geen restricties |
|
Dr. Ir. W.J.A. Koopmans |
klinisch fysicus -audioloog, Pento |
Geen |
Geen |
Geen restricties |
|
Ir. J.G. Kleinhuis |
klinisch fysicus -audioloog, Pento |
Geen |
Geen |
Geen restricties |
|
Dr. D.C.P.B.M. Breukels |
klinisch fysicus -audioloog, MUMC+ |
Geen |
Geen |
Geen restricties |
|
Dr. Ir. R.A. Boerboom |
klinisch fysicus -audioloog, UMC Utrecht |
Geen |
Extern gefinancierd onderzoek: Evaluating cochlear insertion trauma and hearing preservation after cochlear implantation (CIPRES) |
Restricties t.a.v. aanbevelingen m.b.t. cochleaire implantaten |
|
Dr. R.J.H. Ensink |
KNO-arts |
lid adviescommissie richtlijnen |
Geen |
Geen restricties |
|
Dr. E. Huysmans |
Klinisch linguïst, Amsterdam UMC |
Geen |
Geen |
Geen restricties |
|
Dr. E. Dirks |
Psycholoog, NSDSK |
Docent ontwikkelingspsychologie universiteit Utrecht (gedetacheerd vanuit NSDSK). Docent postmaster opleiding schoolpsycholoog (betaald 35 uur per jaar). bestuurslid sectie jeugd Nip (vrijwillig) |
Geen |
Geen restricties |
|
M.P. van der Heijden |
Maatschappelijk werker, Libra |
Bestuurslid LWMA |
Geen |
Geen restricties |
Inbreng patiëntenperspectief
Er werd aandacht besteed aan het perspectief van ouders/verzorgers van patiënten door het uitnodigen van patiëntenfederaties FODOK en FOSS voor de invitational conference. Het verslag hiervan [zie aanverwante producten] is besproken in de werkgroep. De verkregen input is meegenomen bij het opstellen van de uitgangsvragen, de keuze voor de uitkomstmaten en bij het opstellen van de overwegingen. De conceptrichtlijn is tevens voor commentaar voorgelegd aan FODOK en FOSS en de eventueel aangeleverde commentaren zijn bekeken en verwerkt.
Kwalitatieve raming van mogelijke financiële gevolgen in het kader van de Wkkgz (wordt na de commentaarfase ingevuld)
Bij de richtlijnmodule is conform de Wet kwaliteit, klachten en geschillen zorg (Wkkgz) een kwalitatieve raming uitgevoerd om te beoordelen of de aanbevelingen mogelijk leiden tot substantiële financiële gevolgen. Bij het uitvoeren van deze beoordeling is de richtlijnmodule op verschillende domeinen getoetst (zie het stroomschema op de Richtlijnendatabase).
Module |
Uitkomst raming |
Toelichting |
|
Module Diagnostiek 0-9 maanden |
Geen financiële gevolgen |
Hoewel uit de toetsing volgt dat de aanbeveling(en) breed toepasbaar zijn (>40.000 patiënten), volgt uit de toetsing dat het overgrote deel (±90%) van de zorgaanbieders en zorgverleners al aan de norm voldoet. Er worden daarom geen financiële gevolgen verwacht. |
Werkwijze
AGREE
Deze richtlijnmodule is opgesteld conform de eisen vermeld in het rapport Medisch Specialistische Richtlijnen 2.0 van de adviescommissie Richtlijnen van de Raad Kwaliteit. Dit rapport is gebaseerd op het AGREE II instrument (Appraisal of Guidelines for Research & Evaluation II; Brouwers, 2010).
Knelpuntenanalyse en uitgangsvragen
Tijdens de voorbereidende fase inventariseerde de werkgroep de knelpunten in de zorg voor slechthorende kinderen van 0-4 jaar. Tevens zijn er knelpunten aangedragen door verschillende partijen via een invitational conference. Een verslag hiervan is opgenomen onder aanverwante producten.
Op basis van de uitkomsten van de knelpuntenanalyse zijn door de werkgroep concept-uitgangsvragen opgesteld en definitief vastgesteld.
Uitkomstmaten
Na het opstellen van de zoekvraag behorende bij de uitgangsvraag inventariseerde de werkgroep welke uitkomstmaten voor de patiënt relevant zijn, waarbij zowel naar gewenste als ongewenste effecten werd gekeken. Hierbij werd een maximum van acht uitkomstmaten gehanteerd. De werkgroep waardeerde deze uitkomstmaten volgens hun relatieve belang bij de besluitvorming rondom aanbevelingen, als cruciaal (kritiek voor de besluitvorming), belangrijk (maar niet cruciaal) en onbelangrijk. Tevens definieerde de werkgroep tenminste voor de cruciale uitkomstmaten welke verschillen zij klinisch (patiënt) relevant vonden.
Methode literatuursamenvatting
Een uitgebreide beschrijving van de strategie voor zoeken en selecteren van literatuur is te vinden onder ‘Zoeken en selecteren’ onder Onderbouwing. Indien mogelijk werd de data uit verschillende studies gepoold in een random-effects model. Review Manager 5.4 werd gebruikt voor de statistische analyses. De beoordeling van de kracht van het wetenschappelijke bewijs wordt hieronder toegelicht.
Beoordelen van de kracht van het wetenschappelijke bewijs
De kracht van het wetenschappelijke bewijs werd bepaald volgens de GRADE-methode. GRADE staat voor ‘Grading Recommendations Assessment, Development and Evaluation’ (zie http://www.gradeworkinggroup.org/). De basisprincipes van de GRADE-methodiek zijn: het benoemen en prioriteren van de klinisch (patiënt) relevante uitkomstmaten, een systematische review per uitkomstmaat, en een beoordeling van de bewijskracht per uitkomstmaat op basis van de acht GRADE-domeinen (domeinen voor downgraden: risk of bias, inconsistentie, indirectheid, imprecisie, en publicatiebias; domeinen voor upgraden: dosis-effect relatie, groot effect, en residuele plausibele confounding).
GRADE onderscheidt vier gradaties voor de kwaliteit van het wetenschappelijk bewijs: hoog, redelijk, laag en zeer laag. Deze gradaties verwijzen naar de mate van zekerheid die er bestaat over de literatuurconclusie, in het bijzonder de mate van zekerheid dat de literatuurconclusie de aanbeveling adequaat ondersteunt (Schünemann, 2013; Hultcrantz, 2017).
|
GRADE |
Definitie |
|
Hoog |
|
|
Redelijk |
|
|
Laag |
|
|
Zeer laag |
|
Bij het beoordelen (graderen) van de kracht van het wetenschappelijk bewijs in richtlijnen volgens de GRADE-methodiek spelen grenzen voor klinische besluitvorming een belangrijke rol (Hultcrantz, 2017). Dit zijn de grenzen die bij overschrijding aanleiding zouden geven tot een aanpassing van de aanbeveling. Om de grenzen voor klinische besluitvorming te bepalen moeten alle relevante uitkomstmaten en overwegingen worden meegewogen. De grenzen voor klinische besluitvorming zijn daarmee niet één op één vergelijkbaar met het minimaal klinisch relevant verschil (Minimal Clinically Important Difference, MCID). Met name in situaties waarin een interventie geen belangrijke nadelen heeft en de kosten relatief laag zijn, kan de grens voor klinische besluitvorming met betrekking tot de effectiviteit van de interventie bij een lagere waarde (dichter bij het nuleffect) liggen dan de MCID (Hultcrantz, 2017).
Overwegingen (van bewijs naar aanbeveling)
Om te komen tot een aanbeveling zijn naast (de kwaliteit van) het wetenschappelijke bewijs ook andere aspecten belangrijk en worden meegewogen, zoals aanvullende argumenten uit bijvoorbeeld de biomechanica of fysiologie, waarden en voorkeuren van patiënten, kosten (middelenbeslag), aanvaardbaarheid, haalbaarheid en implementatie. Deze aspecten zijn systematisch vermeld en beoordeeld (gewogen) onder het kopje ‘Overwegingen’ en kunnen (mede) gebaseerd zijn op expert opinion. Hierbij is gebruik gemaakt van een gestructureerd format gebaseerd op het evidence-to-decision framework van de internationale GRADE Working Group (Alonso-Coello, 2016a; Alonso-Coello 2016b). Dit evidence-to-decision framework is een integraal onderdeel van de GRADE methodiek.
Formuleren van aanbevelingen
De aanbevelingen geven antwoord op de uitgangsvraag en zijn gebaseerd op het beschikbare wetenschappelijke bewijs en de belangrijkste overwegingen, en een weging van de gunstige en ongunstige effecten van de relevante interventies. De kracht van het wetenschappelijk bewijs en het gewicht dat door de werkgroep wordt toegekend aan de overwegingen, bepalen samen de sterkte van de aanbeveling. Conform de GRADE-methodiek sluit een lage bewijskracht van conclusies in de systematische literatuuranalyse een sterke aanbeveling niet a priori uit, en zijn bij een hoge bewijskracht ook zwakke aanbevelingen mogelijk (Agoritsas, 2017; Neumann, 2016). De sterkte van de aanbeveling wordt altijd bepaald door weging van alle relevante argumenten tezamen. De werkgroep heeft bij elke aanbeveling opgenomen hoe zij tot de richting en sterkte van de aanbeveling zijn gekomen.
In de GRADE-methodiek wordt onderscheid gemaakt tussen sterke en zwakke (of conditionele) aanbevelingen. De sterkte van een aanbeveling verwijst naar de mate van zekerheid dat de voordelen van de interventie opwegen tegen de nadelen (of vice versa), gezien over het hele spectrum van patiënten waarvoor de aanbeveling is bedoeld. De sterkte van een aanbeveling heeft duidelijke implicaties voor patiënten, behandelaars en beleidsmakers (zie onderstaande tabel). Een aanbeveling is geen dictaat, zelfs een sterke aanbeveling gebaseerd op bewijs van hoge kwaliteit (GRADE gradering HOOG) zal niet altijd van toepassing zijn, onder alle mogelijke omstandigheden en voor elke individuele patiënt.
|
Implicaties van sterke en zwakke aanbevelingen voor verschillende richtlijngebruikers |
||
|
|
||
|
|
Sterke aanbeveling |
Zwakke (conditionele) aanbeveling |
|
Voor patiënten |
De meeste patiënten zouden de aanbevolen interventie of aanpak kiezen en slechts een klein aantal niet. |
Een aanzienlijk deel van de patiënten zouden de aanbevolen interventie of aanpak kiezen, maar veel patiënten ook niet. |
|
Voor behandelaars |
De meeste patiënten zouden de aanbevolen interventie of aanpak moeten ontvangen. |
Er zijn meerdere geschikte interventies of aanpakken. De patiënt moet worden ondersteund bij de keuze voor de interventie of aanpak die het beste aansluit bij zijn of haar waarden en voorkeuren. |
|
Voor beleidsmakers |
De aanbevolen interventie of aanpak kan worden gezien als standaardbeleid. |
Beleidsbepaling vereist uitvoerige discussie met betrokkenheid van veel stakeholders. Er is een grotere kans op lokale beleidsverschillen. |
Organisatie van zorg
In de knelpuntenanalyse en bij de ontwikkeling van de richtlijnmodule is expliciet aandacht geweest voor de organisatie van zorg: alle aspecten die randvoorwaardelijk zijn voor het verlenen van zorg (zoals coördinatie, communicatie, (financiële) middelen, mankracht en infrastructuur). Randvoorwaarden die relevant zijn voor het beantwoorden van deze specifieke uitgangsvraag zijn genoemd bij de overwegingen. Meer algemene, overkoepelende, of bijkomende aspecten van de organisatie van zorg worden behandeld in de module Organisatie van zorg.
Commentaar- en autorisatiefase
De conceptrichtlijnmodule werd aan de betrokken (wetenschappelijke) verenigingen en (patiënt) organisaties voorgelegd ter commentaar. De commentaren werden verzameld en besproken met de werkgroep. Naar aanleiding van de commentaren werd de conceptrichtlijnmodule aangepast en definitief vastgesteld door de werkgroep. De definitieve richtlijnmodule werd aan de deelnemende (wetenschappelijke) verenigingen en (patiënt) organisaties voorgelegd voor autorisatie en door hen geautoriseerd dan wel geaccordeerd.
Literatuur
Agoritsas T, Merglen A, Heen AF, Kristiansen A, Neumann I, Brito JP, Brignardello-Petersen R, Alexander PE, Rind DM, Vandvik PO, Guyatt GH. UpToDate adherence to GRADE criteria for strong recommendations: an analytical survey. BMJ Open. 2017 Nov 16;7(11):e018593. doi: 10.1136/bmjopen-2017-018593. PubMed PMID: 29150475; PubMed Central PMCID: PMC5701989.
Alonso-Coello P, Schünemann HJ, Moberg J, Brignardello-Petersen R, Akl EA, Davoli M, Treweek S, Mustafa RA, Rada G, Rosenbaum S, Morelli A, Guyatt GH, Oxman AD; GRADE Working Group. GRADE Evidence to Decision (EtD) frameworks: a systematic and transparent approach to making well informed healthcare choices. 1: Introduction. BMJ. 2016 Jun 28;353:i2016. doi: 10.1136/bmj.i2016. PubMed PMID: 27353417.
Alonso-Coello P, Oxman AD, Moberg J, Brignardello-Petersen R, Akl EA, Davoli M, Treweek S, Mustafa RA, Vandvik PO, Meerpohl J, Guyatt GH, Schünemann HJ; GRADE Working Group. GRADE Evidence to Decision (EtD) frameworks: a systematic and transparent approach to making well informed healthcare choices. 2: Clinical practice guidelines. BMJ. 2016 Jun 30;353:i2089. doi: 10.1136/bmj.i2089. PubMed PMID: 27365494.
Brouwers MC, Kho ME, Browman GP, Burgers JS, Cluzeau F, Feder G, Fervers B, Graham ID, Grimshaw J, Hanna SE, Littlejohns P, Makarski J, Zitzelsberger L; AGREE Next Steps Consortium. AGREE II: advancing guideline development, reporting and evaluation in health care. CMAJ. 2010 Dec 14;182(18):E839-42. doi: 10.1503/cmaj.090449. Epub 2010 Jul 5. Review. PubMed PMID: 20603348; PubMed Central PMCID: PMC3001530.
Hultcrantz M, Rind D, Akl EA, Treweek S, Mustafa RA, Iorio A, Alper BS, Meerpohl JJ, Murad MH, Ansari MT, Katikireddi SV, Östlund P, Tranæus S, Christensen R, Gartlehner G, Brozek J, Izcovich A, Schünemann H, Guyatt G. The GRADE Working Group clarifies the construct of certainty of evidence. J Clin Epidemiol. 2017 Jul;87:4-13. doi: 10.1016/j.jclinepi.2017.05.006. Epub 2017 May 18. PubMed PMID: 28529184; PubMed Central PMCID: PMC6542664.
Medisch Specialistische Richtlijnen 2.0 (2012). Adviescommissie Richtlijnen van de Raad Kwalitieit. http://richtlijnendatabase.nl/over_deze_site/over_richtlijnontwikkeling.html
Neumann I, Santesso N, Akl EA, Rind DM, Vandvik PO, Alonso-Coello P, Agoritsas T, Mustafa RA, Alexander PE, Schünemann H, Guyatt GH. A guide for health professionals to interpret and use recommendations in guidelines developed with the GRADE approach. J Clin Epidemiol. 2016 Apr;72:45-55. doi: 10.1016/j.jclinepi.2015.11.017. Epub 2016 Jan 6. Review. PubMed PMID: 26772609.
Schünemann H, Brożek J, Guyatt G, et al. GRADE handbook for grading quality of evidence and strength of recommendations. Updated October 2013. The GRADE Working Group, 2013. Available from http://gdt.guidelinedevelopment.org/central_prod/_design/client/handbook/handbook.html.